. 2017 Nov;23(11):1369-1376.
doi: 10.1038/nm.4416. Epub 2017 Sep 18.

The N6-methyladenosine (m6A)-forming enzyme METTL3 controls myeloid differentiation of normal hematopoietic and leukemia cells

Affiliations

The N6-methyladenosine (m6A)-forming enzyme METTL3 controls myeloid differentiation of normal hematopoietic and leukemia cells

Ly P Vu et al. Nat Med. 2017 Nov.

Abstract

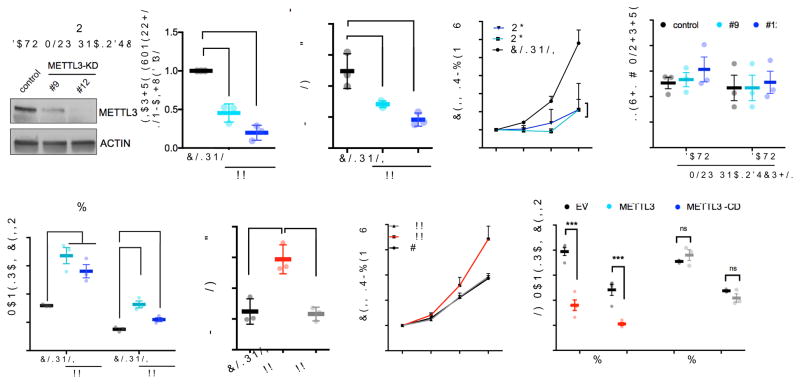
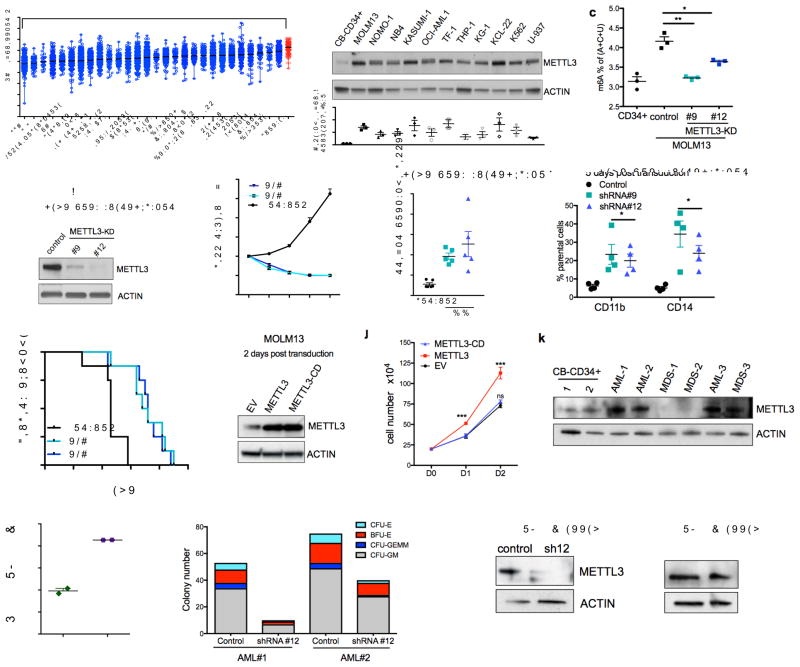
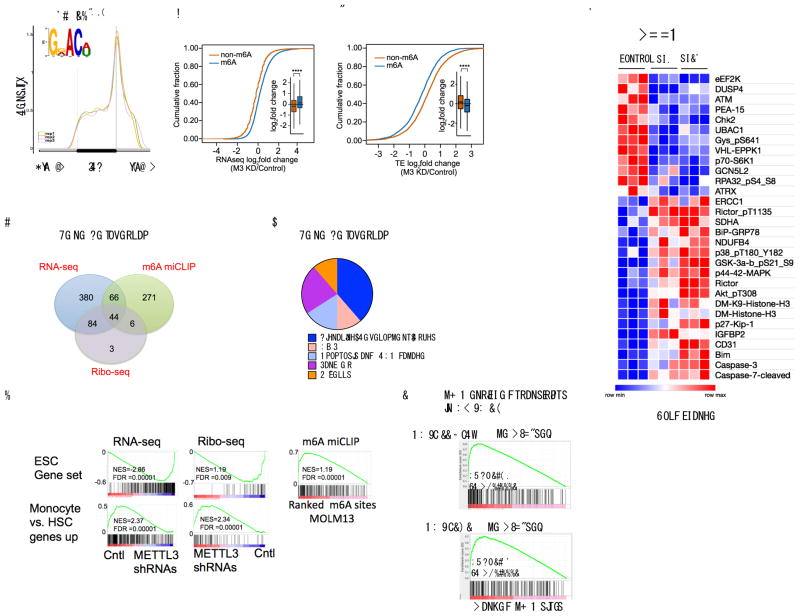
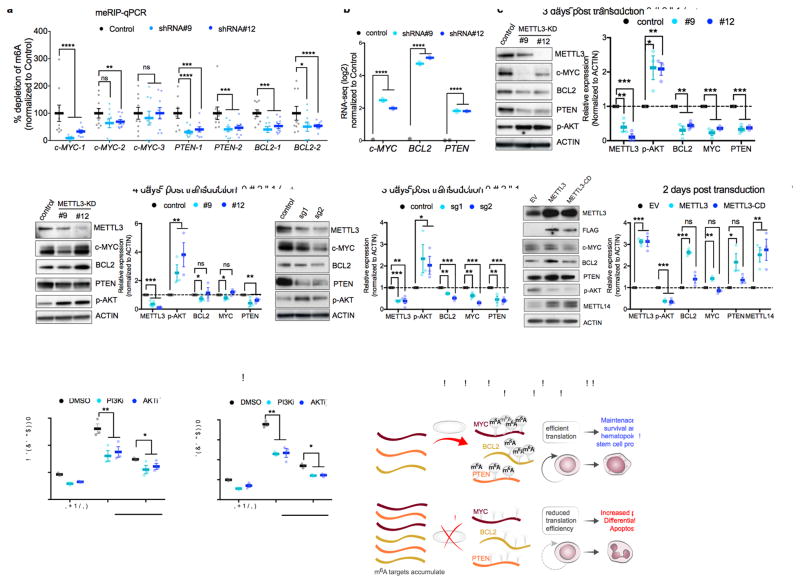
N6-methyladenosine (m6A) is an abundant nucleotide modification in mRNA that is required for the differentiation of mouse embryonic stem cells. However, it remains unknown whether the m6A modification controls the differentiation of normal and/or malignant myeloid hematopoietic cells. Here we show that shRNA-mediated depletion of the m6A-forming enzyme METTL3 in human hematopoietic stem/progenitor cells (HSPCs) promotes cell differentiation, coupled with reduced cell proliferation. Conversely, overexpression of wild-type METTL3, but not of a catalytically inactive form of METTL3, inhibits cell differentiation and increases cell growth. METTL3 mRNA and protein are expressed more abundantly in acute myeloid leukemia (AML) cells than in healthy HSPCs or other types of tumor cells. Furthermore, METTL3 depletion in human myeloid leukemia cell lines induces cell differentiation and apoptosis and delays leukemia progression in recipient mice in vivo. Single-nucleotide-resolution mapping of m6A coupled with ribosome profiling reveals that m6A promotes the translation of c-MYC, BCL2 and PTEN mRNAs in the human acute myeloid leukemia MOLM-13 cell line. Moreover, loss of METTL3 leads to increased levels of phosphorylated AKT, which contributes to the differentiation-promoting effects of METTL3 depletion. Overall, these results provide a rationale for the therapeutic targeting of METTL3 in myeloid leukemia.


Conflict of interest statement

Competing Financial Interest Statement

There is no competing interest.

Figures

Figure 1
Figure 1. m6A inhibits myeloid differentiation of human stem/progenitor cells (HSPCs)
(a–e) Human cord blood CD34+ (HSPCs) cells were transduced with lentiviruses expressing either a scramble (control) shRNA or two independent shRNAs targeting METTL3 (#9 and #12; METTL3-KD). (a) Cells were selected for puromycin resistance and immunoblotted at four days post-transduction. Left, representative immunoblot. Right, the quantitative summary n=3 independent experiments; error bars, s.e.m. **p<0.01,***p<0.001 two-tailed t test. (b) m6A levels in poly(A) purified mRNA were quantified by two-dimensional thin layer chromatography (2D-TLC, see methods). n=3 independent experiments; error bars, s.e.m. * p<0.05, two-tailed t test. (c) The number of viable cells was measured over the course of seven days beginning four days post-transduction of shRNAs. n=3 independent experiments; error bars, s.e.m. * p<0.05, two-tailed t test. (d) The percentage of apoptotic cells was determined at day four and five post-transduction. Cells were stained for Annexin V and DAPI and quantified by flow cytometry. (e) Myeloid differentiation was measured using CD11b and CD14 as markers of myeloid differentiation. Cells were stained and expression of each surface marker was quantified by flow cytometry seven days after plating. error bars, s.e.m. * p<0.05, **p<0.001, two-tailed t test. (f–h) Human cord blood CD34+ (HSPCs) cells were transduced with retroviruses expressing GFP together with empty vector (EV) or wild type METTL3 or catalytically dead METTL3 (METTL3-CD). Cells were sorted based on GFP positivity two days post transduction. (f) At XX time point cells were analyzed by XXX method. Immunoblots at two days post transductions n=3 independent experiments; error bars, s.e.m. ** p<0.01, two-tailed t test. (g) Sorted cells were plated in basic media (See Supplementary methods). Cells were counted for seven days after plating. EV: Empty vector (black line), METTL3 (red line), catalytically dead METTL3-CD (gray line). n=4 independent experiments; error bars, s.e.m. * p<0.05, two-tailed t test. (h) Myeloid differentiation was evaluated as in (e) seven days after plating in myeloid differentiation conditions. n=4 independent experiments; error bars, s.e.m. * p<0.05, *** p <0.0001 two-tailed t test.
Figure 2
Figure 2. m6A promotes leukemogenesis
(a) METTL3 mRNA expression in acute myeloid leukemia (AML) compared to other cancers (The Cancer Genome Atlas database). Data are presented as mean log2 expression with range. AML: orange dots, **** p<0.00001, ** p<0.01 ANOVA with multiple comparisons, (b) METTL3 protein expression in AML cell lines compared to normal HSPCs. Top: An immunoblot for METTL3 and loading control (ACTIN) in the indicated myeloid leukemia cell lines and cord blood (CB) CD34+ cells. Bottom: quantitative summary of the immunoblots. n=3 independent experiments; error bars, s.e.m. * p<0.05, **p<0.01,***p<0.001 two-tailed t test. (c) Global m6A levels in AML cells versus normal HSPCs. m6A levels from poly(A) purified mRNA were quantified in CB-CD34+ and MOLM-13 AML cells by two-dimensional thin layer chromatography (2D-TLC, see methods). n=3 independent experiments, two-tailed t test. (d–h) MOLM13 cells were transduced with lentiviruses expressing either a scramble (control) shRNA or two independent shRNAs targeting METTL3 (#9 and #12; METTL3-KD). Cells were selected for puromycin resistance and assayed four days post transduction. (d) Representative immunoblot for METTL3 depletion four days post-transduction. (e) Proliferation assay of MOLM13 control cells versus METTL3 knockdown. The number of viable cells was measured daily beginning four days post-transduction of shRNAs: shRNA#9 and #12 (light blue and dark blue lines) and control shRNA (black line). (f) The percent of apoptotic cells was determined five days post-transduction by flow cytometry analysis for Annexin V positivity.n=5, independent experiments; error bars, s.e.m. * p<0.05, **p<0.01 two-tailed t test. (g) Cells were stained for myeloid differentiation markers CD11b and CD14 five days post-transduction. Quantification of positive cells was performed by flow cytometry. METTL3 knockdown cells (light and dark blue bars) versus control cells (black bars). n = 4 independent experiments; error bars, s.e.m. * p<0.05, **p<0.01 two-tailed t test. (h) Leukemia-free survival of mice transplanted with MOLM13 cells transduced with either a control shRNA or METTL3-targeting shRNAs. MOLM13 cells at four days post transduction were injected into sub-lethally irradiated mice (n=8 for each group). Mantel-Cox test ****p<0.0001. (i–j) MOLM13 cells were retrovirally transduced with vectors expressing METTL3 and METTL3-CD. Cells were sorted two days post-transduction based on GFP positivity. (i) Representative immunoblot analysis of METTL3 expression. ACTIN serves as loading control. (j) Proliferation assay of MOLM13 cells transduced with empty vector (EV), METTL3, or METTL3-CD overexpressing vectors. The number of viable cells was measured daily beginning two days post-transduction. n = 3 independent experiments; error bars, s.e.m. ***p<0.001 two-tailed t test. (k) Immunoblot analysis of METTL3 protein expression in primary MDS and AML patient cells. ACTIN serves as loading control. Quantitative summary is shown. (l) Global m6A levels in primary AML patient cells versus normal HSPCs. (m) Colony forming ability of primary AML patient cells depleted of METTL3. Primary AML patient cells were transduced with control and shRNA targeting METTL3. Cells were sorted based on GFP positivity after 3 days. Cells were plated in methycellulose and colonies were scored after 14 days. (n) Immunoblot showing METTL3 expression before (D0) and 14 days after (D14) plating of primary AML patient cells in (m). ACTIN serves as loading control. Quantitative summary is shown.
Figure 3
Figure 3. m6A is required for maintaining the translation of target mRNAs that control cell fate
(a) m6A distribution pattern in human leukemia MOLM13 cells. The distribution of m6A in MOLM13 cells was determined at single-nucleotide resolution using miCLIP. The identified m6A sites were plotted in triplicate for their relative distribution across the 5′UTR, coding sequence, and 3′UTR. The m6A DRACH (D= A/G/U, R=A or G, and H= A/C/U) motif was enriched as expected (inset) (E p-value: 2.9*10^973). (b) The abundance of methylated transcripts upon METTL3 knockdown. RNA-Seq of MOLM13 cells was performed four days post transduction with shRNAs. mRNAs were classified as either m6A-containing (m6A, blue) or non-m6A-containing (non-m6A, orange) based on miCLIP analysis. n=3 per condition, **** p<2.2e−16, two-sided Kolmogorov–Smirnov test. (c) The translational efficiency of methylated transcripts upon METTL3 knockdown. Ribo-Seq was performed to determine ribosome-protected fragments in MOLM13 METTL3 knockdown compared to control shRNA cells as in (c). Translational efficiency was calculated as the number of ribosome-protected fragments divided by mRNA expression and mRNAs stratified as either m6A-containing (blue) or non-m6A-containing (orange) as described above. n=3 per condition, **** p<2.2e−16, two-sided Kolmogorov–Smirnov test. (d) Gene set overlap analysis depicted in a Venn diagram (1) enriched for m6A targets, (2) negatively enriched for transcripts upregulated after METTL3 depletion and (3) gene sets negatively enriched for transcripts with reduced translation efficiency in METTL3-depleted cells (For specific gene sets see Supplementary Tables 5, 6, 9 and 10). (e) Pie chart of the 44 overlapping gene sets from (e) manually curated into general pathway categories (see also Supplementary Table 11). (f) Gene set enrichment analysis for the RNA-Seq, translational efficiency and m6A ranked lists. The core ESC gene set is enriched as described in (e and f), (top panels). The gene set promoting monocyte differentiation is enriched as indicated after METTL3 knockdown in MOLM13 cells (bottom panels and see also Supplementary Table 10). (g) Gene set enrichment analysis for the m6A-enriched transcripts in AML patients compared to MOLM13 cells. (h) Heatmap depicting the fold changes in proteins with significantly altered expression (p<0.01) in a reverse phase protein array (RPPA). Cell lysates from MOLM13 cells four days post-transduction with shRNAs were used for RPPA. The arrays consisted of 304 different antibodies for specific proteins and protein modifications. Fold change was determined by averaging biological replicates (n=3) averaged then divided by the control shRNA expression.
Figure 4
Figure 4. m6A directly controls expression of c-MYC, BCL-2 and PTEN
(a) m6A enrichment at transcripts of c-MYC, BCL-2 and PTEN. Poly(A)+ RNA was isolated from control and METTL3 knockdown MOLM13 cells. In vitro transcribed A and m6A-containing mRNA was then immunoprecipitated with an anti-m6A antibody. Enrichment of m6A at multiple sites (boxes highlighted in Supplementary figure 5a) at transcripts of c-MYC, BCL-2 and PTEN was determined by qPCR. (b) MYC, BCL2, and PTEN mRNA expression in MOLM13 METTL3 knockdown cells. Plotted is the average change in expression from RNA-Seq of METTL3 knockdown (light and dark blue) compared to control knockdown cells (black) from Figure 3b. (c–d) Immunoblot analysis for proteins that were associated with the m6A program, e.g., c-MYC, BCL2 and PTEN (based on global genomic approaches or RPPA in Figure 3d–h) The panels are representative blots from three days (c) or four days (d) post-transduction of MOLM13 cells with shRNAs targeting METTL3. ACTIN serves as loading control. Top: representative immunoblot images. Bottom: quantitative summary of the immunoblots. n=3 for 3 days, n=6 for METTL3 expression and n=3 for target genes expression for 4 days independent experiments; error bars, s.e.m. * p<0.05, **p<0.01,***p<0.001 two-tailed t test. (e) Immunoblot analysis for proteins that were associated with the m6A program three days post transduction of MOLM13 cells with sgRNAs targeting METTL3. ACTIN serves as loading control. Top: representative immunoblot images. Bottom: quantitative summary of the immunoblots. n=4 independent experiments; error bars, s.e.m. * p<0.05, **p<0.01,***p<0.001 two-tailed t test (f) Immunoblot analysis for proteins that were associated with the m6A program two days post transduction of MOLM13 cells overexpressing wild type METTL3 or METTL3 catalytically dead (METTL3-CD). ACTIN serves as loading control. Top: representative immunoblot images. Bottom: quantitative summary of the immunoblots. n=3 independent experiments; error bars, s.e.m. * p<0.05, **p<0.01,***p<0.001 two-tailed t test (g–h) Inhibition of the AKT pathway inhibits myeloid differentiation of MOLM13 METTL3 knockdown cells. MOLM13 cells were transduced with shRNAs for three days followed by treatment with DMSO (gray bars), GDC-0068 AKT inhibitor (1 μM, purple bars), or GDC-0032 PI3K inhibitor (0.1 μM, pink bars) for 48 h before myeloid differentiation. Differentiation was assessed by flow cytometry as previously described (Fig. 1m) (n=3 independent experiments; error bars, s.e.m. * p<0.05, **p<0.001, *** p <0.0001 two-tailed t test. (i) A proposed model of METTL3-dependent myeloid differentiation. METTL3 upregulation in AML cells results in methylation of specific mRNAs critical for regulating apoptosis and differentiation, including MYC, BCL2, and PTEN. Methylated targets are efficiently translated resulting in survival, proliferation, and maintenance of the hematopoietic stem cell program (top panel). Depletion of METTL3 in AML cells reduces translation associated with m6A transcripts resulting in AKT activation, differentiation, and apoptosis.

Comment in

References

    1. Meyer KD, et al. Comprehensive analysis of mRNA methylation reveals enrichment in 3′ UTRs and near stop codons. Cell. 2012;149:1635–1646. - PMC - PubMed
    1. Dominissini D, et al. Topology of the human and mouse m6A RNA methylomes revealed by m6A-seq. Nature. 2012;485:201–206. - PubMed
    1. Geula S, et al. Stem cells. m6A mRNA methylation facilitates resolution of naive pluripotency toward differentiation. Science. 2015;347:1002–1006. - PubMed
    1. Batista PJ, et al. m(6)A RNA modification controls cell fate transition in mammalian embryonic stem cells. Cell Stem Cell. 2014;15:707–719. - PMC - PubMed
    1. Li Z, et al. FTO Plays an Oncogenic Role in Acute Myeloid Leukemia as a N6-Methyladenosine RNA Demethylase. Cancer Cell. 2017;31:127–141. - PMC - PubMed

MeSH terms