

Selection on skewed characters and the paradox of stasis
- PMID: 28921508
- PMCID: PMC5959001
- DOI: 10.1111/evo.13368
Selection on skewed characters and the paradox of stasis
Abstract
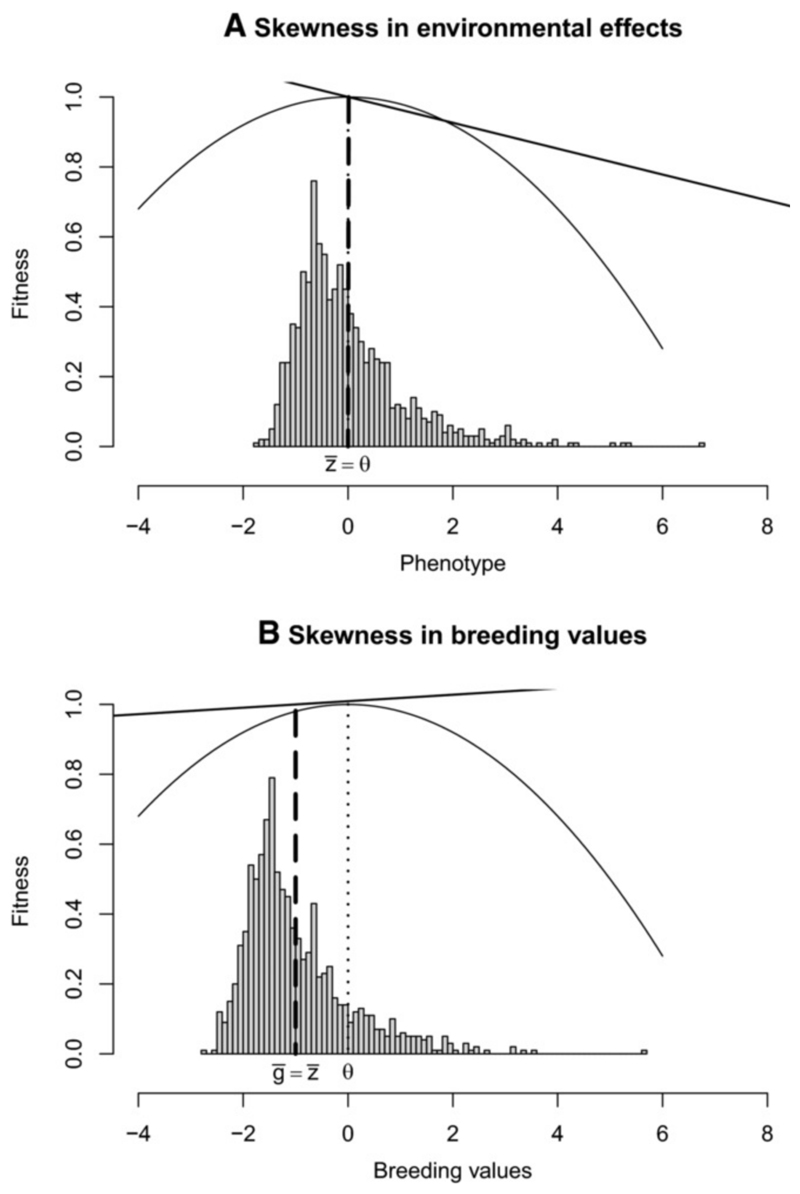
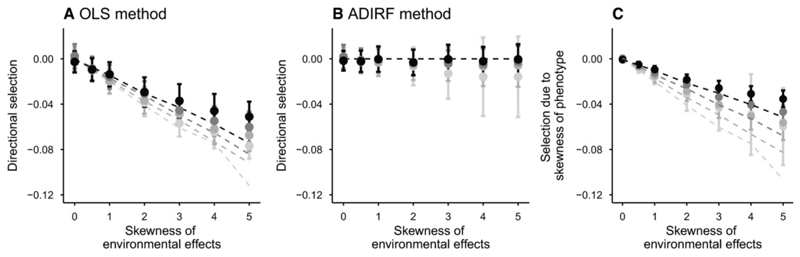
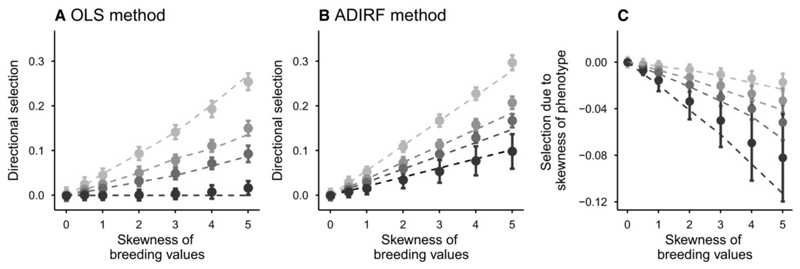
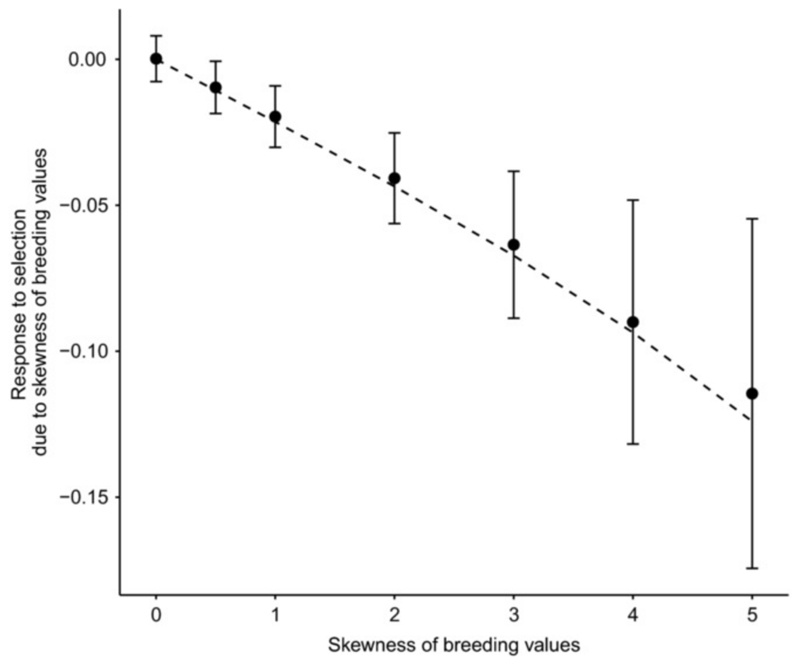
Observed phenotypic responses to selection in the wild often differ from predictions based on measurements of selection and genetic variance. An overlooked hypothesis to explain this paradox of stasis is that a skewed phenotypic distribution affects natural selection and evolution. We show through mathematical modeling that, when a trait selected for an optimum phenotype has a skewed distribution, directional selection is detected even at evolutionary equilibrium, where it causes no change in the mean phenotype. When environmental effects are skewed, Lande and Arnold's (1983) directional gradient is in the direction opposite to the skew. In contrast, skewed breeding values can displace the mean phenotype from the optimum, causing directional selection in the direction of the skew. These effects can be partitioned out using alternative selection estimates based on average derivatives of individual relative fitness, or additive genetic covariances between relative fitness and trait (Robertson-Price identity). We assess the validity of these predictions using simulations of selection estimation under moderate sample sizes. Ecologically relevant traits may commonly have skewed distributions, as we here exemplify with avian laying date - repeatedly described as more evolutionarily stable than expected - so this skewness should be accounted for when investigating evolutionary dynamics in the wild.
Keywords: Paradox of stasis; phenotypic skewness; response to selection; selection estimation; selection gradient.
© 2017 The Author(s). Evolution © 2017 The Society for the Study of Evolution.
Figures
References
-
- Arnold SJ, Pfrender ME, Jones AG. The adaptive landscape as a conceptual bridge between micro- and macroevolution. Genetica. 2001;112–113:9–32. - PubMed
-
- Bradshaw WE, Holzapfel CM. Genetic response to rapid climate change: it ’ s seasonal timing that matters. Molecular Ecology. 2008;17:157–166. - PubMed
-
- Burger R. Moments, cumulants, and polygenic dynamics. Journal of Mathematical Biology. 1991;30:199–213. - PubMed
Publication types
MeSH terms
Associated data
Grants and funding
LinkOut - more resources
Full Text Sources
Other Literature Sources