. 2017 Oct;82(4):602-614.
doi: 10.1002/ana.25049. Epub 2017 Oct 22.

Dendritic spines provide cognitive resilience against Alzheimer's disease

Affiliations

Dendritic spines provide cognitive resilience against Alzheimer's disease

Benjamin D Boros et al. Ann Neurol. 2017 Oct.

Abstract

Objective: Neuroimaging and other biomarker assays suggest that the pathological processes of Alzheimer's disease (AD) begin years prior to clinical dementia onset. However, some 30 to 50% of older individuals who harbor AD pathology do not become symptomatic in their lifetime. It is hypothesized that such individuals exhibit cognitive resilience that protects against AD dementia. We hypothesized that in cases with AD pathology, structural changes in dendritic spines would distinguish individuals who had or did not have clinical dementia.

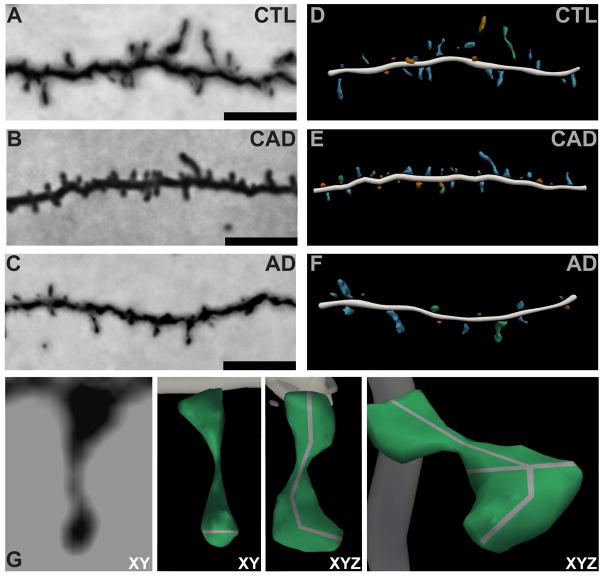
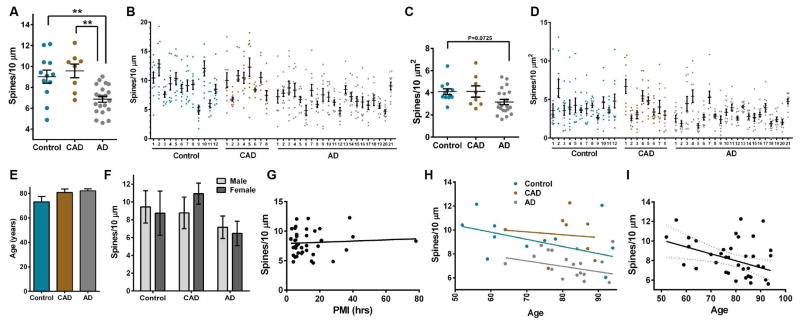
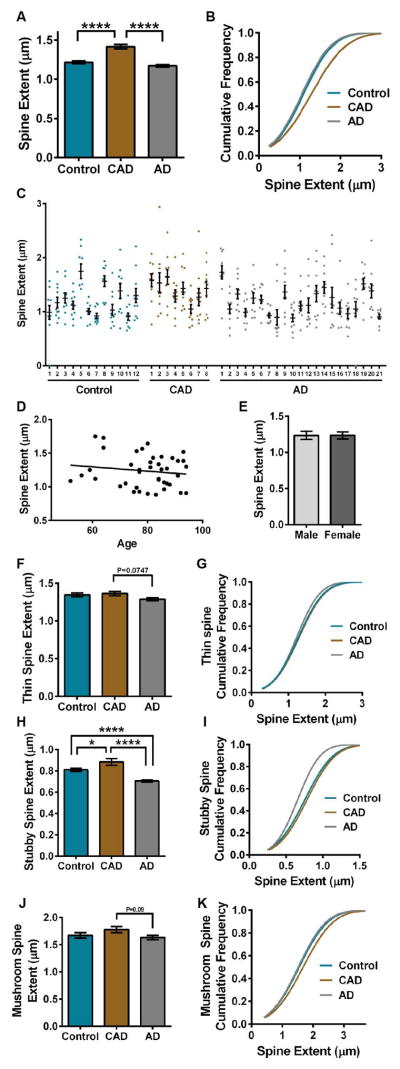
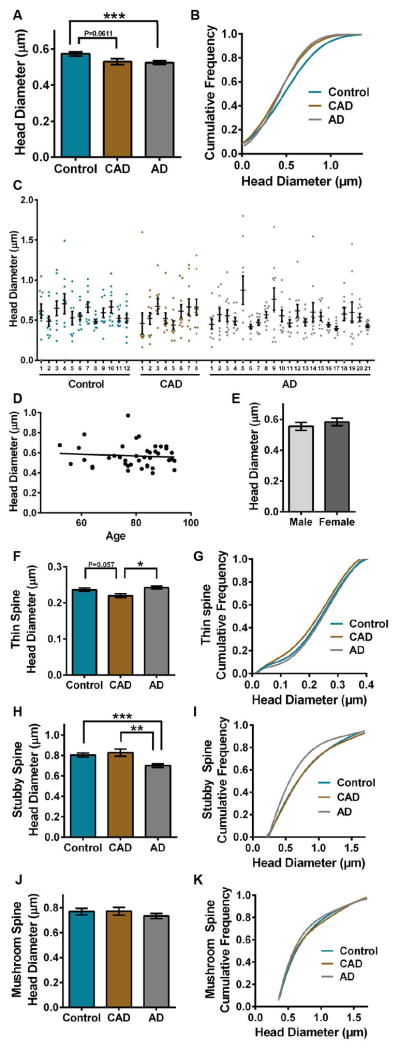
Methods: We compared dendritic spines within layer II and III pyramidal neuron dendrites in Brodmann area 46 dorsolateral prefrontal cortex using the Golgi-Cox technique in 12 age-matched pathology-free controls, 8 controls with AD pathology (CAD), and 21 AD cases. We used highly optimized methods to trace impregnated dendrites from bright-field microscopy images that enabled accurate 3-dimensional digital reconstruction of dendritic structure for morphologic analyses.

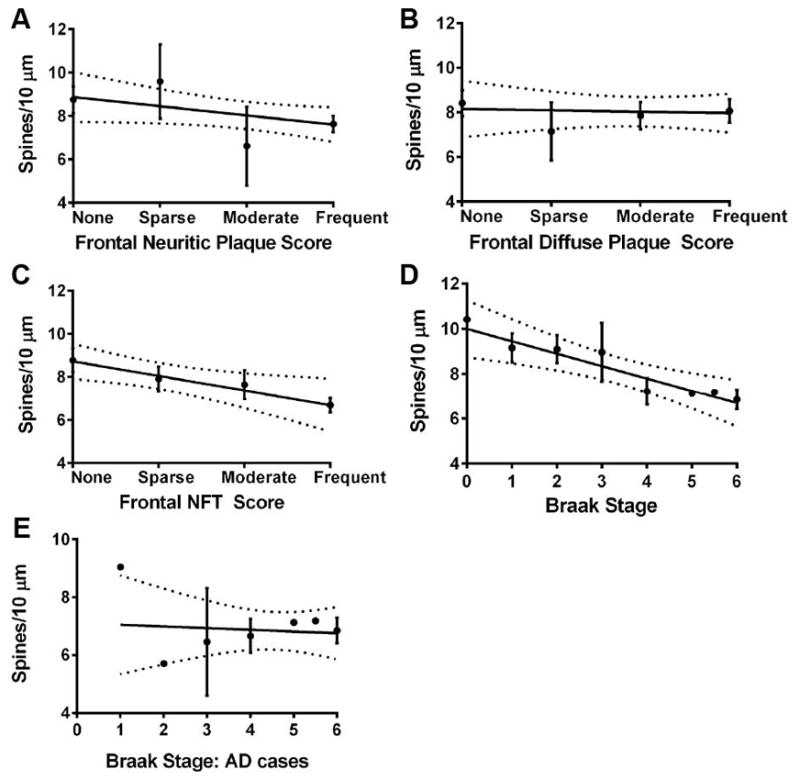
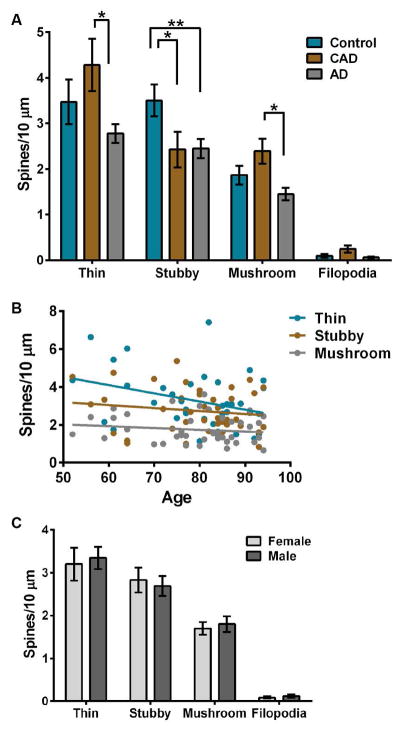
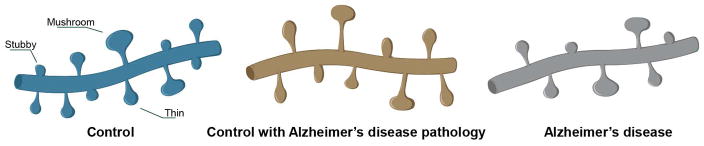
Results: Spine density was similar among control and CAD cases but was reduced significantly in AD. Thin and mushroom spines were reduced significantly in AD compared to CAD brains, whereas stubby spine density was decreased significantly in CAD and AD compared to controls. Increased spine extent distinguished CAD cases from controls and AD. Linear regression analysis of all cases indicated that spine density was not associated with neuritic plaque score but did display negative correlation with Braak staging.

Interpretation: These observations provide cellular evidence to support the hypothesis that dendritic spine plasticity is a mechanism of cognitive resilience that protects older individuals with AD pathology from developing dementia. Ann Neurol 2017;82:602-614.


Conflict of interest statement

Potential Conflicts of Interests

Nothing to report.

Figures

FIGURE 1
FIGURE 1
Highly optimized three-dimensional modeling of dendritic spines in controls, CAD, and AD cases. (A, C, E) Representative brightfield images of Golgi-impregnated dendrites. Scale bars represent 5 μm. (B, D, F) Three-dimensional digital reconstructions of the same dendrites generated in Neurolucida360. (G) (Left to Right) Representative zoomed-in brightfield image of a single Golgi-impregnated spine in the XY plane. Three-dimensional digital reconstruction of the spine in the XY plane with a grey line representing the head diameter measurement. Clockwise rotation in XYZ dimensions with a grey line representing the spine extent measurement. Further rotation in XYZ with grey lines representing spine head diameter and extent.
FIGURE 2
FIGURE 2
Comparison of dendritic spin density in controls, CAD, and AD cases. (A) Mean spine density per 10 μm was reduced significantly in AD compared to controls and CAD (One-way ANOVA: F2,38=10.31, P=0.0003; Tukey: controls P=0.0032, CAD P=0.0013). Each case is expressed as an individual data point, and each data point is an average of 10–20 dendrites. (B) Distribution of spine density measured per 10 μm of dendrite. Each dot represents the average spine density per 10 μm for each dendrite that was imaged. (C) Aggregate distribution of spine density measured by surface area of dendrite in control, CAD, and AD cases. Each dot represents the average spine density per surface area of dendrite for each individual case. Spine density measured per dendrite surface area is reduced in AD cases compared to controls (One-way ANOVA: P=0.0398, F2,38 = 3.515; Tukey: controls P=0.0725). Lines represent the mean ± SEM. (D) Distribution of spine density measured per surface area of dendrite in control, CAD, and AD cases. Each dot represents the average spine density per surface area of dendrite for each individual dendrite that was imaged. Case numbers refer to patients that are described in Table 1. (E) Mean age was similar among controls, CAD, and AD. (F) Average spine density per 10 μm of dendrite for each individual was graphed based on disease state and sex. (G) Linear regression analysis of spine density measured per 10 μm of dendrite across all cases with postmortem interval (PMI). Each dot represents the average spine density per 10 μm for each individual case. The density of spines per 10 μm of dendrite was plotted against the PMI for each individual. PMI represented in hours. (H) Linear regression analysis of spine density measured per 10 μm of dendrite in control, CAD, and AD cases with age. Each dot represents the average spine density per 10 μm for each individual case. The density of spines per 10 μm of dendrite was plotted against the age of each individual. Age represented in years. (I) Linear regression analysis of spine density measured per 10 μm of dendrite in all cases with age. Each dot represents the average spine density per 10 μm for each individual case. The density of spines per 10 μm of dendrite was plotted against the age of each individual. Age was inversely proportional to spine density (F1,39 =6.570, R2 = 0.1442, P=0.0143). Dashed lines represent 95% confidence intervals.
FIGURE 3
FIGURE 3
Linear regression analysis of spine density and AD pathology. (A) Spine density does not correlate with neuritic plaque score. (B) Spine density does not correlate with diffuse plaque score. (C) There is negative correlation of spine density with NFT score (F1,39=6.495, R2=0.1428, P=0.0149). (D) There is negative correlation of spine density with Braak staging (F1,37=11.63, R2=0.2392, P=0.0016). (E) Spine density does not correlate with Braak staging among AD cases. Dashed lines represent 95% confidence intervals. NFT, neurofibrillary tangle.
FIGURE 4
FIGURE 4
Comparison of dendritic spine morphology classes in controls, CAD, and AD cases. (A) Mean number of thin, stubby, or mushroom spines and filopodia per 10 μm. Thin spines are reduced significantly in AD cases compared to CAD (Two-way ANOVA: P=0.0003; Tukey: CAD P=0.0004). Stubby spines are reduced in CAD and AD cases compared to controls (Tukey: CAD P=0.031, AD P=0.0054). (B) Linear regression analysis of spine classification densities measured per 10 μm of dendrite in all cases with age. Each dot represents the average spine class density per 10 μm for each individual case. The density of spine class per 10 μm of dendrite was plotted against the age of each individual. Age represented in years. (C) Average spine class density per 10 μm of dendrite for each individual was graphed based on sex. Lines represent the mean ± SEM.
FIGURE 5
FIGURE 5
Comparison of dendritic spine extent in controls, CAD, and AD cases. (A) Mean spine extent was increased significantly in CAD compared to controls or AD (ANOVA: P<0.0001; Tukey: controls P<0.0001, AD P<0.0001). (B) The cumulative frequency plots of individual spines indicate that CAD segregates based on spine extent (Kolmogorov-Smirnov: controls D=0.1221, P<0.0001; AD D=1455, P<0.0001). (C) Distribution of spine extent in control, CAD, and AD cases. Each dot represents the average spine extent per individual dendrite that was imaged. (D) Linear regression analysis of spine extent measured across all cases with age. Each dot represents the average spine extent for each individual case. The average spine extent was plotted against the age of each individual. Age represented in years. (E) Average spine extent per individual was graphed based on sex. (F) Mean extent for thin spines was reduced in AD cases compared to CAD (ANOVA: P=0.0486; Tukey: AD P=0.0748). (G) The cumulative distribution of thin spine extent for each disease state was plotted. (H) Mean extent for stubby spines was increased significantly in CAD compared to controls or AD (ANOVA: P<0.0001; Tukey: controls-CAD P=0.0204, controls-AD P<0.0001, CAD-AD P<0.0001). (I) The cumulative distribution of stubby spine extent for each disease state was plotted. The cumulative frequency plots indicated that AD cases segregate from controls and CAD based on stubby spine extent (Kolmogorov-Smirnov: controls D=0.1502, P<0.0001; CAD D=0.2190, P<0.0001). (J) A trending increase in mean extent for mushroom spines was observed in CAD cases compared to controls and AD (ANOVA: P=0.1105; Tukey: AD P=0.0914). (K) The cumulative distribution of mushroom spine extent for each disease state was plotted. The cumulative frequency plots indicated that CAD cases segregate from AD based on mushroom spine extent (Kolmogorov-Smirnov: AD D=0.1165, P=0.0410). Lines represent the mean ± SEM.
FIGURE 6
FIGURE 6
Comparison of dendritic spine head diameter in controls, CAD, and AD cases. (A) Mean spine head diameter was reduced significantly in AD compared to controls (ANOVA: P=0.0032; Tukey: AD P=0.0032), while CAD was reduced compared to controls (ANOVA: CAD P=0.0611). (B) The cumulative frequency plots of individual spines indicates that each group segregates based on spine head diameter (Kolmogorov-Smirnov: controls-CAD D=0.09061, P=0.0002; controls-AD D=0.06866, P=0.0005; CAD-AD D=0.06968, P=0.0070). (C) Distribution of spine head diameter in control, CAD, and AD cases. Each dot represents the average spine head diameter per individual dendrite that was imaged. (D) Linear regression analysis of spine head diameter measured across all cases with age. Each dot represents the average spine head diameter for each individual case. The average spine head diameter was plotted against the age of each individual. Age represented in years. (E) Average spine head diameter per individual was graphed based on sex. (F) Mean head diameter for thin spines was reduced in CAD cases compared to controls and AD (ANOVA: P=0.0036; Tukey: controls P=0.057, AD P=0.0024). (G) The cumulative distribution of thin spine head diameters for each disease state was plotted. The cumulative frequency plots indicated that CAD cases segregate from AD based on thin spine head diameter Kolmogorov-Smirnov: AD D=0.1034, P=0.0101). (H) Mean head diameter was reduced significantly for stubby spines in AD compared to CAD and controls (ANOVA: P<0.0001; Tukey: CAD P=0.0015, controls P=0.0003). (I) The cumulative distribution of stubby spine head diameters for each disease state was plotted. The cumulative frequency plots indicated that AD cases segregate from controls and CAD based on stubby spine head diameter (Kolmogorov-Smirnov: controls D=0.1421, P<0.0001; CAD D=0.1512, P=0.0010). (J) Mean head diameter for mushroom spines was similar among control, CAD, and AD cases. (K) The cumulative distribution of mushroom spine head diameters for each disease state was plotted. The cumulative frequency plots indicated overlap among controls, CAD, and AD cases based on mushroom spine head diameter. Lines represent the mean ± SEM.
FIGURE 7
FIGURE 7
Representative illustration of dendrites from control, CAD, and AD cases (not to scale).

References

    1. Sperling RA, Aisen PS, Beckett LA, et al. Toward defining the preclinical stages of Alzheimer’s disease: recommendations from the National Institute on Aging-Alzheimer’s Association workgroups on diagnostic guidelines for Alzheimer’s disease. Alzheimers Dement. 2011;7:280–292. - PMC - PubMed
    1. Driscoll I, Troncoso J. Asymptomatic Alzheimer’s disease: a prodrome or a state of resilience? Curr Alzheimer Res. 2011;8:330–335. - PMC - PubMed
    1. Bennett DA, Schneider JA, Arvanitakis Z, et al. Neuropathology of older persons without cognitive impairment from two community-based studies. Neurology. 2006;66:1837–1844. - PubMed
    1. Head E, Corrada MM, Kahle-Wrobleski K, et al. Synaptic proteins, neuropathology and cognitive status in the oldest-old. Neurobiology of aging. 2009;30:1125–1134. - PMC - PubMed
    1. O’Brien RJ, Resnick SM, Zonderman AB, et al. Neuropathologic studies of the Baltimore Longitudinal Study of Aging (BLSA) J Alzheimers Dis. 2009;18:665–675. - PMC - PubMed

MeSH terms