

Metabolic assessment of a migraine model using relaxation-enhanced 1 H spectroscopy at ultrahigh field
- PMID: 28921630
- PMCID: PMC5775911
- DOI: 10.1002/mrm.26811
Metabolic assessment of a migraine model using relaxation-enhanced 1 H spectroscopy at ultrahigh field
Abstract
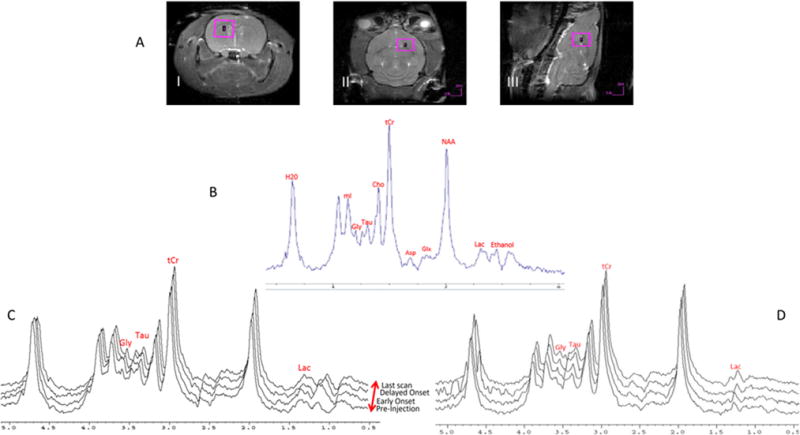
Purpose: This study evaluates biochemical imbalances in a rat model that reflects dysfunctional pathways in migraine. The high sensitivity and spectral dispersion available to 1 H MRS at 21.1 T expands metabolic profiling in this migraine model to include lactate (Lac), taurine (Tau), aspartate, and Gly-a mixture of glycine, glutamine, and glutamate.
Methods: Sprague-Dawley male rats were administered in situ an intraperitoneal injection of nitroglycerin (NTG) to induce the migraine analogue or saline as a control. A selective relaxation-enhanced MR spectroscopy sequence was used to target upfield metabolites from a 4-mm3 voxel for 2.5 h after injection.
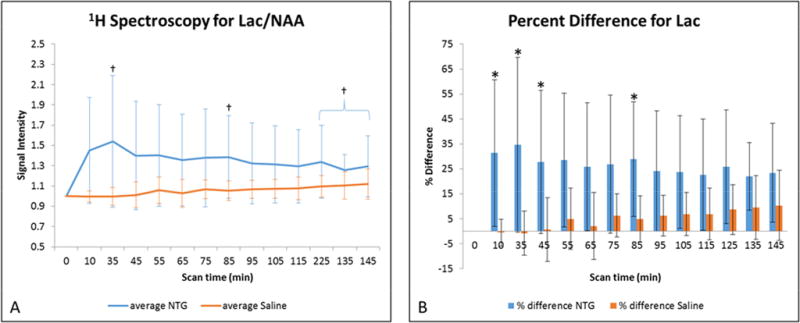
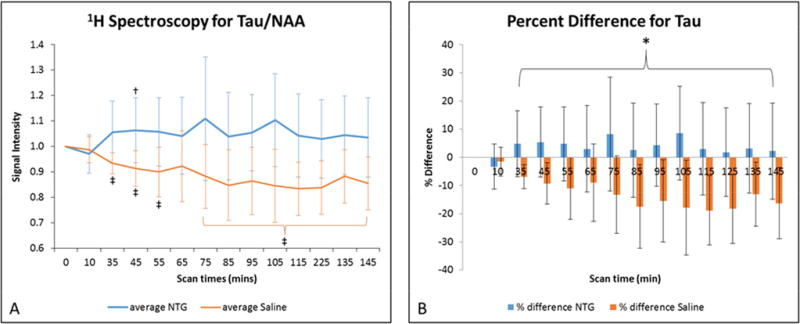
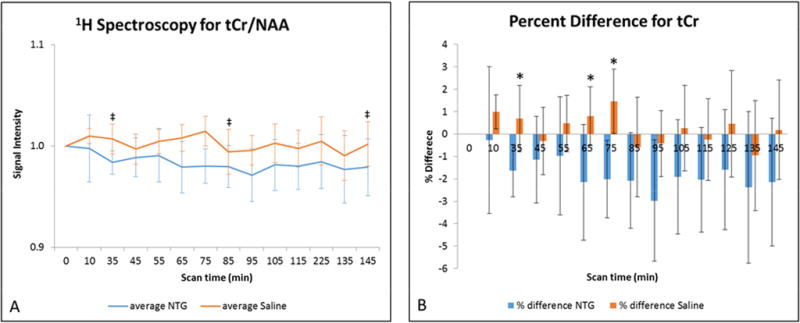
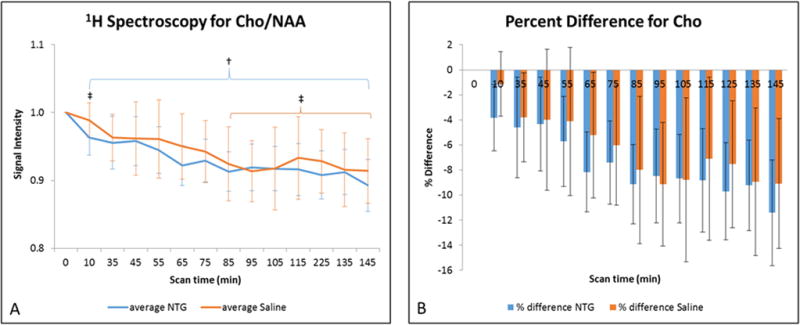
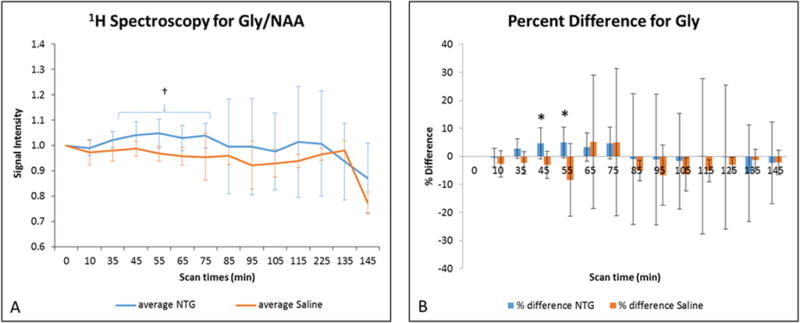
Results: Significant increases were evident for Lac as early as 10 min after NTG injection, peaking over 50% compared with baseline and control (normalized Lac/N-acetyl aspartate with NTG = 1.54 ± 0.65 versus with saline = 0.99 ± 0.08). Tau decreased progressively in controls over 2 h after injection, but remained elevated with NTG, peaking at 105 min after injection (normalized Tau/N-acetyl aspartate with NTG = 1.10 ± 0.18 versus with saline = 0.85 ± 0.14). Total creatine under NTG showed significant decreases with time and compared with saline; Gly demonstrated temporal increases for NTG.
Conclusions: These changes indicate an altered metabolic profile in the migraine analogue consistent with early changes in neural activity and/or vasodilation consistent with progressively enhanced neuroprotection and osmoregulation. Magn Reson Med 79:1266-1275, 2018. © 2017 International Society for Magnetic Resonance in Medicine.
Keywords: 1H MR spectroscopy; high magnetic field; lactate; migraine; nitroglycerin; taurine.
© 2017 International Society for Magnetic Resonance in Medicine.
Conflict of interest statement
None
Figures
Similar articles
-
Dynamic sodium imaging at ultra-high field reveals progression in a preclinical migraine model.Pain. 2018 Oct;159(10):2058-2065. doi: 10.1097/j.pain.0000000000001307. Pain. 2018. PMID: 29905652 Free PMC article.
-
1H-MRS reveals abnormal energy metabolism and excitatory-inhibitory imbalance in a chronic migraine-like state induced by nitroglycerin in mice.J Headache Pain. 2024 Sep 30;25(1):163. doi: 10.1186/s10194-024-01872-6. J Headache Pain. 2024. PMID: 39350002 Free PMC article.
-
Metabolomic profiling integrated with molecular exploring delineates the action of Ligusticum chuanxiong hort. on migraine.Phytomedicine. 2024 Nov;134:155977. doi: 10.1016/j.phymed.2024.155977. Epub 2024 Aug 22. Phytomedicine. 2024. PMID: 39208659
-
Correlation between lactate and neuronal cell damage in the rat brain after focal ischemia: An in vivo 1H magnetic resonance spectroscopic (1H-MRS) study.Acta Radiol. 2010 Apr;51(3):344-50. doi: 10.3109/02841850903515395. Acta Radiol. 2010. PMID: 20144147
-
Magnetic resonance spectroscopy in migraine: what have we learned so far?Cephalalgia. 2012 Aug;32(11):845-59. doi: 10.1177/0333102412452048. Epub 2012 Jul 4. Cephalalgia. 2012. PMID: 22763498 Review.
Cited by
-
Fluorine-19 MRI at 21.1 T: enhanced spin-lattice relaxation of perfluoro-15-crown-5-ether and sensitivity as demonstrated in ex vivo murine neuroinflammation.MAGMA. 2019 Feb;32(1):37-49. doi: 10.1007/s10334-018-0710-z. Epub 2018 Nov 12. MAGMA. 2019. PMID: 30421250 Free PMC article.
-
Regulation of CSF and Brain Tissue Sodium Levels by the Blood-CSF and Blood-Brain Barriers During Migraine.Front Comput Neurosci. 2020 Feb 4;14:4. doi: 10.3389/fncom.2020.00004. eCollection 2020. Front Comput Neurosci. 2020. PMID: 32116618 Free PMC article.
-
Energy metabolism disorders in migraine: triggers, pathways, and therapeutic repurposing.Front Neurol. 2025 Apr 2;16:1561000. doi: 10.3389/fneur.2025.1561000. eCollection 2025. Front Neurol. 2025. PMID: 40242623 Free PMC article. Review.
-
Neurochemical metabolite alterations of the occipital lobe in migraine without aura by proton magnetic resonance spectroscopy.Neuroradiol J. 2020 Oct;33(5):410-415. doi: 10.1177/1971400920932793. Epub 2020 Jun 23. Neuroradiol J. 2020. PMID: 32573358 Free PMC article.
-
Nonparametric 5D D-R2 distribution imaging with single-shot EPI at 21.1 T: Initial results for in vivo rat brain.J Magn Reson. 2022 Aug;341:107256. doi: 10.1016/j.jmr.2022.107256. Epub 2022 Jun 15. J Magn Reson. 2022. PMID: 35753184 Free PMC article.
References
-
- Parsons A, Strijbos P. The neuronal versus vascular hypothesis of migraine and cortical spreading depression. Curr Opin Pharmacol. 2003 Feb;3(1):73–7. - PubMed
-
- Harrington MG, Yang X, Cowan RP, Fonteh AN. Extracellular sodium increases neuron excitability in migraine. Neurology. 2009 Mar 17;72(11):A175–-.
-
- Harrington M, Fonteh A, Cowan R, Perrine K, Pogoda J, Biringer R, Huhmer A. Cerebrospinal fluid sodium increases in migraine. Headache. 2006 Jul-Aug;46(7):1128–35. - PubMed
Publication types
MeSH terms
Substances
Grants and funding
LinkOut - more resources
Full Text Sources
Other Literature Sources
Medical
