. 2018 Jan;27(1):217-228.
doi: 10.1002/pro.3302. Epub 2017 Nov 6.

Estimate your dose: RADDOSE-3D

Affiliations

Estimate your dose: RADDOSE-3D

Charles S Bury et al. Protein Sci. 2018 Jan.

Abstract

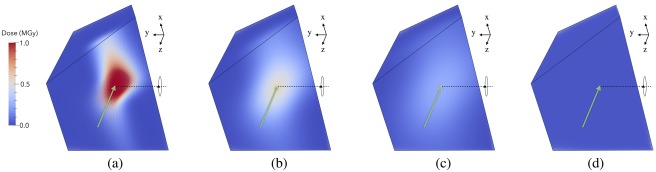
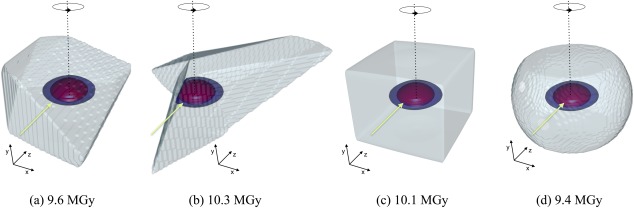
We present the current status of RADDOSE-3D, a software tool allowing the estimation of the dose absorbed in a macromolecular crystallography diffraction experiment. The code allows a temporal and spatial dose contour map to be calculated for a crystal of any geometry and size as it is rotated in an X-ray beam, and gives several summary dose values: among them diffraction weighted dose. This allows experimenters to plan data collections which will minimize radiation damage effects by spreading the absorbed dose more homogeneously, and thus to optimize the use of their crystals. It also allows quantitative comparisons between different radiation damage studies, giving a universal "x-axis" against which to plot various metrics.

Keywords: absorption coefficients; beam profile; diffraction weighted dose; dose; radiation damage.


Figures

Figure 1
Figure 1
Interaction processes of incident X‐ray photons with atoms in the crystal. The photon cross‐sections for each interaction (in units of barn/atom: 1 barn = 10−28 m2) have been provided for C, S, and Se, for an incident 12.4 keV (1 Å) X‐ray beam, as reported in the XCOM Photon Cross Section Database (http://physics.nist.gov/PhysRefData/Xcom/html/xcom1.html).
Figure 2
Figure 2
Flow chart outlining the structure of RADDOSE‐3D.
Figure 3
Figure 3
The structure of a typical RADDOSE‐3D input file. The crystal geometry and composition is first described by a “Crystal” block (in orange). The three‐dimensional geometry of the crystal has been approximated as a polyhedron (as a collection of vertices and faces) and this information has been supplied to RADDOSE‐3D using the “ModelFile” flag. A “Beam” block (in blue) followed by a “Wedge” block (in green) describe the strategy by which the specified beam will interact with the crystal. Multiple beam and wedge parameters can be implemented in the same RADDOSE‐3D input file; and each exposure strategy will be run sequentially by the program. Whereas in the first beam block the beam profile will be approximated as a 2D Gaussian with FWHMs of 20 µm × 20 µm, in the second beam block, the beam profile has been extracted directly from the beamline and supplied to RADDOSE‐3D as an experimentalBeamProfile.pgm.
Figure 4
Figure 4
Effect of the dose distribution on the chosen exposure strategy modelled in RADDOSE‐3D. Dose contouring levels have been shown at 0.0001 MGy (grey), 5 MGy (green), 10 MGy (light blue), 20 MGy (dark blue) and 30 MGy (red), using R (www.r-project.org). In each simulation, the crystal rotation axis (in black) and incident beam direction (in yellow, coincident with the z axis) are shown. Unless otherwise stated, each dose distribution is generated following a 360° rotation over a total exposure time of 100 s. In (a) the crystal rotation axis and incident beam direction intersect. In (b) the crystal undergoes a series of eight 360° rotations, each lasting 100/8 = 12.5 s, intersected by a series of 20 µm translations of the crystal parallel to the rotation axis to spread the dose across the crystal volume. In (c) the crystal rotation axis and incident beam direction intersect, however the crystal is continuously translated along the rotation axis at a rate of 0.2 µm/°. In (b) the crystal rotation axis has been offset by 30 µm relative to the incident beam direction. In (e) the rotation axis is offset by 30 µm relative to the beam direction, and the crystal is also continuously translated along the rotation axis at 0.2 µm/°. In all simulations a cuboid crystal has been modelled with dimensions x = 100 µm, y = 200 µm and z = 100 µm. The beam has been modelled as Gaussian shaped (FWHM: 20 µm × 20 µm), with energy 12.4 keV, flux 5 × 10¹¹ ph/s, and a large 1 mm × 1 mm rectangular collimation in order to ensure the full crystal is continuously bathed in the beam for each simulation.
Figure 5
Figure 5
The effect of varying the incident beam profile on the dose distribution for an irregular polyhedron shaped crystal formed by distorting a cube of dimension (100 µm)3 leaving the total volume the same at 106 µm3. In (a)–(c) the beam has been modelled as Gaussian shaped, and the FWHM has been varied as: (a) 20 µm × 20 µm, (b) 40 µm × 40 µm and (c) 60 µm × 60 µm. In (d) a uniform “top‐hat” shaped beam distribution has been modelled. All other beam parameters have been kept constant (energy: 12.4 keV, flux 5 × 10¹¹ ph/s, rectangular collimation: 200 µm × 200 µm). In all simulations the crystal has been exposed for 100 s throughout a 360° rotation about the y‐axis (shown in each plot). The direction of the incident beam with respect to the initial orientation of the crystal has been shown (green arrow). The crystal morphology has been specified with the “Type Polyhedron” flag in the RADDOSE‐3D input file. Visualization has been produced using the open source Paraview software package (https://www.paraview.org).
Figure 6
Figure 6
Diagram of a basic SAXS experiment. An X‐ray beam (typical energies range between 7 and 12.5 keV) is incident on a protein SAXS sample. Commonly the sample volume exposed to the beam is between 15 and 30 μL, with a protein concentration that usually ranges from 0.5 to 10 mg mL−1. The scattered radiation is collected on a detector. The symbol, q in the figure, is termed the momentum transfer and is defined as q=4πsinθ/λ where θ is half the scattering angle, and λ is the wavelength of the incident X‐ray beam. The detector images that are generated from the experiment can be processed and analysed to determine the overall shape and size of the protein molecule in the SAXS sample.
Figure 7
Figure 7
The effect of Compton scattering on the calculated DWD (MGy) values for a 100 µm × 100 µm × 100 µm cuboid crystal in RADDOSE‐3D with varying incident photon energy, Ex (keV). In all simulations, the beam has been modelled as Gaussian shaped with energy: 12.4 keV, flux: 5 × 10¹¹ ph/s, FWHM: 20 µm × 20 µm and with a rectangular collimation size of 100 µm × 100 µm. In all simulations the crystal has been exposed for 100 s over a 360° rotation. Note the y‐axis logarithmic scale.
Figure 8
Figure 8
The effect of accounting for photoelectron escape in RADDOSE‐3D on the calculated DWD (MGy) values for various sized cubic shaped crystals. In all simulations, the beam has been modelled as Gaussian shaped with energy: 12.4 keV, flux: 5 × 10¹¹ ph/s, FWHM: 20 µm × 20 µm and with a rectangular collimation size of 100 µm × 100 µm, and the crystal has been exposed for 100 s over 360°. The PixelsPerMicron parameter in RADDOSE‐3D has been varied for the x‐dimension of each crystal (between 0.5 and 10 pixels/µm) to account for the diminishing size of the crystal.
Figure 9
Figure 9
The effect of modelled crystal geometry on the calculated DWD (MGy) values has been illustrated for four crystal shapes, each with a total volume of 106 µm3. Dose isosurfaces are contoured at 0.001 MGy (light blue), 20 MGy (dark blue) and 30 MGy (red), using R (www.r-project.org). In (a) and (b), two irregular polyhedron‐shaped crystals were generated using the open‐source three‐dimensional graphics software called Blender. In (c) and (d) the “Type cuboid” and “Type spherical” input file parameters to RADDOSE‐3D have been used to model the crystal as a 100 µm × 100 µm × 100 µm cuboid, and a 124.2 µm diameter sphere, respectively. In all simulations, a Gaussian beam (12.4 keV, 1e11 ph/s) was modelled with FWHM of 20 µm × 20 µm, in order to obtain the infamous “fried egg” effect.

References

    1. Blake CCF, Phillips DC (1962) Effects of X‐irradiaton on single crystals of myoglobin. Proceedings of the Symposium on the Biological Effects of Ionising radiation at the Molecular Level. International Atomic Energy Agency, Vienna, pp. 183–191.
    1. Teng T, Moffat K (2000) Primary radiation damage of protein crystals by intense synchrotron radiation. J Synchr Radiat 7:313–317. - PubMed
    1. Kmetko J, Husseini NS, Naides M, Kalinin Y, Thorne RE (2006) Quantifying X‐ray radiation damage in protein crystals at cryogenic temperatures. Acta Cryst D62:1030–1038. - PubMed
    1. Diederichs K (2006) Some aspects of quantitative analysis and correction of radiation damage. Acta Cryst D62:96–101. - PubMed
    1. De la Mora E, Carmichael I, Garman EF (2011) Effective scavenging at cryotemperatures: Further increasing the dose tolerance of protein crystals. J Synchr Radiat 18:346–357. - PubMed

Publication types

LinkOut - more resources