

What Can Be Learned from Nuclear Resonance Vibrational Spectroscopy: Vibrational Dynamics and Hemes
- PMID: 28921972
- PMCID: PMC5639469
- DOI: 10.1021/acs.chemrev.7b00295
What Can Be Learned from Nuclear Resonance Vibrational Spectroscopy: Vibrational Dynamics and Hemes
Abstract
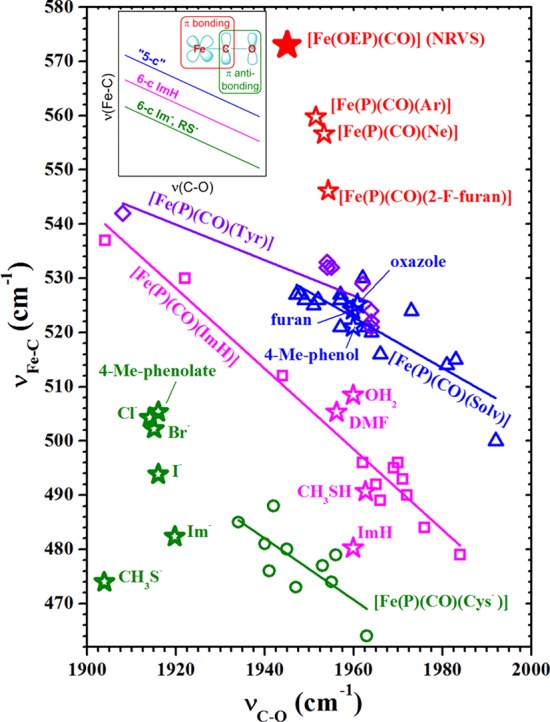
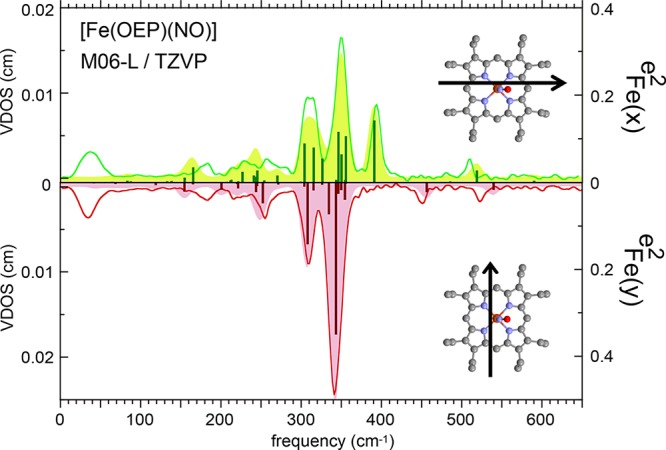
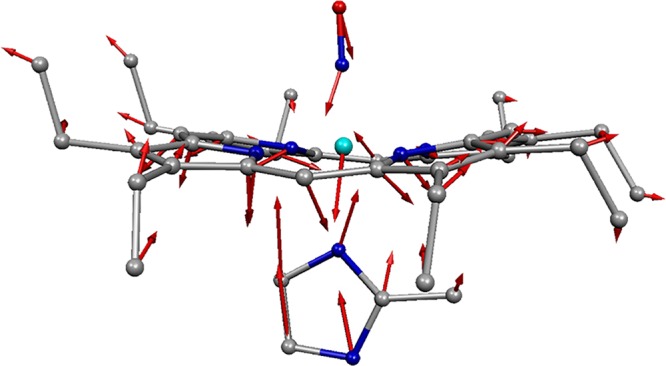
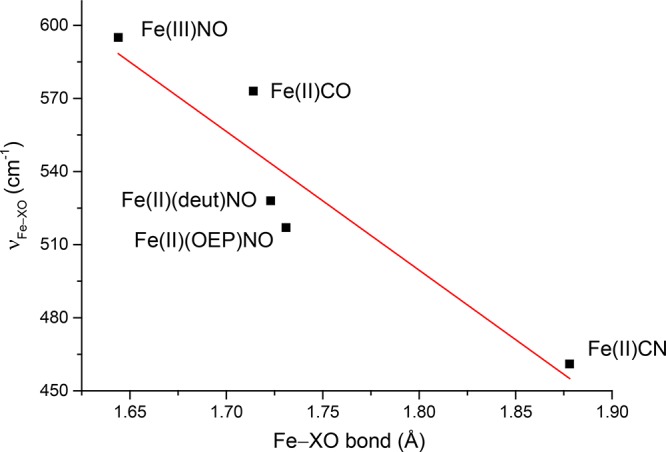
Nuclear resonance vibrational spectroscopy (NRVS; also known as nuclear inelastic scattering, NIS) is a synchrotron-based method that reveals the full spectrum of vibrational dynamics for Mössbauer nuclei. Another major advantage, in addition to its completeness (no arbitrary optical selection rules), is the unique selectivity of NRVS. The basics of this recently developed technique are first introduced with descriptions of the experimental requirements and data analysis including the details of mode assignments. We discuss the use of NRVS to probe 57Fe at the center of heme and heme protein derivatives yielding the vibrational density of states for the iron. The application to derivatives with diatomic ligands (O2, NO, CO, CN-) shows the strong capabilities of identifying mode character. The availability of the complete vibrational spectrum of iron allows the identification of modes not available by other techniques. This permits the correlation of frequency with other physical properties. A significant example is the correlation we find between the Fe-Im stretch in six-coordinate Fe(XO) hemes and the trans Fe-N(Im) bond distance, not possible previously. NRVS also provides uniquely quantitative insight into the dynamics of the iron. For example, it provides a model-independent means of characterizing the strength of iron coordination. Prediction of the temperature-dependent mean-squared displacement from NRVS measurements yields a vibrational "baseline" for Fe dynamics that can be compared with results from techniques that probe longer time scales to yield quantitative insights into additional dynamical processes.
Conflict of interest statement
The authors declare no competing financial interest.
Figures


Similar articles
-
Nuclear resonance vibrational spectroscopy--NRVS.J Inorg Biochem. 2005 Jan;99(1):60-71. doi: 10.1016/j.jinorgbio.2004.11.004. J Inorg Biochem. 2005. PMID: 15598492 Review.
-
Comprehensive Fe-ligand vibration identification in {FeNO}6 hemes.J Am Chem Soc. 2014 Dec 31;136(52):18100-10. doi: 10.1021/ja5105766. Epub 2014 Dec 18. J Am Chem Soc. 2014. PMID: 25490350 Free PMC article.
-
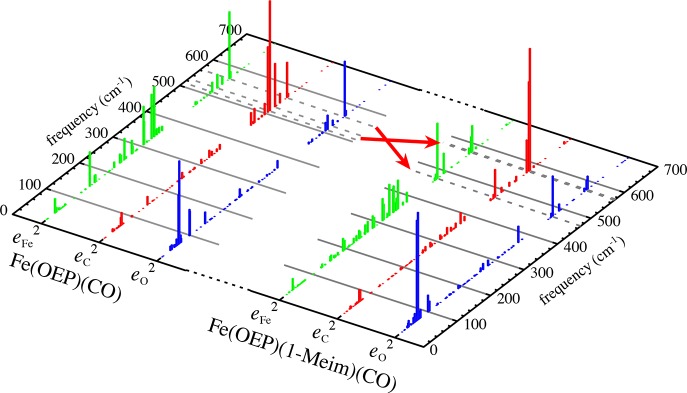
Axial ligand effects on vibrational dynamics of iron in heme carbonyl studied by nuclear resonance vibrational spectroscopy.J Phys Chem B. 2012 Nov 29;116(47):13831-8. doi: 10.1021/jp304398g. Epub 2012 Nov 14. J Phys Chem B. 2012. PMID: 23072485
-
Oriented single-crystal nuclear resonance vibrational spectroscopy of [Fe(TPP)(MI)(NO)]: quantitative assessment of the trans effect of NO.Inorg Chem. 2010 Aug 2;49(15):7197-215. doi: 10.1021/ic1010677. Inorg Chem. 2010. PMID: 20586416 Free PMC article.
-
Electronic structure of heme-nitrosyls and its significance for nitric oxide reactivity, sensing, transport, and toxicity in biological systems.Inorg Chem. 2010 Jul 19;49(14):6293-316. doi: 10.1021/ic902304a. Inorg Chem. 2010. PMID: 20666388 Review.
Cited by
-
High-Frequency Fe-H and Fe-H2 Modes in a trans-Fe(η2-H2)(H) Complex: A Speed Record for Nuclear Resonance Vibrational Spectroscopy.Inorg Chem. 2021 Jan 18;60(2):555-559. doi: 10.1021/acs.inorgchem.0c03006. Epub 2020 Dec 23. Inorg Chem. 2021. PMID: 33356182 Free PMC article.
-
NRVS investigation of ascorbate peroxidase compound II: Observation of Iron(IV)oxo stretching.J Inorg Biochem. 2021 Nov;224:111548. doi: 10.1016/j.jinorgbio.2021.111548. Epub 2021 Jul 24. J Inorg Biochem. 2021. PMID: 34481347 Free PMC article.
-
FeN4 Environments upon Reduction: A Computational Analysis of Spin States, Spectroscopic Properties, and Active Species.JACS Au. 2024 Feb 22;4(3):940-950. doi: 10.1021/jacsau.3c00714. eCollection 2024 Mar 25. JACS Au. 2024. PMID: 38559729 Free PMC article.
-
Nuclear Resonance Vibrational Spectroscopy Definition of O2 Intermediates in an Extradiol Dioxygenase: Correlation to Crystallography and Reactivity.J Am Chem Soc. 2018 Dec 5;140(48):16495-16513. doi: 10.1021/jacs.8b06517. Epub 2018 Nov 26. J Am Chem Soc. 2018. PMID: 30418018 Free PMC article.
-
Nuclear Resonance Vibrational Spectroscopy: A Modern Tool to Pinpoint Site-Specific Cooperative Processes.Crystals (Basel). 2021 Aug;11(8):909. doi: 10.3390/cryst11080909. Epub 2021 Aug 2. Crystals (Basel). 2021. PMID: 35582460 Free PMC article.
References
-
- Keppler C.; Achterhold K.; Ostermann A.; van Bürck U.; Potzel W.; Chumakov A. I.; Baron A. Q.; Rüffer R.; Parak F. Determination of the Phonon Spectrum of Iron in Myoglobin Using Inelastic X-Ray Scattering of Synchrotron Radiation. Eur. Biophys. J. 1997, 25, 221–224. 10.1007/s002490050034. - DOI - PubMed
-
- Paulsen H.; Winkler H.; Trautwein A. X.; Grünsteudel H.; Rusanov V.; Toftlund H. Measurement and Simulation of Nuclear Inelastic-Scattering Spectra of Molecular Crystals. Phys. Rev. B: Condens. Matter Mater. Phys. 1999, 59, 975–984. 10.1103/PhysRevB.59.975. - DOI
-
- Leupold O.; Chumakov A. I.; Alp E. E.; Sturhahn W.; Baron A. Q. R. Noniron Isotopes. Hyperfine Interact. 1999, 123/124, 611–631. 10.1023/A:1017000713255. - DOI
Publication types
MeSH terms
Substances
Grants and funding
LinkOut - more resources
Full Text Sources
Other Literature Sources
Medical
