

Reconstructing promoter activity from Lux bioluminescent reporters
- PMID: 28922354
- PMCID: PMC5619816
- DOI: 10.1371/journal.pcbi.1005731
Reconstructing promoter activity from Lux bioluminescent reporters
Abstract
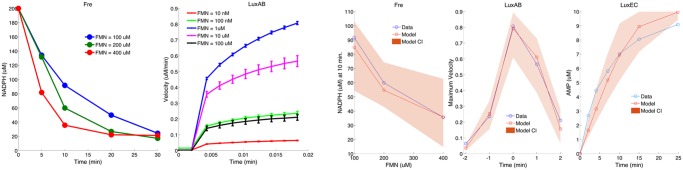
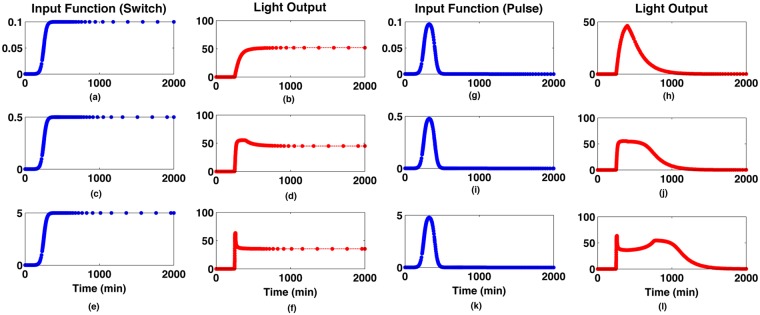
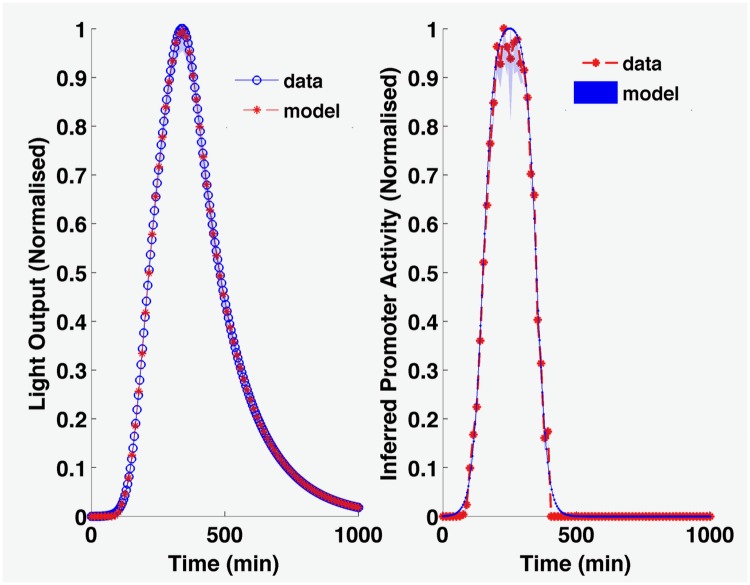
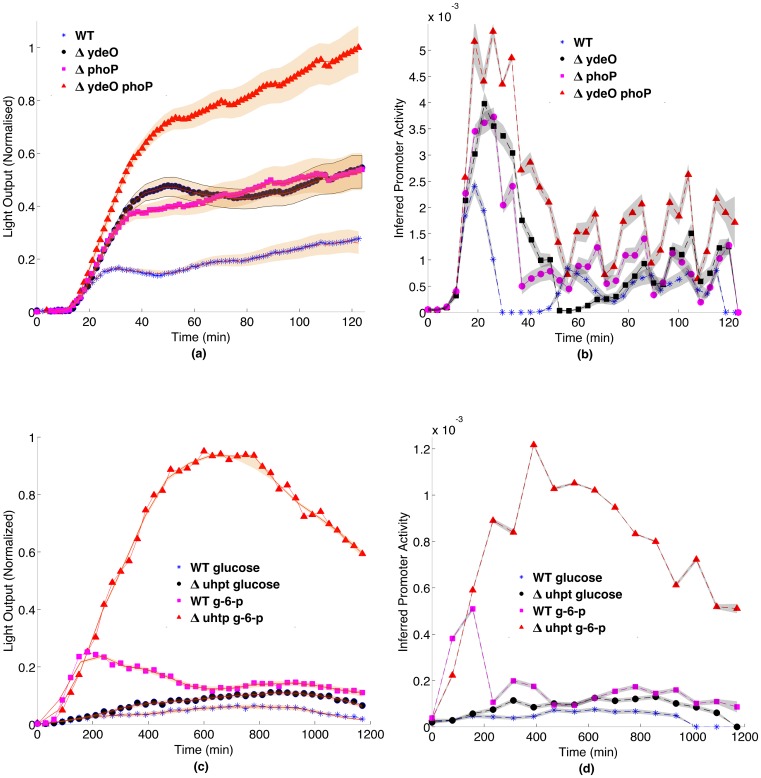
The bacterial Lux system is used as a gene expression reporter. It is fast, sensitive and non-destructive, enabling high frequency measurements. Originally developed for bacterial cells, it has also been adapted for eukaryotic cells, and can be used for whole cell biosensors, or in real time with live animals without the need for euthanasia. However, correct interpretation of bioluminescent data is limited: the bioluminescence is different from gene expression because of nonlinear molecular and enzyme dynamics of the Lux system. We have developed a computational approach that, for the first time, allows users of Lux assays to infer gene transcription levels from the light output. This approach is based upon a new mathematical model for Lux activity, that includes the actions of LuxAB, LuxEC and Fre, with improved mechanisms for all reactions, as well as synthesis and turn-over of Lux proteins. The model is calibrated with new experimental data for the LuxAB and Fre reactions from Photorhabdus luminescens-the source of modern Lux reporters-while literature data has been used for LuxEC. Importantly, the data show clear evidence for previously unreported product inhibition for the LuxAB reaction. Model simulations show that predicted bioluminescent profiles can be very different from changes in gene expression, with transient peaks of light output, very similar to light output seen in some experimental data sets. By incorporating the calibrated model into a Bayesian inference scheme, we can reverse engineer promoter activity from the bioluminescence. We show examples where a decrease in bioluminescence would be better interpreted as a switching off of the promoter, or where an increase in bioluminescence would be better interpreted as a longer period of gene expression. This approach could benefit all users of Lux technology.
Conflict of interest statement
The authors have declared that no competing interests exist.
Figures
Similar articles
-
Bioluminescent Reporters for Rapid Mechanism of Action Assessment in Tuberculosis Drug Discovery.Antimicrob Agents Chemother. 2016 Oct 21;60(11):6748-6757. doi: 10.1128/AAC.01178-16. Print 2016 Nov. Antimicrob Agents Chemother. 2016. PMID: 27572410 Free PMC article.
-
Highly bioluminescent Streptococcus thermophilus strain for the detection of diary-relevant antibiotics in milk.Appl Microbiol Biotechnol. 1995 Dec;44(3-4):405-12. doi: 10.1007/BF00169936. Appl Microbiol Biotechnol. 1995. PMID: 8597542
-
Expression of a humanized viral 2A-mediated lux operon efficiently generates autonomous bioluminescence in human cells.PLoS One. 2014 May 2;9(5):e96347. doi: 10.1371/journal.pone.0096347. eCollection 2014. PLoS One. 2014. PMID: 24788811 Free PMC article.
-
Building Biological Flashlights: Orthogonal Luciferases and Luciferins for in Vivo Imaging.Acc Chem Res. 2019 Nov 19;52(11):3039-3050. doi: 10.1021/acs.accounts.9b00391. Epub 2019 Oct 8. Acc Chem Res. 2019. PMID: 31593431 Free PMC article. Review.
-
Development and Applications of Bioluminescent and Chemiluminescent Reporters and Biosensors.Annu Rev Anal Chem (Palo Alto Calif). 2019 Jun 12;12(1):129-150. doi: 10.1146/annurev-anchem-061318-115027. Epub 2019 Feb 20. Annu Rev Anal Chem (Palo Alto Calif). 2019. PMID: 30786216 Free PMC article. Review.
Cited by
-
Methods for studying microbial acid stress responses: from molecules to populations.FEMS Microbiol Rev. 2024 Sep 18;48(5):fuae015. doi: 10.1093/femsre/fuae015. FEMS Microbiol Rev. 2024. PMID: 38760882 Free PMC article. Review.
-
Recent Developments of the Synthetic Biology Toolkit for Clostridium.Front Microbiol. 2018 Feb 12;9:154. doi: 10.3389/fmicb.2018.00154. eCollection 2018. Front Microbiol. 2018. PMID: 29483900 Free PMC article. Review.
-
Suppressor Mutants: History and Today's Applications.EcoSal Plus. 2021 Dec 15;9(2):eESP00372020. doi: 10.1128/ecosalplus.ESP-0037-2020. Epub 2021 Dec 15. EcoSal Plus. 2021. PMID: 34910591 Free PMC article. Review.
-
Expanding luciferase reporter systems for cell-free protein expression.Sci Rep. 2022 Jul 7;12(1):11489. doi: 10.1038/s41598-022-15624-6. Sci Rep. 2022. PMID: 35798760 Free PMC article.
-
Comparative Analysis of Cell Metabolic Activity Sensing by Escherichia coli rrnB P1-lux and Cd Responsive-Lux Biosensors: Time-Resolved Experiments and Mechanistic Modelling.Biosensors (Basel). 2022 Sep 16;12(9):763. doi: 10.3390/bios12090763. Biosensors (Basel). 2022. PMID: 36140148 Free PMC article.
References
-
- Dunlap P. Biochemistry and genetics of bacterial bioluminescence. Advances in Biochemical Engineering and Biotechnology. 2014;144:37–64. - PubMed
-
- Szittner R, Meighen E. Nucleotide sequence, expression, and properties of luciferase coded by lux genes from a terrestrial bacterium. The Journal of Biological Chemistry. 1990;265(27):16581–16587. - PubMed
MeSH terms
Substances
Grants and funding
LinkOut - more resources
Full Text Sources
Other Literature Sources
