. 2018 Jan 1;110(1):109-120.
doi: 10.1093/jnci/djx121.

Targeting the Myofibroblastic Cancer-Associated Fibroblast Phenotype Through Inhibition of NOX4

Affiliations

Targeting the Myofibroblastic Cancer-Associated Fibroblast Phenotype Through Inhibition of NOX4

Christopher J Hanley et al. J Natl Cancer Inst. .

Abstract

Background: Cancer-associated fibroblasts (CAFs) are tumor-promoting and correlate with poor survival in many cancers, which has led to their emergence as potential therapeutic targets. However, effective methods to manipulate these cells clinically have yet to be developed.

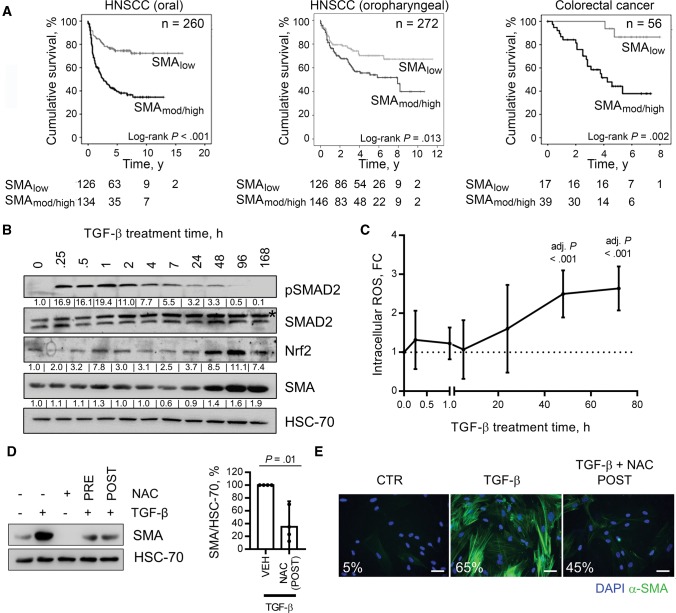
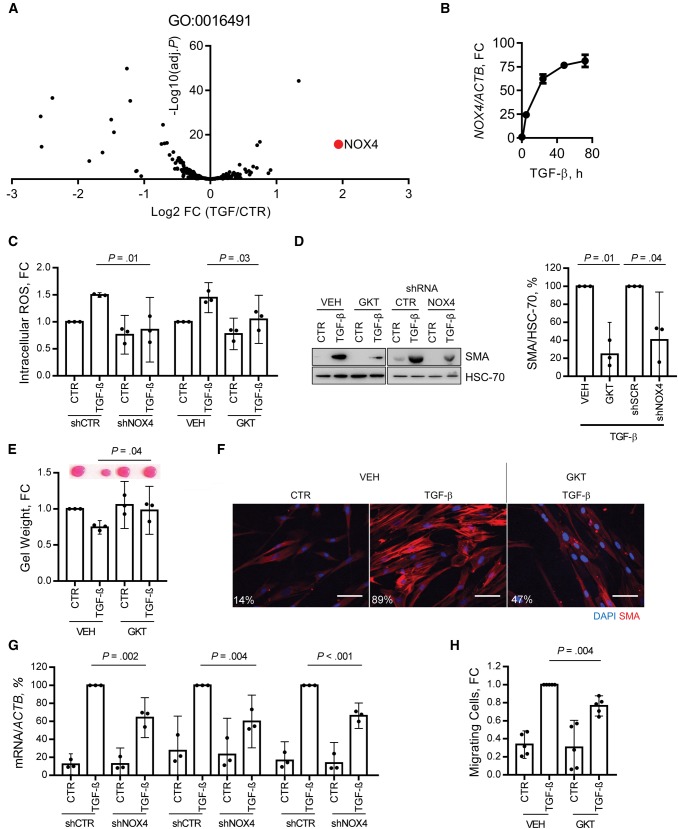
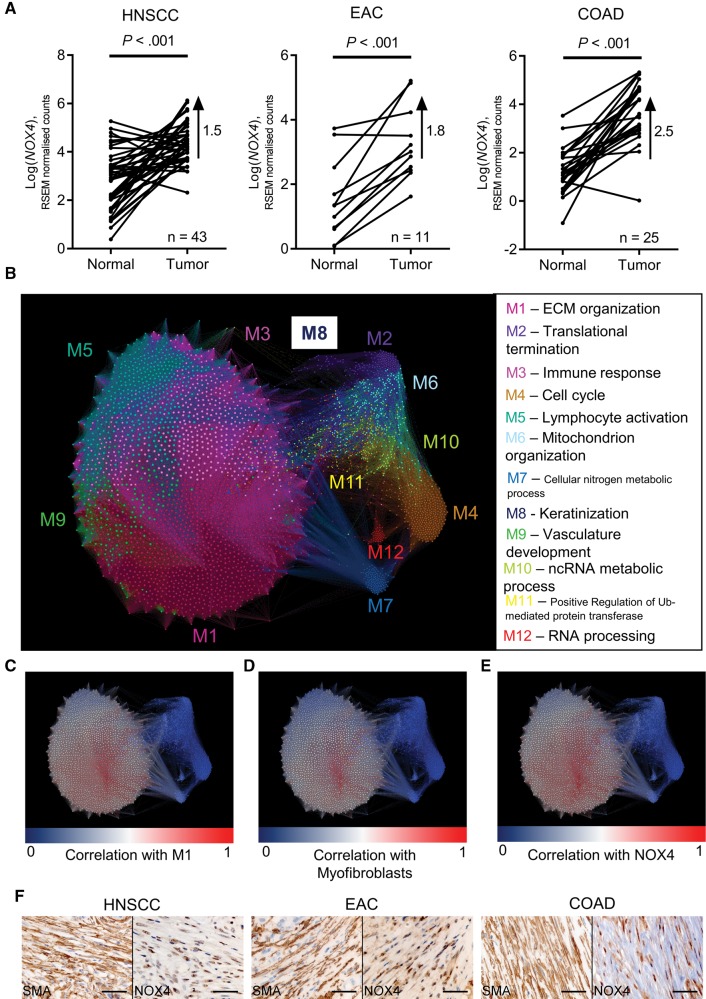
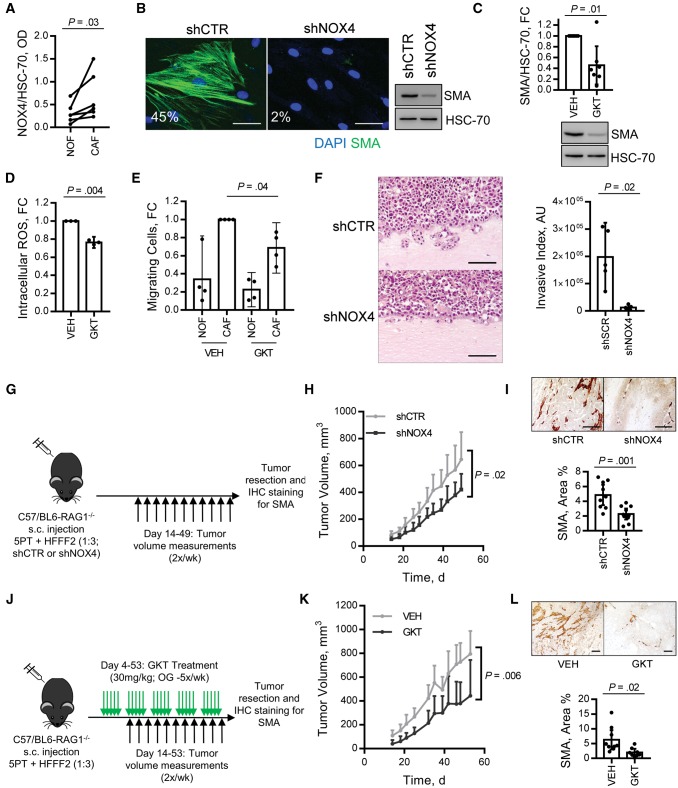
Methods: CAF accumulation and prognostic significance in head and neck cancer (oral, n = 260; oropharyngeal, n = 271), and colorectal cancer (n = 56) was analyzed using immunohistochemistry. Mechanisms regulating fibroblast-to-myofibroblast transdifferentiation were investigated in vitro using RNA interference/pharmacological inhibitors followed by polymerase chain reaction (PCR), immunoblotting, immunofluorescence, and functional assays. RNA sequencing/bioinformatics and immunohistochemistry were used to analyze NAD(P)H Oxidase-4 (NOX4) expression in different human tumors. NOX4's role in CAF-mediated tumor progression was assessed in vitro, using CAFs from multiple tissues in Transwell and organotypic culture assays, and in vivo, using xenograft (n = 9-15 per group) and isograft (n = 6 per group) tumor models. All statistical tests were two-sided.

Results: Patients with moderate/high levels of myofibroblastic-CAF had a statistically significant decrease in cancer-specific survival rates in each cancer type analyzed (hazard ratios [HRs] = 1.69-7.25, 95% confidence intervals [CIs] = 1.11 to 31.30, log-rank P ≤ .01). Fibroblast-to-myofibroblast transdifferentiation was dependent on a delayed phase of intracellular reactive oxygen species, generated by NOX4, across different anatomical sites and differentiation stimuli. A statistically significant upregulation of NOX4 expression was found in multiple human cancers (P < .001), strongly correlating with myofibroblastic-CAFs (r = 0.65-0.91, adjusted P < .001). Genetic/pharmacological inhibition of NOX4 was found to revert the myofibroblastic-CAF phenotype ex vivo (54.3% decrease in α-smooth muscle actin [α-SMA], 95% CI = 10.6% to 80.9%, P = .009), prevent myofibroblastic-CAF accumulation in vivo (53.2%-79.0% decrease in α-SMA across different models, P ≤ .02) and slow tumor growth (30.6%-64.0% decrease across different models, P ≤ .04).

Conclusions: These data suggest that pharmacological inhibition of NOX4 may have broad applicability for stromal targeting across cancer types.


Figures

Figure 1.
Figure 1.
Myofibroblast stroma and survival in cancer and analysis of fibroblast-to-myofibroblast transdifferentiation. A) Kaplan-Meier plots of cancer-specific survival rates in patients, with tumor types as indicated (head and neck squamous cell carcinoma), stratified by stromal α-smooth muscle actin (SMA) expression measured by immunohistochemistry. B and C) Human fetal foreskin fibroblasts (HFFF2s) treated with transforming growth factor (TGF)–β (2 ng/mL) for the indicated time periods. B) Immunoblotting (densitometry quantification shown for α-SMA and Nrf2/HSC-70 and pSMAD2/SMAD2(Total)). C) Flow cytometry analysis of dichlorofluorescein-diacetate (DCFH-DA) fluorescence. Data are presented as mean +/− 95% confidence intervals from three independent experiments; statistical significance is shown by one-way analysis of variance with Dunnet’s multiple comparison test relative to the untreated control. D and E) HFFF2s and primary oral fibroblasts treated with TGF-β (2 ng/mL; 72 hours) +/− NAC (5 mM) administered either one hour prior to TGF-β treatment (PRE) or 24 hours after (POST). D) Immunoblotting for α-SMA expression. A representative blot is shown with densitometry quantification (mean +/− 95%CIs from four independent experiments; statistical significance was assessed by two-tailed t test with Welch’s correction). E) Immunofluorescent cytochemistry staining for α-SMA. The percentage of cells positive for α-SMA stress fibers in each condition is also shown. Scale bar represents 50 µm (E). Please see Supplementary Figure 1 (available online) for further information. HNSCC = head and neck squamous cell carcinoma; NAC = N-acetyl cysteine; POST = 24 hours after to TGF-β treatment; PRE = one hour prior to TGF-β treatment; SMA = smooth muscle actin; TGF = transforming growth factor.
Figure 2.
Figure 2.
Role of NOX4 in fibroblast-to-myofibroblast transdifferentiation. A) Volcano plot showing changes in the expression of genes within the gene ontology term “oxidoreductase activity” (GO: 0016491) in human fetal foreskin fibroblasts (HFFF2s) treated with transforming growth factor (TGF)–β (2 ng/mL, seven days), analyzed by RNA sequencing. NOX4 is identified in red. B) Quantitative polymerase chain reaction (Q-PCR) analysis of NOX4 mRNA expression following TGF-β (2 ng/mL) treatment in HFFF2s. C–G) Analysis of TGF-β-induced ROS and myofibroblast differentiation in HFFF2s following NOX4 inhibition either by GKT137831 (GKT; 20 µM) or lentiviral mediated transduction of shRNA targeting NOX4 (MOI = 20; knockdown confirmed in Supplementary Figure 2F, available online). C) Flow cytometry analysis of dichlorofluorescein-diacetate (DCFH-DA) fluorescence at 48 hours from TGF-β treatment (mean +/− 95% CIs from three independent experiments; statistical significance was assessed by two-tailed homoscedastic t test). D) Immunoblotting for α-smooth muscle actin (SMA) expression. A representative blot is shown with densitometry quantification (mean +/− 95% CIs from three independent experiments; statistical significance was assessed by two-tailed t test with Welch’s correction). E) Representative images and quantification from collagen gel contraction assays (mean +/− 95% CIs from three independent experiments; statistical significance was assessed by two-tailed homoscedastic t test). F) Immunofluorescent cytochemistry staining for α-SMA stress fibers. The percentage of cells positive for α-SMA stress fibers in each condition is also shown. G) Q-PCR analysis of extracellular matrix–related gene expression (mean +/− 95% CIs from three independent experiments; statistical significance was assessed by two-tailed t test with Welch’s correction). H) HNSCC cell line (5PT) migration toward conditioned media generated by HFFF2s treated as indicated with TGF-β (2 ng/mL, 72 hours), and/or GKT137831 (20 µM), in a Transwell migration assay (mean +/− 95% CIs from four independent experiments; statistical significance was assessed by two-tailed t test with Welch’s correction). Scale bar represents 50 µm. (***P < .001). Please see Supplementary Figure 2 (available online) for more information. FC = fold change; TGF = transforming growth factor.
Figure 3.
Figure 3.
Analysis of NOX4 expression in different cancers. A–E) Analysis of RNASeq data from The Cancer Genome Atlas database. A) Log-transformed RSEM normalized count (NOX4) expression in patient-matched normal and tumor samples. Statistical significance was assessed using two-sided paired t tests. The difference between means is also shown. B–E) Network map showing a consensus-weighted gene correlation network, constructed from head and neck squamous cell carcinoma (HNSCC), esophageal adenocarcinoma (EAC), and colon adenocarcinoma (COAD) primary tumor samples. Each node on the network map represents a single gene, and the size of each node represents the connectivity of this gene within the network. B) Nodes are colored according to module membership, and the most statistically significantly associated biological function for each module is shown. C–E) Nodes are colored according to the degree of correlation (blue-white-red scale represents r values increasing from 0 to 1) to the extracellular matrix (ECM) module eigengene (C); to the Mellone_TGF_UR myofibroblast gene signature (D) (see Supplementary Table 1, available online, for details); and to NOX4 (E). F) Immunohistochemistry staining for NOX4 and α-SMA in serial sections of HNSCC, EAC, and COAD tissue samples (scale bar represents 50 µm). Please see Supplementary Figure 3 (available online) for more information. COAD = colon adenocarcinoma; ECM = extracellular matrix; EAC = esophageal adenocarcinoma; HNSCC = head and neck squamous cell carcinoma.
Figure 4.
Figure 4.
Effect of NOX4 stromal targeting in vitro and in vivo. A) Immunoblotting analysis of NOX4 expression in patient matched cancer-associated fibroblasts (CAFs) and normal fibroblasts cultured ex vivo from esophageal tissue biopsies (n = 6; statistical significance was assessed by a two-tailed ratio paired t test) (representative blot shown in Supplementary Figure 4A, available online). B) Immunofluorescent cytochemistry and immunoblotting for α-smooth muscle actin (α-SMA) expression (the percentage of cells positive for α−SMA stress fibers in each condition is shown; scale bar represents 50 µm) in CAFs isolated from head and neck squamous cell carcinoma (HNSCC) transduced with shRNA targeting NOX4 (MOI = 20) (knockdown confirmed in Supplementary Figure 4B, available online). C–E) CAFs (n = 7; isolated from HNSCC, n = 1), esophageal adenocarcinoma (EAC; n = 2), colorectal carcinoma (CRC; n = 3) and non–small cell lung carcinoma (NSCLC; n = 1) were treated with GKT137831 (20 µM, 5 days) and analyzed by immunoblotting (C) (mean +/− 95% confidence intervals [CIs], n = 7); intracellular ROS assay (D) (mean +/− 95% CIs, n = 3 [1-HNSCC and 2-EAC]; and CRC or NSCLC cell lines’ (SW480 and H441) Transwell migration toward conditioned media generated by anatomically matched normal fibroblasts or CAFs (mean +/− 95% CIs, n = 4 [3-CRC and 1-NSCLC]). C–E) Statistical significance was assessed by two-tailed t test with Welch’s correction. F–I) 5PT + human foetal foreskin fibroblasts (HFFF2s) (transduced as per Supplementary Figure 2B, available online) grown in organotypic culture (F) or RAG1−/− mice (G–I). F) Invasive index was quantified and statistical significance assessed by two-tailed t test with Welch’s correction. H) Tumor growth curves (mean + 95% CIs, n = 14–15/group; statistical significance was assessed by two-tailed homoscedastic t test). I) α-SMA immunohistochemistry (IHC) staining representative images and quantification (mean +/−95% CIs, n = 9-10/group; statistical significance was assessed by two-tailed homoscedastic t test). J–L) 5PT + HFFF2 xenograft tumors were grown in RAG1−/− mice for four days and then treated with GKT137831 (30 mg/kg) by daily oral gavage. K) Tumor growth curves (mean + 95% CIs, n = 8/group; statistical significance was assessed by two-tailed homoscedastic t test). L) α-SMA IHC staining, representative images, and quantification (mean +/− 95% CIs, n = 8/group; statistical significance was assessed by two-tailed t test with Welch’s correction). Scale bars represent 100 µm unless otherwise stated. Please see Supplementary Figures 4 and 5 (available online) for more information. CAF = cancer-associated fibroblasts; HFFF = human fetal foreskin fibroblasts; IHC = immunohistochemistry; NOF = normal fibroblasts; s.c. = subcutaneous; SMA = smooth muscle actin.

Comment in

References

    1. Hanahan D, Weinberg RA.. Hallmarks of cancer: The next generation. Cell. 2011;144(5):646–674. - PubMed
    1. Erez N, Truitt M, Olson P, Arron ST, Hanahan D.. Cancer-associated fibroblasts are activated in incipient neoplasia to orchestrate tumor-promoting inflammation in an NF-kappaB-dependent manner. Cancer Cell. 2010;17(2):135–147. - PubMed
    1. Goetz JG, Minguet S, Navarro-Lerida I, et al.Biomechanical remodeling of the microenvironment by stromal caveolin-1 favors tumor invasion and metastasis. Cell. 2011;146(1):148–163. - PMC - PubMed
    1. Kraman M, Bambrough PJ, Arnold JN, et al.Suppression of antitumor immunity by stromal cells expressing fibroblast activation protein-alpha. Science. 2010;330(6005):827–830. - PubMed
    1. Marsh D, Suchak K, Moutasim KA, et al.Stromal features are predictive of disease mortality in oral cancer patients. J Pathol. 2011;223(4):470–481. - PubMed

MeSH terms