. 2017 Sep 18;18(1):737.
doi: 10.1186/s12864-017-4114-7.

Regulatory networks underlying mycorrhizal development delineated by genome-wide expression profiling and functional analysis of the transcription factor repertoire of the plant symbiotic fungus Laccaria bicolor

Affiliations

Regulatory networks underlying mycorrhizal development delineated by genome-wide expression profiling and functional analysis of the transcription factor repertoire of the plant symbiotic fungus Laccaria bicolor

Y Daguerre et al. BMC Genomics. .

Abstract

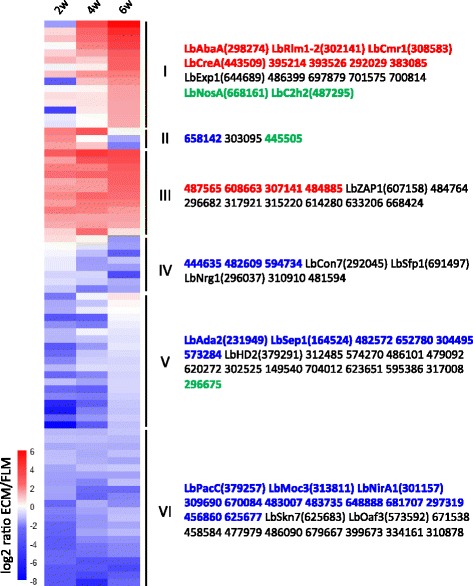
Background: Ectomycorrhizal (ECM) fungi develop a mutualistic symbiotic interaction with the roots of their host plants. During this process, they undergo a series of developmental transitions from the running hyphae in the rhizosphere to the coenocytic hyphae forming finger-like structures within the root apoplastic space. These transitions, which involve profound, symbiosis-associated metabolic changes, also entail a substantial transcriptome reprogramming with coordinated waves of differentially expressed genes. To date, little is known about the key transcriptional regulators driving these changes, and the aim of the present study was to delineate and functionally characterize the transcription factor (TF) repertoire of the model ECM fungus Laccaria bicolor.

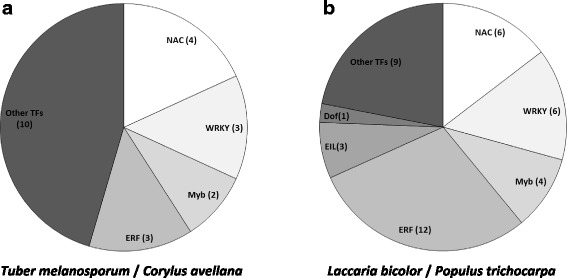
Results: We curated the L. bicolor gene models coding for transcription factors and assessed their expression and regulation in Poplar and Douglas fir ectomycorrhizae. We identified 285 TFs, 191 of which share a significant similarity with known transcriptional regulators. Expression profiling of the corresponding transcripts identified TF-encoding fungal genes differentially expressed in the ECM root tips of both host plants. The L. bicolor core set of differentially expressed TFs consists of 12 and 22 genes that are, respectively, upregulated and downregulated in symbiotic tissues. These TFs resemble known fungal regulators involved in the control of fungal invasive growth, fungal cell wall integrity, carbon and nitrogen metabolism, invasive stress response and fruiting-body development. However, this core set of mycorrhiza-regulated TFs seems to be characteristic of L. bicolor and our data suggest that each mycorrhizal fungus has evolved its own set of ECM development regulators. A subset of the above TFs was functionally validated with the use of a heterologous, transcription activation assay in yeast, which also allowed the identification of previously unknown, transcriptionally active yet secreted polypeptides designated as Secreted Transcriptional Activator Proteins (STAPs).

Conclusions: Transcriptional regulators required for ECM symbiosis development in L. bicolor have been uncovered and classified through genome-wide analysis. This study also identifies the STAPs as a new class of potential ECM effectors, highly expressed in mycorrhizae, which may be involved in the control of the symbiotic root transcriptome.

Keywords: Transcription factors; ectomycorrhiza development; secreted proteins; symbiosis; transcriptional activator trap assay; transcriptome; yeast.


Conflict of interest statement

Ethics approval and consent to participate

Populus trichocarpa derived from cuttings, clone 10,174, Orléans, France. Robin pépinières (France) provided Pseudotsuga menziesii seeds. Laccaria bicolor S238 N strain was selected and is maintained at Centre INRA Grand-Est (UMR 1136).

Consent for publication

Not applicable.

Competing interests

The authors declare that they have no competing interests.

Publisher’s Note

Springer Nature remains neutral with regard to jurisdictional claims in published maps and institutional affiliations.

Figures

Fig. 1
Fig. 1
Distribution of TFs in different families in 70 fungal genomes. The heatmap represents the abundance on each TF family in each genome. Abundance levels range from pale to saturated colour (black for absence, yellow for low abundance, red for high abundance). ECM: ectomycorrhiza; ERM: ericoid mycorrhiza; ORM: orchid mycorrhiza
Fig. 2
Fig. 2
Differential expression of L. bicolor TFs during the development of poplar (P. trichocarpa) ECM. a Laser-scanning confocal microscopy images of transverse sections of P. trichocarpa roots 2, 4, 6 and 12 weeks after contact with L. bicolor hyphae. Plant root cells are counterstained with propidium iodide and fungal cell walls are revealed using WGA-AlexaFluor 488. Bars indicate 10 μm. b Clustering of 100 differentially expressed L. bicolor TF transcripts (>2.5-fold; BH, modified t-test <0.05) during ECM development (2, 4, 6 and 12 weeks after contact) compared to free-living mycelium (see Additional file 3: Table S3 for the list of transcripts). Log2 transformed data were manually clustered. Each gene is represented by a row of coloured boxes (corresponding to ratio values) and a single column represents each developmental time-point. Regulation levels range from pale to saturated colours (red for induction; blue for repression). White indicates no change in gene expression. Protein IDs are given for each cluster. TFs up- or downregulated during both poplar and Douglas fir ECM development are shown in red and blue, respectively. TFs regulated in an opposite manner in ECM root tips of P. trichocarpa or P. menziesii are in green
Fig. 3
Fig. 3
Differential expression of L. bicolor TFs during the development of Douglas fir (P. menziesii) ECM. Clustering of 79 differentially-expressed L. bicolor TF transcripts (>2.5-fold; BH, modified t-test <0.05) during ECM development (2, 4 and 6 weeks after contact) compared to free-living mycelium (see Additional file 4: Table S4 for the list of transcripts). Log2 transformed data were manually clustered. Each gene is represented by a row of coloured boxes (corresponding to ratio values) and a single column represents each time-point. Regulation levels range from pale to saturated colours (red for induction; blue for repression). White indicates no change in gene expression. Protein IDs are given for each cluster. TFs up- or downregulated during both poplar and Douglas fir ECM development are shown in red and blue, respectively. TFs regulated in an opposite manner in ECM root tips of P. trichocarpa or P. menziesii are in green
Fig. 4
Fig. 4
Real-time quantification of TF gene expression in mature P. trichocarpaL. bicolor root tips. Gene expression level in ECM is shown for selected TF’s as the fold change compared to free-living mycelium. Mean values (n = 3) +/− S.E are represented. Significantly upregulated genes are indicated by * (p < 0,05; student T-test) or ** (p < 0,01; student T-test)
Fig. 5
Fig. 5
Distribution of differentially-expressed TF gene families in several types of mycorrhizal associations. We retrieved gene expression data of TF-encoding genes from roots colonized by the following species: ECM fungi (L. bicolor, A. muscaria, H. cylindrosporum, P. croceum, S. luteus, P. involutus, C. geophilum and T. melanosporum), orchid mycorrhizal fungi (S. vermifera and T. calospora) and one ericoid fungus O. maius from Kohler et al. [26]. Differentially-expressed TF genes (≥ 2.5-fold, p-value ≤0.05) (a, upregualted; b, down regulated) in mycorrhizal roots in comparison to free-living mycelium. The histograms show the distribution of TFs from each family as a percentage of the total of TFs in the genome of the corresponding fungi. The total number of regulated TFs for each fungus is indicated between brackets. Stars (*) Indicate families enriched in up-regulated genes compared to the number of these genes in the respective genome (Fisher exact test p < 0.05)
Fig. 6
Fig. 6
Venn diagram of the number of independent clones (left) and corresponding unisequences (right) isolated from the TAT screening of the FLM + FB, Roots and ECM libraries. The number of DBD-containing clones is shown in brackets. Sequences of plant origin retrieved from the screening of the Roots and ECM library are shown on a gray background
Fig. 7
Fig. 7
Distribution of plant proteins retrieved from the TAT screening of the ECM library into TF families. The DBD-containing transcription factors of the plant mycorrhizal partner retrieved from the TAT screening of the ECM library are assigned to TF families, either for T. melanosporum-Corylus avellana ECM root tips (a) and for L. bicolor-P. trichocarpa ECM root tips (b). Families of TFs related to plant-microbe interactions and pathogen defence [46, 59, 64] are highly represented
Fig. 8
Fig. 8
Functional validation of L. bicolor transcriptional activators. Representative example of TAT results conducted on the six TFs similar to known function genes. Colonies were isolated from the TAT assay plates and analyzed by serial dilution assays (starting from an OD600 of 1.0) and 2 μl of each dilution were plated on selective plates. Resistance to 50 mM His3 enzyme inhibitor 3-amino-triazole (3-AT) and uracil prototrophy were used to assay the expression of the HIS3 and URA3 reporter genes. For the LacZ (β -Gal) gene reporter assay, 2 μl of yeast cell dilutions (OD600 = 0.1) were spotted on YPD plates overlaid by a nylon membrane, which were then incubated overnight at 30 °C, prior to β -galactosidase assay. Empty pDEST32 vector transformants were used as negative control; wt, m1 and m2 are internal assay controls

References

    1. Andrianopoulos A, Timberlake WE. The Aspergillus nidulans abaA gene encodes a transcriptional activator that acts as a genetic switch to control development. Mol Cell Biol. 1994;14(4):2503–2515. doi: 10.1128/MCB.14.4.2503. - DOI - PMC - PubMed
    1. Bibbins M, Crepin VF, Cummings NJ, Mizote T, Baker K, Mellits KH, Connerton IF. A regulator gene for acetate utilisation from Neurospora crassa. Mol Gen Genomics. 2002;267(4):498–505. doi: 10.1007/s00438-002-0682-5. - DOI - PubMed
    1. Bin Yusof MT, Kershaw MJ, Soanes DM, Talbot NJ, Zhang Z. FAR1 and FAR2 Regulate the Expression of Genes Associated with Lipid Metabolism in the Rice Blast Fungus Magnaporthe oryzae. PLoS ONE. 2014;9(6):e99760. doi: 10.1371/journal.pone.0099760. - DOI - PMC - PubMed
    1. Brown AJ, Casselton LA. Mating in mushrooms: increasing the chances but prolonging the affair. Trends Genet. 2001;17(7):393–400. doi: 10.1016/S0168-9525(01)02343-5. - DOI - PubMed
    1. Brundrett MC. Coevolution of roots and mycorrhizas of land plants. New Phytol. 2002;154:275–304. doi: 10.1046/j.1469-8137.2002.00397.x. - DOI - PubMed

Substances