

In vivo magnetic resonance images reveal neuroanatomical sex differences through the application of voxel-based morphometry in C57BL/6 mice
- PMID: 28923275
- PMCID: PMC5716897
- DOI: 10.1016/j.neuroimage.2017.09.027
In vivo magnetic resonance images reveal neuroanatomical sex differences through the application of voxel-based morphometry in C57BL/6 mice
Abstract
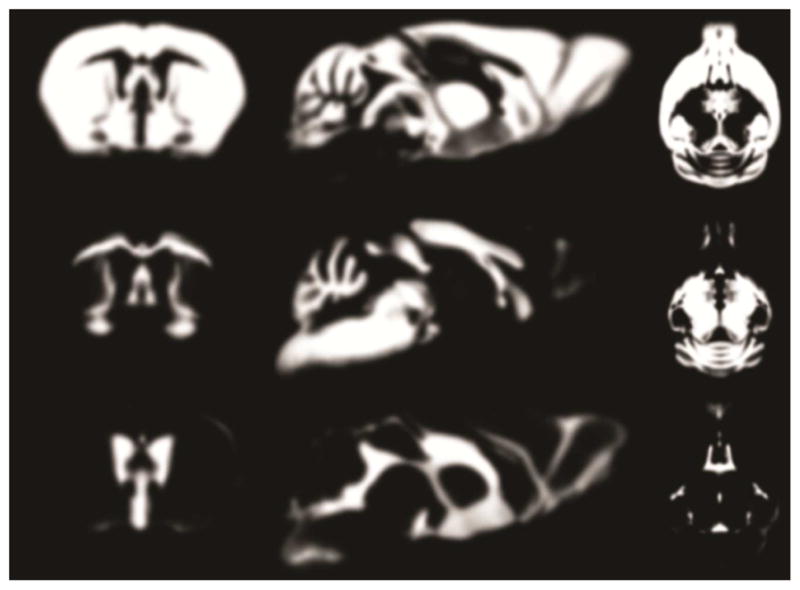
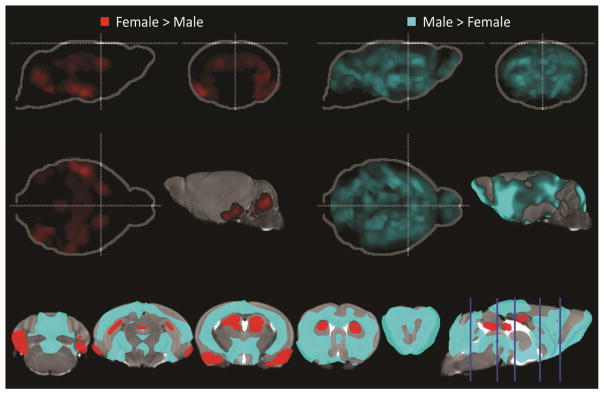
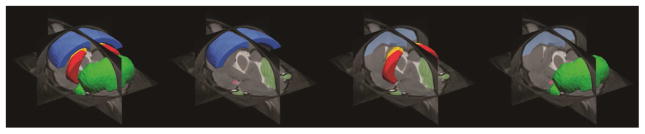
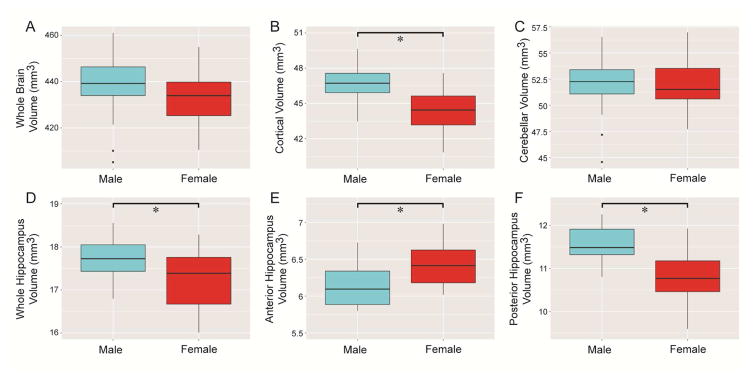
Behaviorally relevant sex differences are often associated with structural differences in the brain and many diseases are sexually dimorphic in prevalence and progression. Characterizing sex differences is imperative to gaining a complete understanding of behavior and disease which will, in turn, allow for a balanced approach to scientific research and the development of therapies. In this study, we generated novel tissue probability maps (TPMs) based on 30 male and 30 female in vivo C57BL/6 mouse brain magnetic resonance images and used voxel-based morphometry (VBM) to analyze sex differences. Females displayed larger anterior hippocampus, basolateral amygdala, and lateral cerebellar cortex volumes, while males exhibited larger cerebral cortex, medial amygdala, and medial cerebellar cortex volumes. Atlas-based morphometry (ABM) revealed a statistically significant sex difference in cortical volume and no difference in whole cerebellar volume. This validated our VBM findings that showed a larger cerebral cortex in male mice and a pattern of dimorphism in the cerebellum where the lateral portion was larger in females and the medial portion was larger in males. These results are consonant with previous ex vivo studies examining sex differences, but also suggest further regions of interest.
Keywords: Atlas-based morphometry; Magnetic resonance image; Sexual dimorphism; Voxel-based morphometry.
Copyright © 2017 Elsevier Inc. All rights reserved.
Figures
Similar articles
-
Considering total intracranial volume and other nuisance variables in brain voxel based morphometry in idiopathic PD.Brain Imaging Behav. 2018 Feb;12(1):1-12. doi: 10.1007/s11682-016-9656-9. Brain Imaging Behav. 2018. PMID: 28070745 Free PMC article.
-
Regional deficits in brain volume in schizophrenia: a meta-analysis of voxel-based morphometry studies.Am J Psychiatry. 2005 Dec;162(12):2233-45. doi: 10.1176/appi.ajp.162.12.2233. Am J Psychiatry. 2005. PMID: 16330585 Review.
-
Sexual dimorphism of the developing human brain.Prog Neuropsychopharmacol Biol Psychiatry. 1997 Nov;21(8):1185-201. doi: 10.1016/s0278-5846(97)00158-9. Prog Neuropsychopharmacol Biol Psychiatry. 1997. PMID: 9460086 Clinical Trial.
-
Structural gray matter differences between first-episode schizophrenics and normal controls using voxel-based morphometry.Neuroimage. 2002 Oct;17(2):880-9. Neuroimage. 2002. PMID: 12377162 Clinical Trial.
-
The efficacy of a voxel-based morphometry on the analysis of imaging in schizophrenia, temporal lobe epilepsy, and Alzheimer's disease/mild cognitive impairment: a review.Neuroradiology. 2010 Aug;52(8):711-21. doi: 10.1007/s00234-010-0717-2. Epub 2010 May 22. Neuroradiology. 2010. PMID: 20495793 Review.
Cited by
-
Mouse Brain Extractor: Brain segmentation of mouse MRI using global positional encoding and SwinUNETR.bioRxiv [Preprint]. 2024 Sep 8:2024.09.03.611106. doi: 10.1101/2024.09.03.611106. bioRxiv. 2024. PMID: 39282435 Free PMC article. Preprint.
-
Developmental trajectories of the human embryologic brain regions.Neurosci Lett. 2019 Aug 24;708:134342. doi: 10.1016/j.neulet.2019.134342. Epub 2019 Jun 19. Neurosci Lett. 2019. PMID: 31228595 Free PMC article.
-
Sex differences in brain atrophy in multiple sclerosis.Biol Sex Differ. 2020 Aug 28;11(1):49. doi: 10.1186/s13293-020-00326-3. Biol Sex Differ. 2020. PMID: 32859258 Free PMC article.
-
The effect of sex on multiple sclerosis risk and disease progression.Mult Scler. 2020 Apr;26(5):554-560. doi: 10.1177/1352458519892491. Epub 2020 Jan 22. Mult Scler. 2020. PMID: 31965884 Free PMC article. Review.
-
Reduced Hippocampal Volume and Neurochemical Response to Adult Stress Exposure in a Female Mouse Model of Urogenital Hypersensitivity.Front Pain Res (Lausanne). 2022 Jan 27;3:809944. doi: 10.3389/fpain.2022.809944. eCollection 2022. Front Pain Res (Lausanne). 2022. PMID: 35295799 Free PMC article.
References
-
- Akhmadeev AV, Galieva LF, Kalimullina LB. The Basolateral Nucleus in the System of Reproductive Centers in the Amygdaloid Body of the Brain. Neuroscience and Behavioral Physiology. 2016;46:652–658.
-
- Allen G, Buxton RB, Wong EC, Courchesne E. Attentional activation of the cerebellum independent of motor involvement. Science. 1997;275:1940–1943. - PubMed
-
- Allen LS, Gorski RA. Sex difference in the bed nucleus of the stria terminalis of the human brain. J Comp Neurol. 1990;302:697–706. - PubMed
-
- Andreano JM, Cahill L. Sex influences on the neurobiology of learning and memory. Learn Mem. 2009;16:248–266. - PubMed
-
- Arnold AP. Sex chromosomes and brain gender. Nat Rev Neurosci. 2004;5:701–708. - PubMed
Publication types
MeSH terms
Grants and funding
LinkOut - more resources
Full Text Sources
Other Literature Sources
Medical
