. 2017 Oct 13;121(9):1069-1080.
doi: 10.1161/CIRCRESAHA.117.311955. Epub 2017 Sep 18.

GJA1-20k Arranges Actin to Guide Cx43 Delivery to Cardiac Intercalated Discs

Affiliations

GJA1-20k Arranges Actin to Guide Cx43 Delivery to Cardiac Intercalated Discs

Wassim A Basheer et al. Circ Res. .

Abstract

Rationale: Delivery of Cx43 (connexin 43) to the intercalated disc is a continuous and rapid process critical for intercellular coupling. By a pathway of targeted delivery involving microtubule highways, vesicles of Cx43 hemichannels are efficiently trafficked to adherens junctions at intercalated discs. It has also been identified that actin provides rest stops for Cx43 forward trafficking and that Cx43 has a 20 kDa internally translated small C terminus isoform, GJA1-20k (Gap Junction Protein Alpha 1- 20 kDa), which is required for full-length Cx43 trafficking, but by an unknown mechanism.

Objective: We explored the mechanism by which the GJA1-20k isoform is required for full-length Cx43 forward trafficking to intercalated discs.

Methods and results: Using an in vivo Adeno-associated virus serotype 9-mediated gene transfer system, we confirmed in whole animal that GJA1-20k markedly increases endogenous myocardial Cx43 gap junction plaque size at the intercalated discs. In micropatterned cell pairing systems, we found that exogenous GJA1-20k expression stabilizes filamentous actin without affecting actin protein expression and that GJA1-20k complexes with both actin and tubulin. We also found that filamentous actin regulates microtubule organization as inhibition of actin polymerization with a low dose of latrunculin A disrupts the targeting of microtubules to cell-cell junctions. GJA1-20k protects actin filament from latrunculin A disruption, preserving microtubule trajectory to the cell-cell border. For therapeutic implications, we found that prior in vivo Adeno-associated virus serotype 9-mediated gene delivery of GJA1-20k to the heart protects Cx43 localization to the intercalated discs against acute ischemic injury.

Conclusions: The internally translated GJA1-20k isoform stabilizes actin filaments, which guides growth trajectories of the Cx43 microtubule trafficking machinery, increasing delivery of Cx43 hemichannels to cardiac intercalated discs. Exogenous GJA1-20k helps to maintain cell-cell coupling in instances of anticipated myocardial ischemia.

Keywords: adherens junctions; connexin 43; cytoskeleton; gap junctions; latrunculin A; trafficking; tubulin.


Conflict of interest statement

DISCLOSURES

We have no conflict of interest to disclose.

Figures
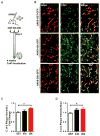
Figure 1
Figure 1. GJA1-20k increases Cx43 gap junction plaques at the intercalated discs in vivo
(A) Schematic of the AAV9 gene delivery protocol. Mice received via retro-orbital injection 3×10¹⁰ vg of AAV9 vectors expressing GST-GFP, GJA1-43k-GFP, or GJA1-20k-GFP. Localization of Cx43 at the intercalated discs was assessed at 4 weeks post injection. (B) Immunofluorescence detection of N-Cadherin (red, marking intercalated disc structures) and Cx43 (anti-N-terminus, green) in heart sections from the different AAV9 treatment groups. Average intensity projections of confocal z-stacks (13.5 μm thickness), scale bar = 50 μm. (C) Quantification of Cx43 fluorescence intensity in intercalated disc regions. Data are presented as mean ±SEM relative to GST group (n = 3 hearts per group, 6–15 images analyzed per heart), *p < 0.05, by one-way ANOVA followed by Tukey’s post-hoc-test. (D) Quantification of Cx43 fluorescence intensity normalized to N-Cadherin signal. Data are presented as mean ±SEM (n = 3 hearts per group, 6–15 images analyzed per heart), *p < 0.05, **< 0.01, by one-way ANOVA followed by Tukey’s post-hoc-test.
Figure 2
Figure 2. GJA1-20k increases junctional Cx43 protein levels without affecting Cx43 transcription
(A) Adult mice received via retro-orbital injection 3×10¹⁰ vg of AAV9 vectors expressing either GST-GFP, GJA1-43k-GFP or GJA1-20k-GFP. 4 weeks following AAV9 gene expression, mouse hearts were subjected to TritonX-100-based tissue fractionation of soluble (non-junctional) and insoluble (junctional) proteins and probed for Cx43, α-tubulin, and N-Cadherin using Western blot analysis. (B–C) Quantification of the amount of Cx43 in the soluble (B) and insoluble (C) fractions, normalized to Cx43 input and expressed as fold change relative to GST control. Data are presented as the mean ± SEM (n = 3 hearts per group) *p < 0.05, ** < 0.01, by one-way ANOVA followed by Tukey’s post-hoc-test. (D) 4 weeks following AAV9 gene expression of GST-GFP or GJA1-20k-GFP (retro-orbital injection 3×10¹⁰ vg), Cx43 mRNA level was assessed in the mouse heart using Taqman gene expression assay and Real-Time PCR. Data are presented as mean ±SEM relative to GST group (n = 3 hearts per group), no significance was shown by student’s t-test
Figure 3
Figure 3. GJA1-20k isoform promotes actin polymerization and stabilizes F-actin
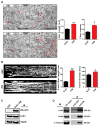
(A) Representative TEM images of HeLa cells transfected with GST-GFP control or GJA1-20k-GFP, showing fiber structures indicated by red arrows (top panels) and red line traces (lower panels). Scale bar = 500 nm. Fiber length (GST n=193 and GJA1-20k n=368 fibers measured from 13 cells for each treatment) and fiber number (n=13 images per group) are quantified in the graphs. Data are mean ± SEM. * p < 0.05, ****<0.0001 by student’s t-test. (B) Confocal images of micropatterned Hela cells transfected with GST-GFP control or GJA1-20k-GFP and treated with phalloidin for F-actin labeling. Scale bar = 10μm. Actin fiber length (GST n=420 and GJA1-20k n=253 actin fibers measured from 10–12 cells) and actin signal intensity (GST n=23 and GJA1-20k= 25 cells) are quantified in the graphs. Data are mean ± SEM. * p < 0.05, ****<0.0001 by student’s t-test. (C) Western blotting of GJA1-20k, actin, and GAPDH in HeLa cells transfected with GFP tagged GST or GJA1-20k. (D) Co-immunoprecipitation assay with exogenous GJA1-20k-HA (IP with anti-HA or anti-GST antibodies) in HeLa cells and immunoblotting (IB) with anti-Cx43-CT, anti-actin or anti-α-tubulin antibodies.
Figure 4
Figure 4. GJA1-20k promotes β-actin polymerization, preserving and protecting the F-actin structure in cardiomyocytes
(A) Confocal images of micropatterned neonatal mouse ventricular cardiomyocytes transduced with GFP-V5, GJA1-43k-V5 or GJA1-20k-V5 adenovirus and treated with DMSO or 250nM of Latrunculin A (LatA) and labeled for β-actin by immunofluorescence. Box inserts show zoomed in areas of the cardiomyocytes. Scale bar =5μm. β-actin fiber number is quantified in (B) and data are presented as mean ±SEM (number of cells quantified for each group shown on the bars), *p < 0.05, **< 0.01, ***< 0.001, ****< 0.0001 by one-way ANOVA (Kruskal-Wallis test) followed by Dunn’s multiple comparisons test.
Figure 5
Figure 5. Actin polymerization as regulated by GJA1-20k is required to orient microtubule growth trajectories towards the cell-cell border
(A) Confocal images of micropatterned neonatal mouse ventricular cardiomyocyte pairs treated with DMSO or 250 nM of LatA and labeled for EB1 (green, marking rapidly growing tips of microtubules) and N-Cadherin (red, marking cell-cell border) by immunofluorescence. (B) Number of EB1 molecules touching the cell-cell border is quantified and normalized to border length as shown in the graph. Data are presented as mean ±SEM, n= 25 cell pairs analyzed for each group from 2 dishes (10–15 images per dish),****p< 0.0001 by students’ t-test. (C) Confocal images of micropatterned neonatal mouse ventricular cardiomyocytes treated with DMSO or 250 nM of LatA and labeled for α-tubulin (green, marking microtubule structures) and N-Cadherin (red) by immunofluorescence. (D) Number of α-tubulin molecules touching the cell-cell border is quantified and normalized to border length as shown in the graph. Data are presented as mean ±SEM, n= 19 cell pairs for each group from 2 dishes (9–10 images per dish),****p< 0.0001 by students’ t-test. (E) Confocal images of micropatterned neonatal mouse cardiomyocyte pairs transduced with GFP-V5, GJA1-43k-V5 or GJA1-20k-V5 adenovirus and treated with DMSO or 250 nM of LatA and labeled for α-tubulin (green) by immunofluorescence. The cell-cell border is labeled with WGA and shown as a traced dotted line. The microtubules reaching the border are traced with arrows (right panels). (F) Quantification of microtubules number that are touching the cell-cell border, normalized to border length. Data are presented as mean ±SEM (n= 10 cells per group), *p < 0.05, ***< 0.001 by one-way ANOVA followed by Tukey’s post-hoc-test.
Figure 6
Figure 6. GJA1-20k maintains Cx43 gap junction localization to the intercalated discs after acute ischemia
(A) Adult mice received via retro-orbital injection 3×10¹⁰ vg of AAV9 vectors expressing GST-GFP, GJA1-43k-GFP, or GJA1-20k-GFP. 4 weeks post injection, the hearts were excised and maintained using Langendorff perfusion apparatus for 20 minutes followed by 30 min of no flow ischemia or continuous perfusion for control hearts. (B) Immunofluorescence detection of N-Cadherin (red, marking intercalated disc structures) and Cx43 (anti-N-terminus, green) in heart sections from the different AAV9 treatment groups after ischemia or control perfusion. Average intensity projections of confocal z-stacks (13.5 μm thickness), scale bar = 50 μm. (C) Quantification of Cx43 fluorescence intensity at intercalated disc regions. Data are presented as mean ±SEM relative to GST ischemia group (number of hearts analyzed per group is shown on bars, 5–10 images analyzed per heart), *p < 0.05, **< 0.01, ***< 0.001, ****<0.0001, by one-way ANOVA followed by Tukey’s post-hoc-test. (D) Quantification of Cx43/N-Cadherin signal at intercalated disc regions. Data are presented as mean ±SEM (number of hearts analyzed per group in shown on bars, 5–10 images analyzed per heart), ***p< 0.001, ****<0.0001, by one-way ANOVA followed by Tukey’s post-hoc-test.

References

    1. Porter KR, Novikoff AB. The 1974 nobel prize for physiology or medicine. Science. 1974;186:516–20. - PubMed
    1. Heemels MT. Medicine Nobel goes to pioneer of protein guidance mechanisms. Nature. 1999;401:625. - PubMed
    1. Ferro-Novick S, Brose N. Nobel 2013 Physiology or medicine: Traffic control system within cells. Nature. 2013;504:98. - PubMed
    1. Beyer EC, Paul DL, Goodenough DA. Connexin43: a protein from rat heart homologous to a gap junction protein from liver. The Journal of cell biology. 1987;105:2621–9. - PMC - PubMed
    1. Unwin PN, Zampighi G. Structure of the junction between communicating cells. Nature. 1980;283:545–9. - PubMed