Snapin promotes HIV-1 transmission from dendritic cells by dampening TLR8 signaling
- PMID: 28923824
- PMCID: PMC5641917
- DOI: 10.15252/embj.201695364
Snapin promotes HIV-1 transmission from dendritic cells by dampening TLR8 signaling
Abstract
HIV-1 traffics through dendritic cells (DCs) en route to establishing a productive infection in T lymphocytes but fails to induce an innate immune response. Within DC endosomes, HIV-1 somehow evades detection by the pattern-recognition receptor (PRR) Toll-like receptor 8 (TLR8). Using a phosphoproteomic approach, we identified a robust and diverse signaling cascade triggered by HIV-1 upon entry into human DCs. A secondary siRNA screen of the identified signaling factors revealed several new mediators of HIV-1 trans-infection of CD4+ T cells in DCs, including the dynein motor protein Snapin. Inhibition of Snapin enhanced localization of HIV-1 with TLR8+ early endosomes, triggered a pro-inflammatory response, and inhibited trans-infection of CD4+ T cells. Snapin inhibited TLR8 signaling in the absence of HIV-1 and is a general regulator of endosomal maturation. Thus, we identify a new mechanism of innate immune sensing by TLR8 in DCs, which is exploited by HIV-1 to promote transmission.
Keywords: HIV‐1 and dendritic cells; HIV‐1 transmission; Snapin and vesicular trafficking; TLR8 sensing.
© 2017 The Authors. Published under the terms of the CC BY 4.0 license.
Figures

- A
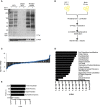
Immunoblot using anti‐phosphotyrosine antibody of DC whole‐cell lysates (WCL) in the presence and absence of HIV‐1 for 10 min (lanes 1 and 2), the same WCL diluted 1:10 (lanes 3 and 4), and phosphoenriched fractions derived from the same WCL (lanes 5 and 6).
- B
Schematic of the phosphoproteomic approach used. DCs were exposed to HIV‐1 or mock infected for 10 min, lysed and enriched for phosphoproteins. Nine biological replicates were collected, pooled, and quantified by Bradford dye assay. Equalized amounts of phosphoenriched lysates were separated by OFFGEL fractionation and prepared for LC‐MS/MS analysis before bioinformatics analysis by the Central Proteomics Facilities Pipeline based in Oxford.
- C
Plot showing distribution of fold changes in protein abundance between HIV‐1 and mock‐infected samples as determined by SINQ. The x‐axis (blue rhombi) represents proteins identified and the y‐axis (black bars) the associated log2 fold change of the abundance of the protein infected as opposed to mock‐infected fractions.
- D, E
Ingenuity pathway analysis (IPA) of the HIV‐1 phosphoproteome in DCs showing molecular and cellular function (D) and top five canonical pathways (E).

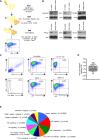
Workflow for the secondary RNAi screen is shown. 5 × 10⁴ DCs were transfected in triplicates with SMARTpool siRNAs and incubated in 96‐well plates for 48 h. Cells were then washed and exposed to HIV‐1 NL4‐3 BaL for 2 h prior to co‐culture with autologous CD4+ PHA blasts. Three days later cells were stained with surface markers and intracellular p24 and analyzed by flow cytometry for intracellular p24 gag in CD4+ T cells.
Knockdown efficiency of selected genes. DCs were electroporated with non‐silencing and specific siRNAs using the Neon transfection system and harvested 48 h later for immunoblot of proteins as indicated.
Representative FACS plots of siRNAs in the screen showing reduction (siRNA 1) or no effect (siRNA 10) on HIV‐1 trans‐infection.
Dot‐plot of RNAi screen for identification of genes affecting HIV‐1 trans‐infection. Each dot represents a single gene. Values are mean of three independent experiments from different donors. The horizontal line indicates the population mean.
Ingenuity pathway analysis classifying host factors affecting HIV‐1 trans‐infection by molecular function. Only categories containing 2 or more factors were charted. Number indicates number of genes identified per category.

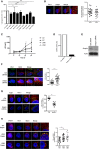
DCs were transfected with Ctrl siRNAs or siRNAs targeting subunits of the BLOC1 complex (Blos1, Blos2, Blos3, Cappacino (CNO), Dysbindin (DTNBP1), Muted, Palladin (PLDN), or Snapin) prior to undertaking the FACS‐based trans‐infection assay described in Fig 2.
DCs were transfected with Flag‐tagged Snapin for 24 h prior to exposure to HIV‐1 at 10 and 30 min. Left panel shows confocal images of DCs stained with anti‐p24 (green), anti‐Flag (red), and Topra nuclear stain (blue). Right panel shows plot of correlation coefficient of HIV‐1 co‐localized with Snapin over time.
DCs transfected with Ctrl, Flag‐tagged wild‐type (WT), mutant (L99K), or (V92K) Snapin for 24 h prior to exposure to HIV‐1 and co‐culture with CD4+ T cells. p24 levels detected in DC CD4+ T cell co‐cultures are shown.
DCs transfected with Ctrl or Snapin siRNAs for 24 h and qPCR for Snapin shown.
DCs transfected with Ctrl or Snapin siRNAs for 24 h and immunoblot for Snapin (Actin was used as a loading control).
DCs transfected as in (D) and stained with anti‐p24 (green), anti‐EEA1 (red), and Topra nuclear stain (blue). Representative confocal images are shown. Graph shows co‐localization between HIV‐1 and EEA‐1 in Ctrl or Snapin knockdown cells.
DCs transfected as in (D) and stained with anti‐p24 (green), anti‐Rab7 (red), and Topra nuclear stain (blue). Graph shows co‐localization between HIV‐1 and Rab7 in Ctrl or Snapin knockdown cells.
DCs transfected with Flag‐tagged wild‐type (WT) or mutant (L99K) or (V92K) Snapin lentivectors for 24 h and stained with anti‐Flag (pink), anti‐p24 (green), anti‐EEA1 (red), and Topra nuclear stain (blue). Graph shows co‐localization between HIV‐1 and EEA‐1 in WT, V92K, or L99K transfected cells.

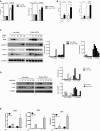
DCs transfected with Ctrl or Snapin siRNAs for 24 h prior to exposure to HIV‐1 over time, lysed and immunoblot undertaken using anti‐pStat1 or anti‐actin antibody.
For quantification, images were acquired with the ChemiDoc MP system and analysis was performed using Image Lab 4.0 software.
ELISAs of CXCL10, CXCL9 and TNFα levels detected following HIV‐1 exposure to Ctrl or Snapin knockdown DCs.
MUTZ3 cells were transduced with a TLR8‐FLAG lentivirus followed by Ctrl or Snapin shRNA and analyzed by confocal microscopy for co‐localization of HIV‐1 with TLR8‐FLAG 1 h post‐infection (cells stained with anti‐p24 (green) and anti‐Flag (red). Right panel shows degree of co‐localization.

DCs were transfected with Snapin or Ctrl siRNAs and activated with ssRNA40. mRNA was harvested 6 h post‐activation for IL‐6 and IFNβ1 qPCR. Results were relative to a GAPDH and lyovec control.
DCs treated as in (A) and supernatant analyzed using IL‐6 or TNFα ELISA. Data are representative of 4–6 independent experiments.
DCs transfected with Ctrl or Snapin siRNAs and stimulated with R848 over time. Cells were lysed and immunoblotted for phospho‐p38 (pp38), phospho‐Stat1 (p‐STAT1), STAT1, phospho‐IκB‐α, and LAMP1. Immunoblot quantification is shown in the right panel.
DCs transfected with Ctrl or Snapin siRNA and activated with ssRNA40 over time. Immunoblot using anti‐phospho‐p38 (upper panel), phospho‐Erk (middle panel), and β‐tubulin (lower panel) is shown. Immunoblot quantification is shown in the right panel.
mRNA of TNFA and ifnb1 (left and middle panel) or TNFα protein level in DCs transfected with Ctrl or Snapin siRNAs and left uninfected or infected with Sendai virus.

DCs transfected with Ctrl or Snapin siRNAs for 24 h prior to incubation with beads. Left panel shows confocal images (beads (green), anti‐EEA1 (red), nuclear stain (blue)), and right panel shows degree of co‐localization of beads with EEA1.
DCs transfected with Ctrl or Snapin siRNAs for 24 h prior to incubation with pH‐sensitive pHrodo™ Green dextran (10,000 MW, P35368, 509/533 nm) for different time points prior to FACS analysis.
References
-
- Berger G, Durand S, Goujon C, Nguyen XN, Cordeil S, Darlix JL, Cimarelli A (2011) A simple, versatile and efficient method to genetically modify human monocyte‐derived dendritic cells with HIV‐1‐derived lentiviral vectors. Nat Protoc 6: 806–816 - PubMed
Publication types
MeSH terms
Substances
Grants and funding
LinkOut - more resources
Full Text Sources
Other Literature Sources
Research Materials
Miscellaneous

