. 2017 Nov 1;77(21):5913-5924.
doi: 10.1158/0008-5472.CAN-16-2686. Epub 2017 Sep 18.

MCT1 Inhibitor AZD3965 Increases Mitochondrial Metabolism, Facilitating Combination Therapy and Noninvasive Magnetic Resonance Spectroscopy

Affiliations

MCT1 Inhibitor AZD3965 Increases Mitochondrial Metabolism, Facilitating Combination Therapy and Noninvasive Magnetic Resonance Spectroscopy

Mounia Beloueche-Babari et al. Cancer Res. .

Abstract

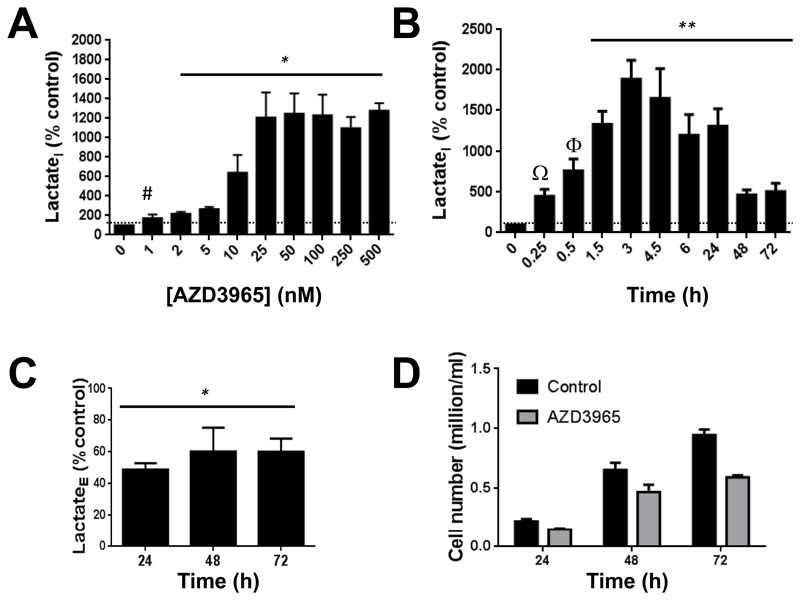
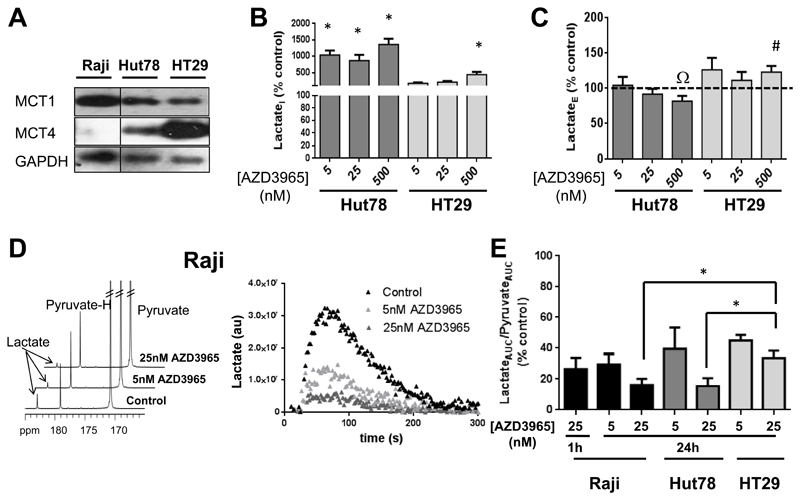
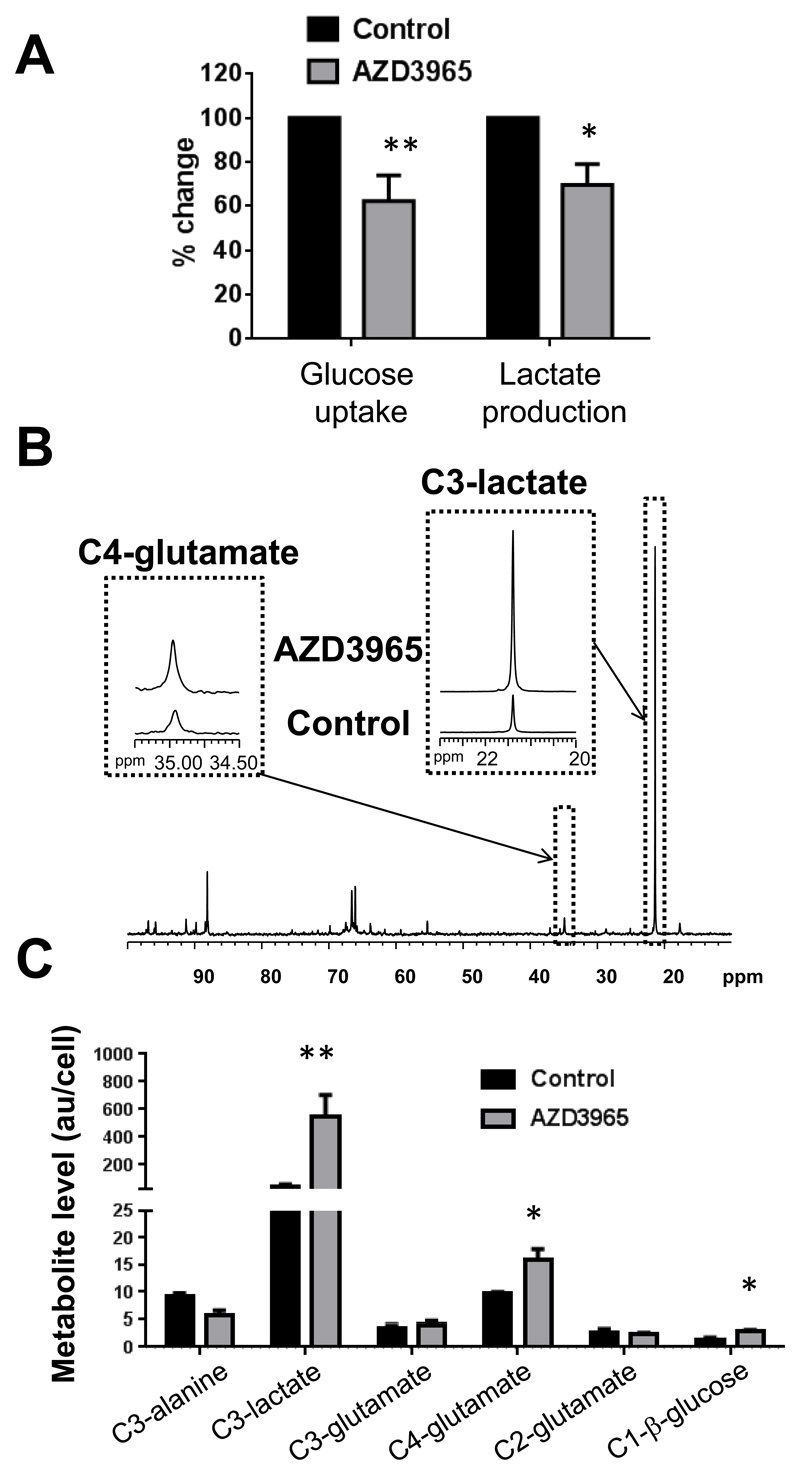
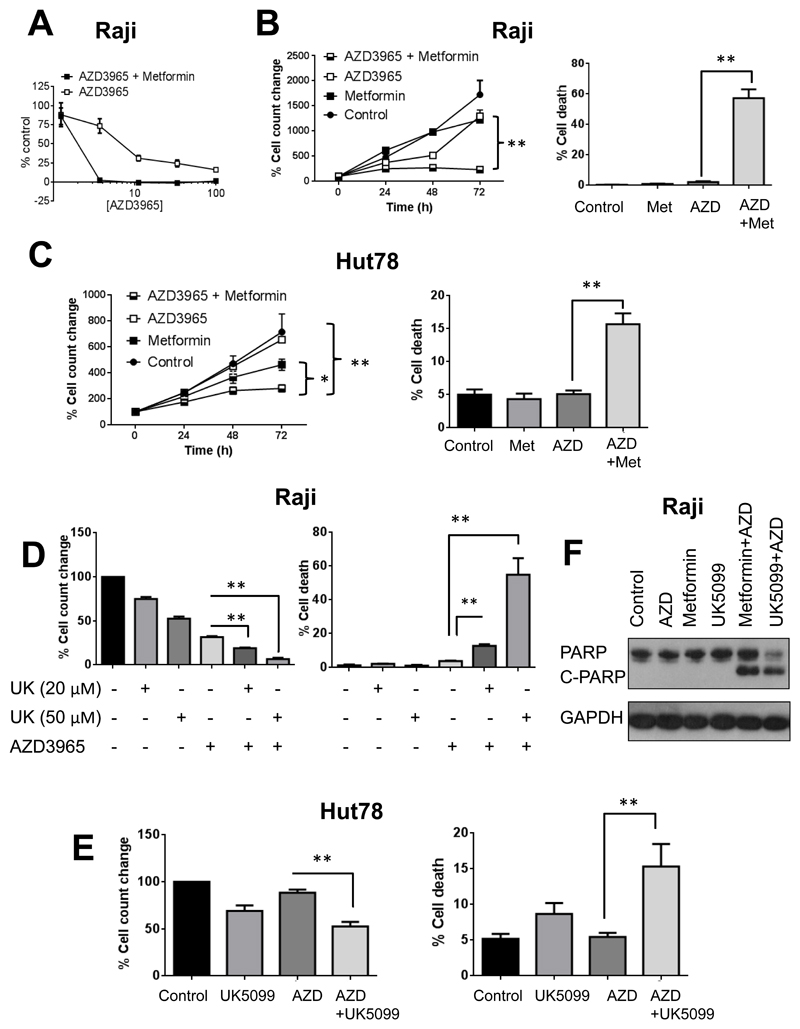
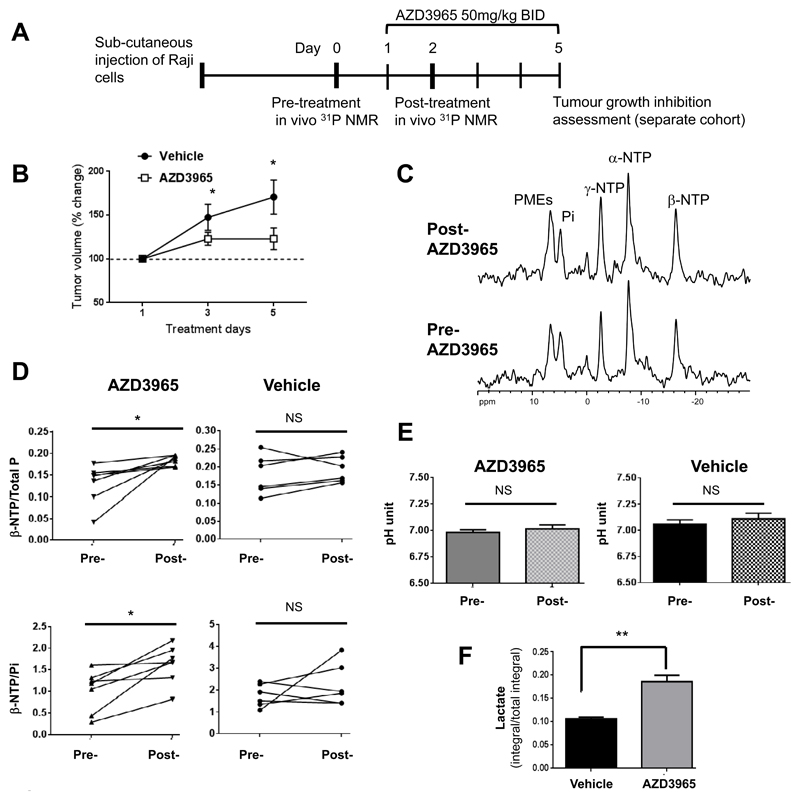
Monocarboxylate transporters (MCT) modulate tumor cell metabolism and offer promising therapeutic targets for cancer treatment. Understanding the impact of MCT blockade on tumor cell metabolism may help develop combination strategies or identify pharmacodynamic biomarkers to support the clinical development of MCT inhibitors now in clinical trials. In this study, we assessed the impact of the MCT1 inhibitor AZD3965 on cancer cell metabolism in vitro and in vivo Exposing human lymphoma and colon carcinoma cells to AZD3965 increased MCT4-dependent accumulation of intracellular lactate, inhibiting monocarboxylate influx and efflux. AZD3965 also increased the levels of TCA cycle-related metabolites and 13C-glucose mitochondrial metabolism, enhancing oxidative pyruvate dehydrogenase and anaplerotic pyruvate carboxylase fluxes. Increased mitochondrial metabolism was necessary to maintain cell survival under drug stress. These effects were counteracted by coadministration of the mitochondrial complex I inhibitor metformin and the mitochondrial pyruvate carrier inhibitor UK5099. Improved bioenergetics were confirmed in vivo after dosing with AZD3965 in mouse xenograft models of human lymphoma. Our results reveal new metabolic consequences of MCT1 inhibition that might be exploited for therapeutic and pharmacodynamic purposes. Cancer Res; 77(21); 5913-24. ©2017 AACR.


Figures

Figure 1
Figure 1. Time- and concentration-dependent effects of AZD3965 on intracellular and extracellular lactate levels and cell counts in MCT4- Raji human lymphoma cells.
A) Concentration-dependent accumulation in LactateI in Raji cells treated for 24h with AZD3965. B) Time dependent-changes in LactateI in 25nM AZD3965-treated Raji cells relative to same time point controls. C) Decreased LactateE in Raji cells following exposure to AZD3965 (25nM) for the indicated durations. D) AZD3965 treatment (25nM) reduces but does not totally halt Raji cell proliferation over 72h. *: p<0.05, **: P≤0.03, #, P=0.12, Ω: P=0.07, Φ: P=0.06. Dashed line represents the 100% control level.
Figure 2
Figure 2. AZD3965 effects on monocarboxylate influx and efflux in human cancer cells harboring varying MCT4 expression levels.
A) Western blots showing baseline MCT1 and MCT4 expression in Raji, Hut78 and HT29 human cancer cells. B) The effect of AZD3965 on LactateI and C) LactateE levels in MCT4+ Hut78 and MCT4+++ HT29 cells. D)13C NMR spectra and time series integrals showing the changes in hyperpolarized 13C-lactate signal following incubation of control, 5nM and 25nM AZD3965-treated Raji in hyperpolarized 13C-pyruvate. E) Summary of changes in of 13C-pyruvate-lactate exchange (determined by LactateAUC/PyruvateAUC) resulting from inhibition of 13C-pyruvate uptake by AZD3965 in MCT4- Raji, MCT4+ Hut78 and MCT4+++ HT29 human cancer cells. *: P≤0.04, #: P=0.077, Ω: P=0.067. Dashed line represents the 100% control level.
Figure 3
Figure 3. MCT1 inhibition with AZD3965 impairs glycolytic activity and increases mitochondrial pyruvate metabolism.
A) Extracellular metabolite analysis of [1-13C]glucose labelled media from Raji cells show decreased glucose uptake and lactate production following exposure to AZD3965 (25nM, 6h). B) 13C NMR spectra illustrating the changes in [3-13C]lactate and [4-13C]glutamate signals in AZD3965-treated compared to control Raji cells incubated in [1-,13C]glucose for 6h. C) Intracellular [1-13C]glucose flux analysis in Raji cells showing increased [4-13C]glutamate (PDH flux) concomitant with accumulation of [3-13C]lactate and [1-13C]glucose following AZD3965 treatment. **: P≤0.01, *: P<0.02.
Figure 4
Figure 4. Impairing mitochondrial metabolism increases sensitivity to AZD3965.
A) Cell growth inhibition data showing that blockade of oxidative mitochondrial metabolism by complex I inhibitor metformin (1mM) increases the potency of AZD3965 (72h exposure). B) Cell count and viability data showing that inhibition with metformin (1mM, Met) prevents the continued cell growth observed with AZD3965 alone (25nM, AZD) and promotes cell kill in Raji cells as indicated by trypan blue exclusion. C) Cell counts showing that inhibition with metformin (1mM) enhances the anti-proliferative effects of AZD3965 (25nM) and increases cell death (as indicated by trypan blue staining) in Hut78 cells. D) Cell count and % viability data showing that inhibition of MPC with UK5099 (UK) enhances the efficacy of AZD3965 (25nM, 72h) leading to increased cell death in Raji cells. E) Cell counts and % viability data showing that co-treatment with the MPC inhibitor UK5099 (50 µM) enhances the anti-proliferative effects of AZD3965 (AZD 25nM, 72h) and increases cell death (as indicated by trypan blue staining) in Hut78 cells. F) Western blots showing increased PARP cleavage (C-PARP/PARP) in Raji cells treated for 72h with a combination of AZD3965 (25nM, AZD)+Metformin (1mM, Met) or UK5099 (50µM) relative to single agent therapy.*P<0.02, **: P<0.01.
Figure 5
Figure 5. AZD3965 treatment leads to improved bioeneregetics in Raji xenograft tumors but no changes in tumor pH as observed by in vivo 31P NMR spectroscopy.
A) Schematic of the in vivo study protocol. B) Changes in Raji xenograft tumor growth following administration of AZD3965 (50mg/kg twice daily) over 5 days. C) in vivo 31P NMR spectra obtained from Raji xenograft tumors showing improved tumor bioenergetics (β-NTP/total P and β-NTP/Pi) following 2 days of AZD3965 treatment. D) Changes in the ratios of β-NTP/total P and β-NTP/Pi detected by in vivo 31P NMR spectroscopy following vehicle or AZD3965 treatment in Raji xenograft tumors. E) Changes in tumor pH following vehicle or AZD3965 treatment as measured by in vivo 31P NMR spectroscopy. F) Lactate levels in vehicle- and AZD3965-treated tumors measured by ex vivo 1H NMR analysis of resected tumors confirm MCT1 inhibition. **: P=0.001, *: P≤0.03, NS: P≥0.36.

References

    1. Halestrap AP. The SLC16 gene family - structure, role and regulation in health and disease. Mol Asp Med. 2013;34:337–49. - PubMed
    1. Doherty JR, Cleveland JL. Targeting lactate metabolism for cancer therapeutics. J Clin Invest. 2013;123(9):3685–92. - PMC - PubMed
    1. Hirschhaeuser F, Sattler UG, Mueller-Klieser W. Lactate: a metabolic key player in cancer. Cancer Res. 2011;71(22):6921–5. - PubMed
    1. Parks SK, Chiche J, Pouyssegur J. Disrupting proton dynamics and energy metabolism for cancer therapy. Nat Rev Cancer. 2013;13(9):611–23. - PubMed
    1. Le Floch R, Chiche J, Marchiq I, Naiken T, Ilc K, Murray CM, et al. CD147 subunit of lactate/H+ symporters MCT1 and hypoxia-inducible MCT4 is critical for energetics and growth of glycolytic tumors. Proc Nat Acad Sci USA. 2011;108(40):16663–8. - PMC - PubMed

Publication types

MeSH terms