. 2017 Oct 3;114(40):10678-10683.
doi: 10.1073/pnas.1702078114. Epub 2017 Sep 18.

Extinction risk is most acute for the world's largest and smallest vertebrates

Affiliations

Extinction risk is most acute for the world's largest and smallest vertebrates

William J Ripple et al. Proc Natl Acad Sci U S A. .

Abstract

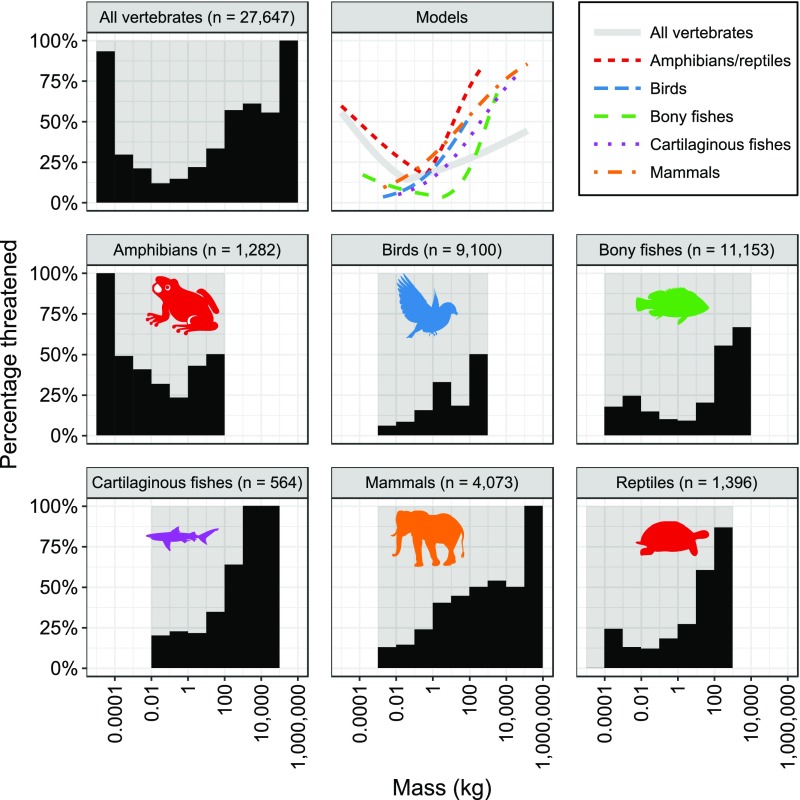
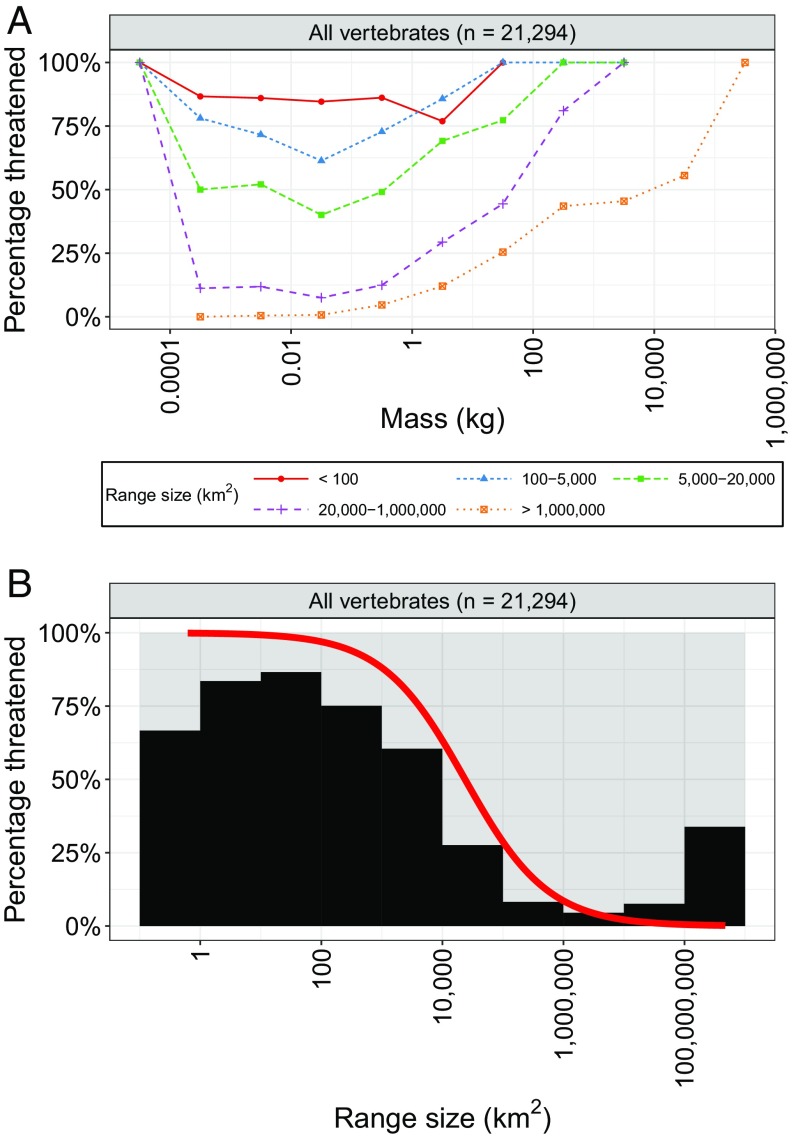
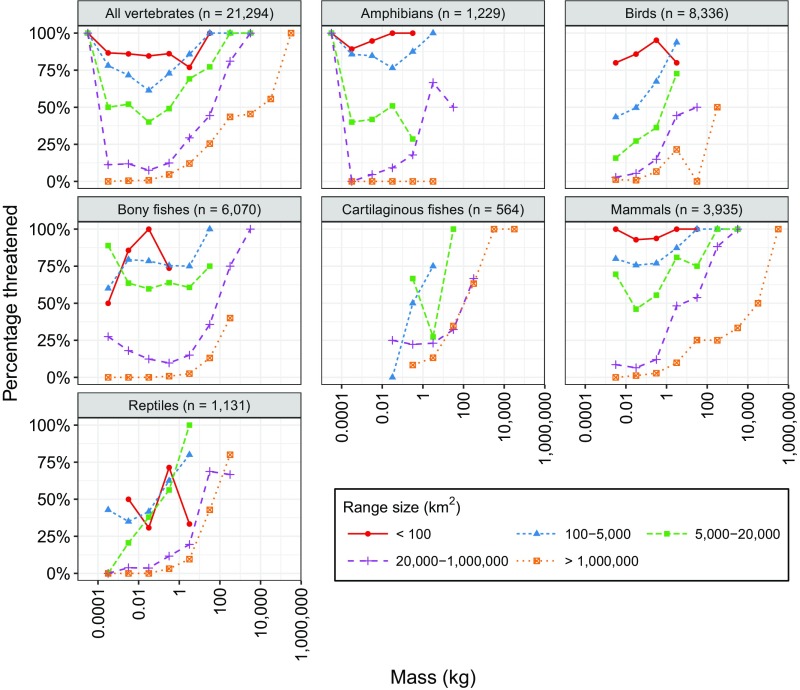
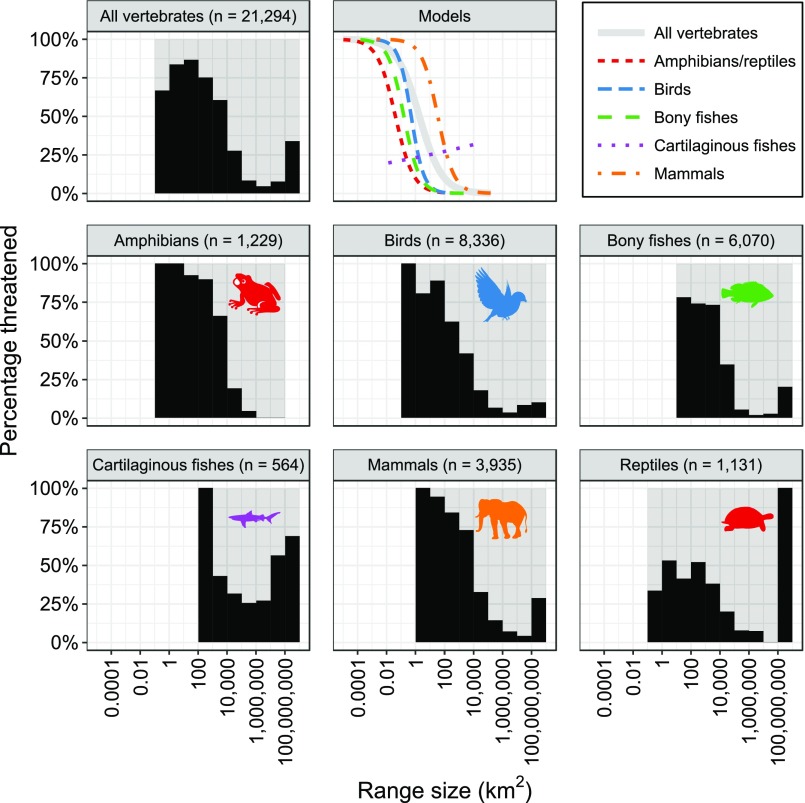
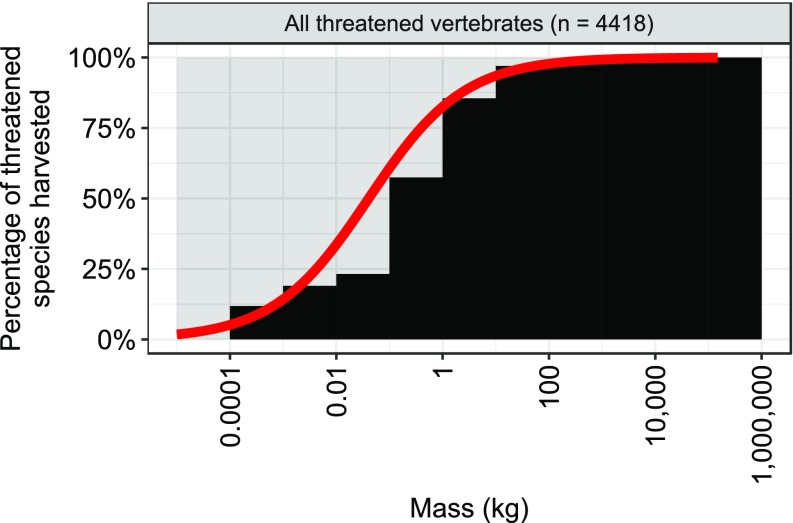
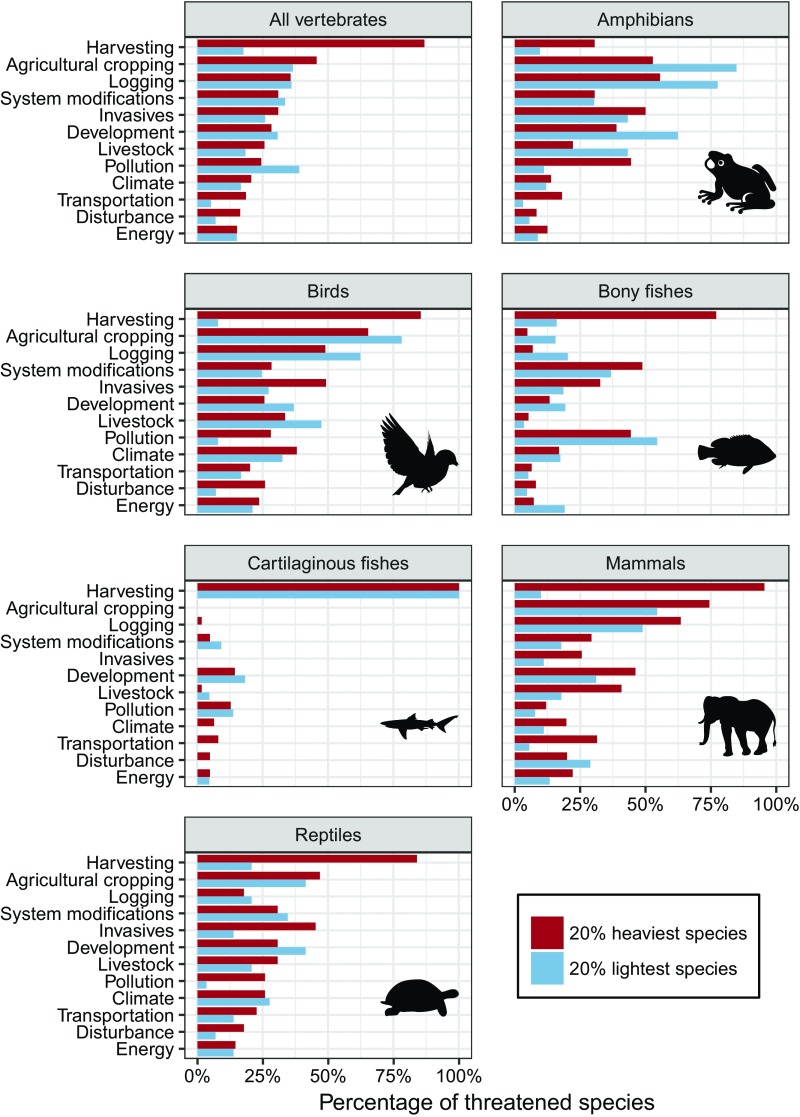
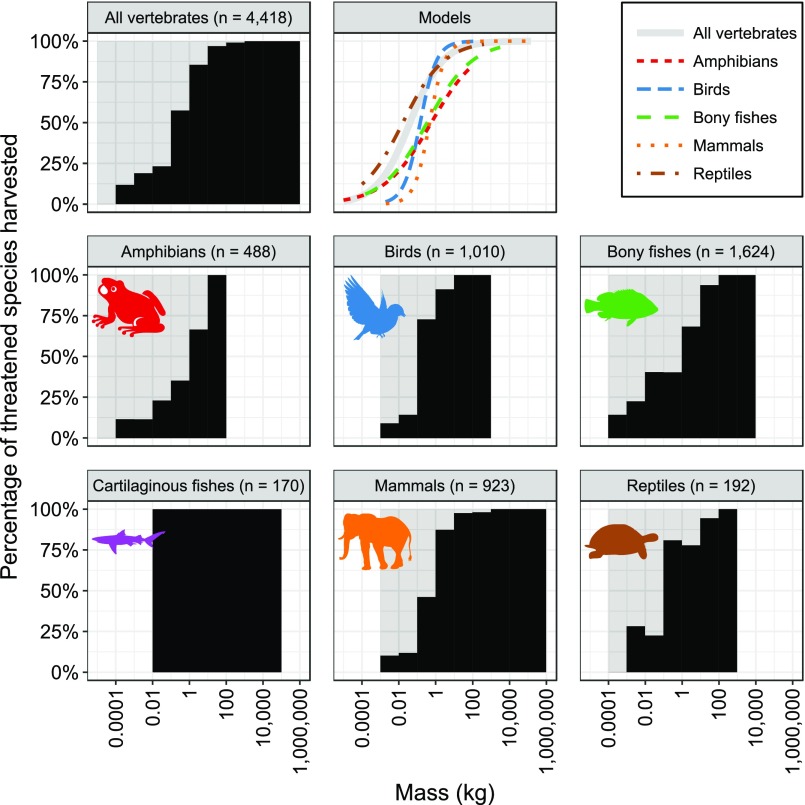
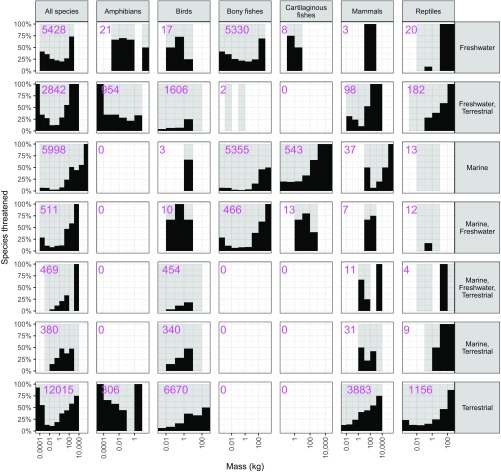
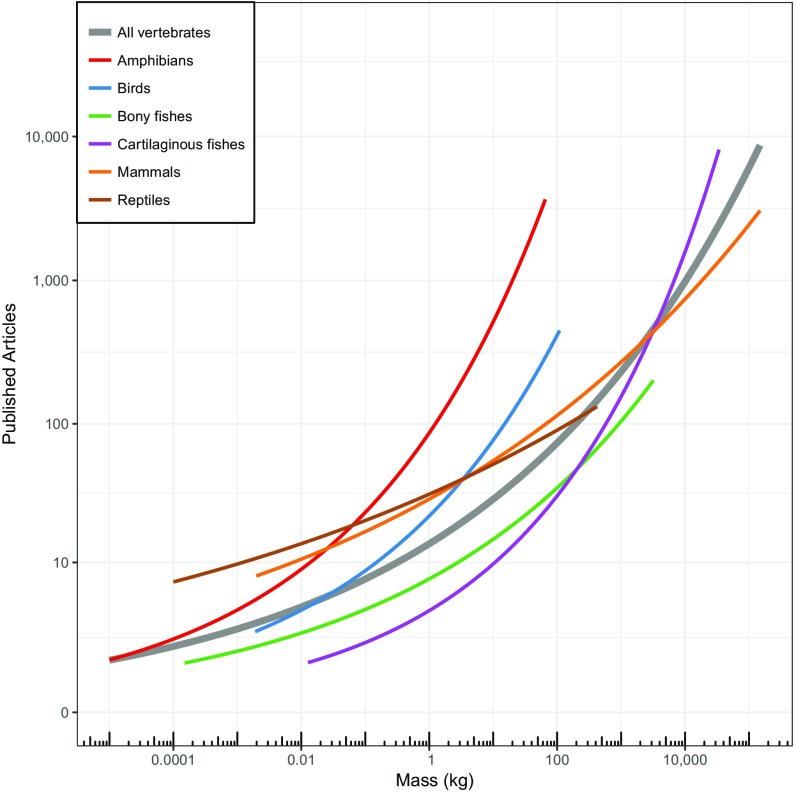
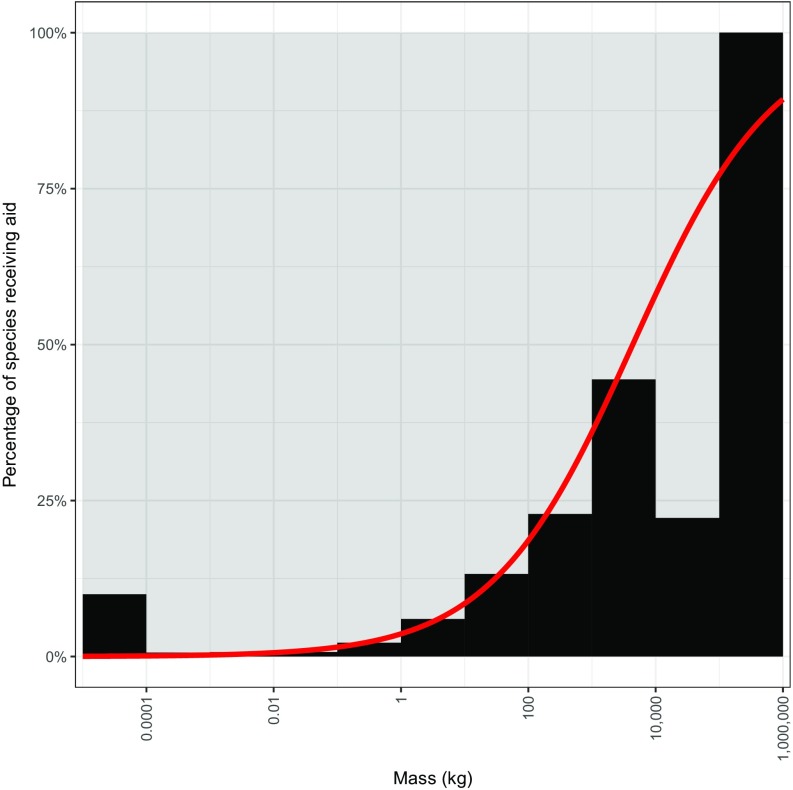
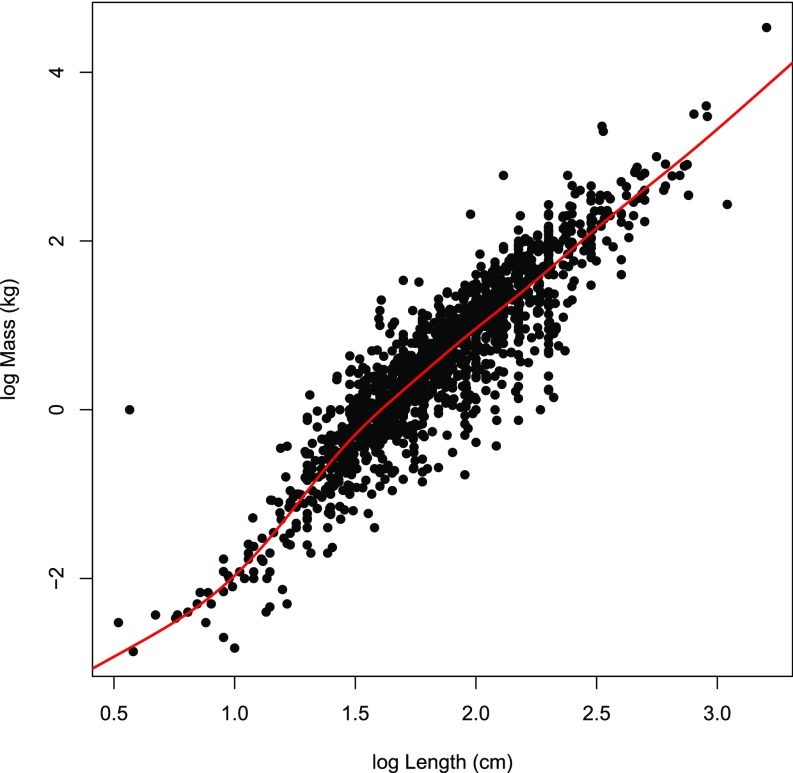
Extinction risk in vertebrates has been linked to large body size, but this putative relationship has only been explored for select taxa, with variable results. Using a newly assembled and taxonomically expansive database, we analyzed the relationships between extinction risk and body mass (27,647 species) and between extinction risk and range size (21,294 species) for vertebrates across six main classes. We found that the probability of being threatened was positively and significantly related to body mass for birds, cartilaginous fishes, and mammals. Bimodal relationships were evident for amphibians, reptiles, and bony fishes. Most importantly, a bimodal relationship was found across all vertebrates such that extinction risk changes around a body mass breakpoint of 0.035 kg, indicating that the lightest and heaviest vertebrates have elevated extinction risk. We also found range size to be an important predictor of the probability of being threatened, with strong negative relationships across nearly all taxa. A review of the drivers of extinction risk revealed that the heaviest vertebrates are most threatened by direct killing by humans. By contrast, the lightest vertebrates are most threatened by habitat loss and modification stemming especially from pollution, agricultural cropping, and logging. Our results offer insight into halting the ongoing wave of vertebrate extinctions by revealing the vulnerability of large and small taxa, and identifying size-specific threats. Moreover, they indicate that, without intervention, anthropogenic activities will soon precipitate a double truncation of the size distribution of the world's vertebrates, fundamentally reordering the structure of life on our planet.

Keywords: biodiversity; body mass; exploitation; extinction; habitat.


Conflict of interest statement

The authors declare no conflict of interest.

Figures

Fig. 1.
Fig. 1.
Relationships between vertebrate body mass and percentage of species threatened (black histograms) and between mass and probability of being threatened (“Models” graph). Lines in the Models graph indicate the predicted probabilities of being threatened as a function of body mass based on logistic regression models with taxonomic random effects to account for phylogenetic dependence. Segmented models were fitted for all vertebrates, amphibians/reptiles, and bony fishes as these taxa have different (bimodal) body mass–extinction risk relationships at low and high body masses.
Fig. 2.
Fig. 2.
Effects of range size on the percentage of species threatened. (A) Percentage of species (y axis) within each range size group and mass range (log scale, e.g., 1–10 kg) that are threatened. Only species with IUCN range maps available were used in this plot (totals are shown in panel titles). The relative positions of the lines indicate that range size has a major effect on threatened status regardless of mass. Small range species are generally more threatened than those with large ranges. (B) Relationships between vertebrate geographic range size and percentage of species threatened (black histogram) and between range size and probability of being threatened (red line). The red line indicates the predicted probability of being threatened as a function of range size on a logistic regression model with taxonomic random effects to account for phylogenetic dependence. This result shows that there is a strong negative relationship between range size and probability of being threatened.
Fig. S1.
Fig. S1.
For all major classes, percentage of species (y axis) within each range size group and mass range (log scale, e.g., 1–10 kg) that are threatened. Only species with IUCN range maps available were used in this plot (totals are shown in panel titles). The relative positions of the lines indicate that range size has a major effect on threatened status regardless of mass. Small range species are generally more threatened than those with large ranges.
Fig. S2.
Fig. S2.
For all major classes, relationships between vertebrate geographic range size and probability of being threatened. Lines in the “Models” graph indicate the predicted probabilities of being threatened as a function of range size based on logistic regression models using taxonomic random effects to account for phylogenetic dependence. These results show that there is a strong negative relationship between range size and probability of being threatened for all taxa except cartilaginous fishes.
Fig. 3.
Fig. 3.
Relationships between body mass and percentage of threatened species harvested (black histogram) and between mass and probability of being harvested for threatened vertebrates (red line). The red line indicates the predicted probability of threatened species being harvested (killed by humans) as a function of body mass based on a logistic regression model using taxonomic random effects to account for phylogenetic dependence. Species total (n) corresponds to number of threatened species only.
Fig. 4.
Fig. 4.
Threats to threatened vertebrate species in the top 20% and bottom 20% percentiles for mass within their class. Threats are based on the IUCN Red List threats classification scheme with minor modifications (Methods for details). Within each group, the percentage of threatened species facing each threat is shown for the top 20% heaviest species (red) and 20% lightest (blue) separately. Threats are sorted by the percentage of the heaviest threatened vertebrates (classes pooled) facing each threat. For the all vertebrates grouping (Top Left graph), the lightest 20% of species were all less than 0.0079 kg and the heaviest 20% species were all more than 0.56 kg in body mass.
Fig. S3.
Fig. S3.
Relationships between body mass and probability of being harvested for threatened species in each of the six classes and all vertebrates. Raw data are shown as black histograms. Lines in the “Models” panel indicate the predicted probabilities of threatened species being harvested (killed by humans) as a function of body mass based on logistic regression models using taxonomic random effects to account for phylogenetic dependence. No model was fit for cartilaginous fishes because all threatened species were harvested for this class; however, data for cartilaginous fishes were included in the all vertebrates model. Species totals (n) correspond to number of threatened species only.
Fig. S4.
Fig. S4.
Histograms showing percentages of species threatened versus body mass. Species are grouped by class (along with all vertebrates together) and types of ecosystem used. Ecosystem type data were obtained from the IUCN Red List. Note that some species may use multiple ecosystem types (e.g., terrestrial and freshwater or marine and freshwater). Numbers of species corresponding to each group and ecosystem type are shown in the panels.
Fig. S5.
Fig. S5.
Research effort versus mass for the classes in our analysis. Research effort is measured using number of published articles (1965–2016) for each of the 27,647 species in our analysis. The searches were done in Thomson Reuter’s Web of Science and included taxonomic synonyms as listed on IUCN Red List fact sheets. The lines show negative binomial regression fitted models for each class separately and “all vertebrates” together.
Fig. S6.
Fig. S6.
Percentages of species receiving financial aid (n = 556 receiving aid). The black histogram (logistic regression fitted model shown in red) indicates a positive association between body mass and the likelihood of receiving aid. Note that the true relationship may differ slightly as some species share common names and some common names may be used in other contexts.
Fig. S7.
Fig. S7.
Relationship between body mass and maximum length (log scale) for fish using data from FishBase. We used a generalized additive model (fitted relationship shown in red; adjusted R2 = 0.825, n = 1734) to predict species body masses from maximum lengths for species with known lengths and unknown masses.

Comment in

References

    1. Ripple WJ, et al. Saving the world’s terrestrial megafauna. Bioscience. 2016;66:807–812. - PMC - PubMed
    1. Barnosky AD, et al. Has the Earth’s sixth mass extinction already arrived? Nature. 2011;471:51–57. - PubMed
    1. Pimm SL, et al. The biodiversity of species and their rates of extinction, distribution, and protection. Science. 2014;344:1246752. - PubMed
    1. Ceballos G, et al. Accelerated modern human-induced species losses: Entering the sixth mass extinction. Sci Adv. 2015;1:e1400253. - PMC - PubMed
    1. McCauley DJ, et al. Marine defaunation: Animal loss in the global ocean. Science. 2015;347:1255641. - PubMed