. 2017 Oct 3;114(40):10636-10641.
doi: 10.1073/pnas.1707506114. Epub 2017 Sep 18.

Near-atomic structure of jasplakinolide-stabilized malaria parasite F-actin reveals the structural basis of filament instability

Affiliations

Near-atomic structure of jasplakinolide-stabilized malaria parasite F-actin reveals the structural basis of filament instability

Sabrina Pospich et al. Proc Natl Acad Sci U S A. .

Abstract

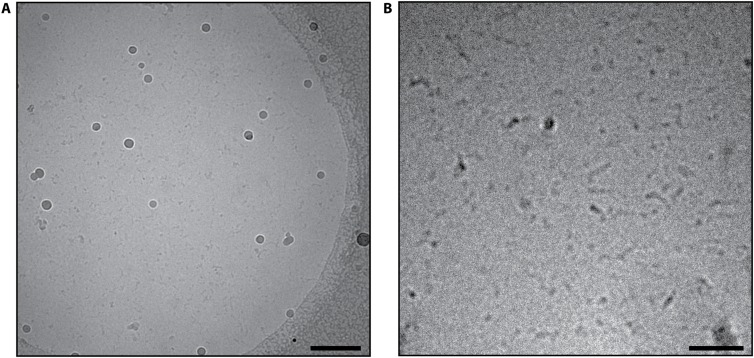
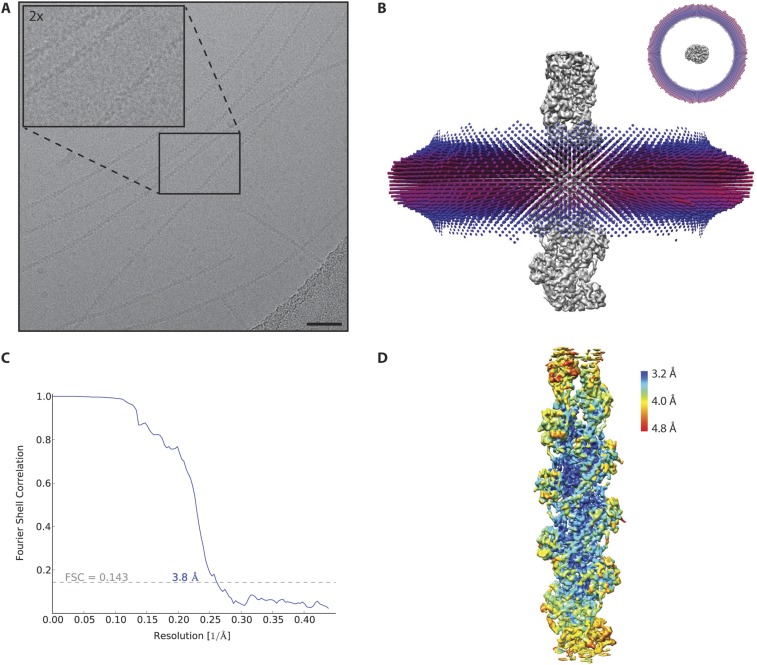
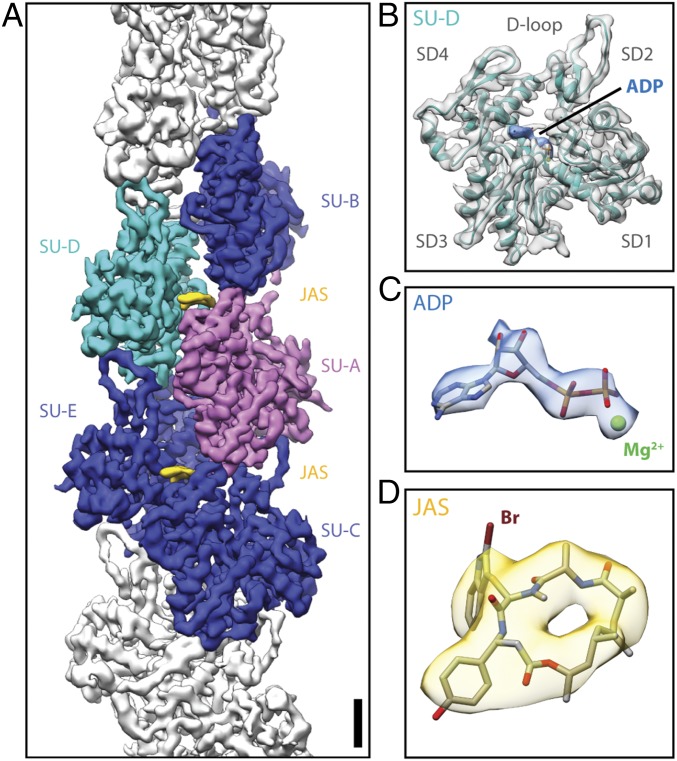
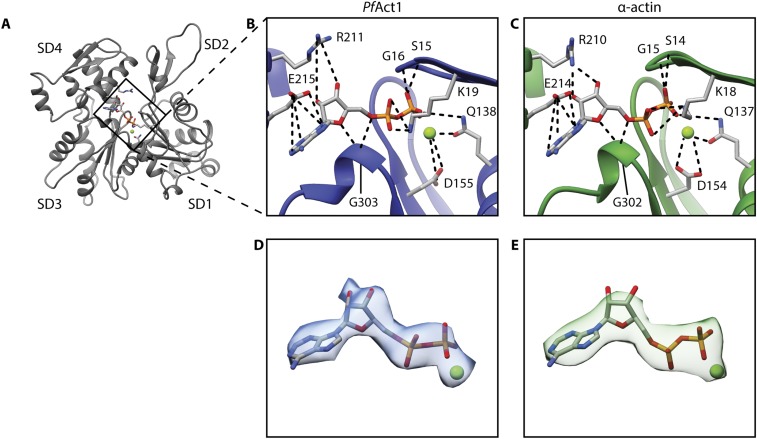
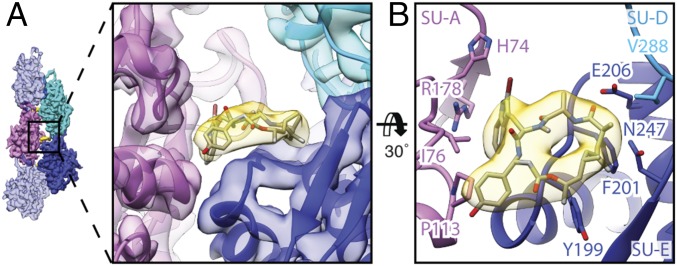
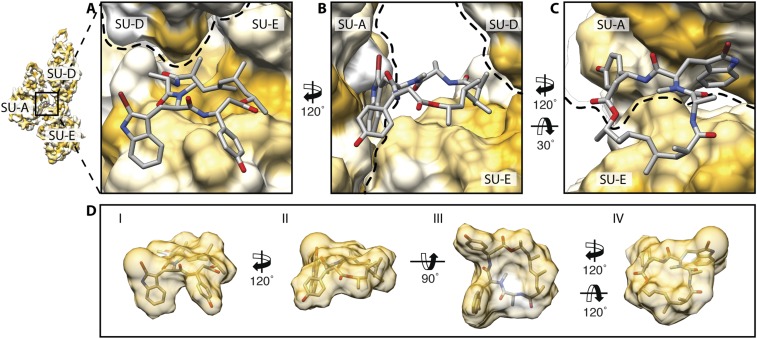
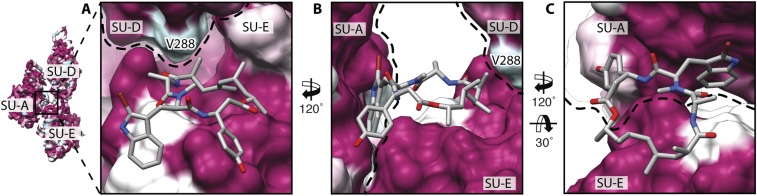
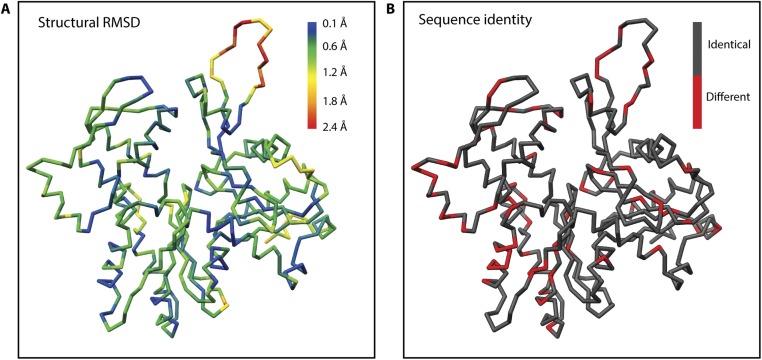
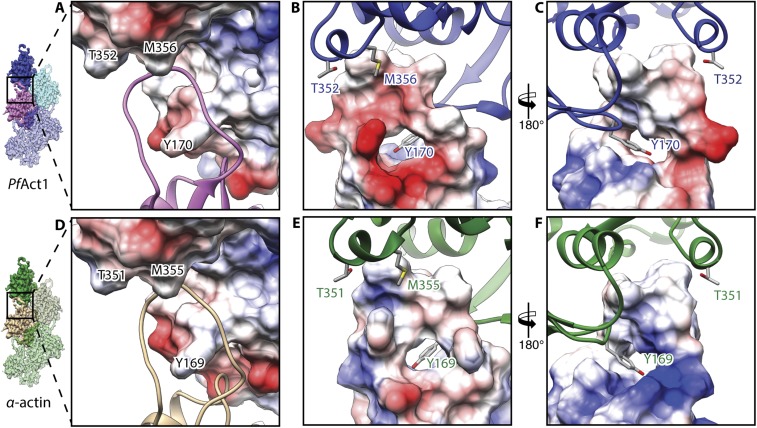
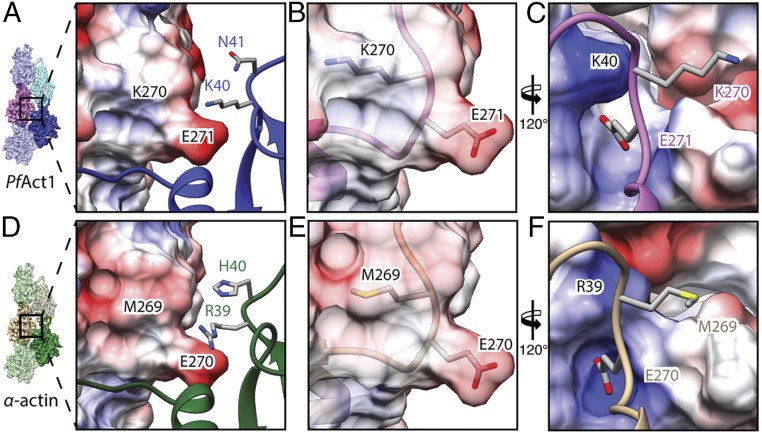
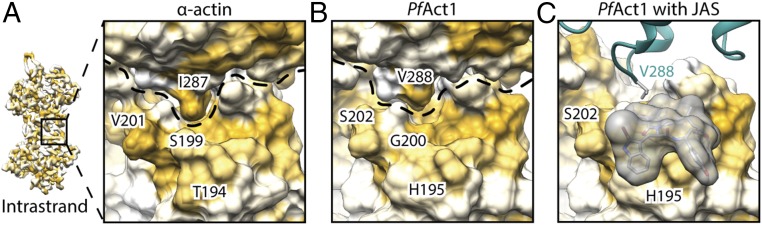
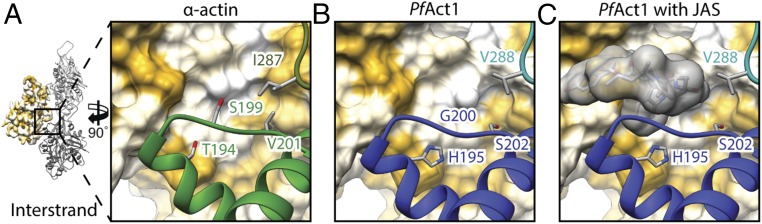
During their life cycle, apicomplexan parasites, such as the malaria parasite Plasmodium falciparum, use actomyosin-driven gliding motility to move and invade host cells. For this process, actin filament length and stability are temporally and spatially controlled. In contrast to canonical actin, P. falciparum actin 1 (PfAct1) does not readily polymerize into long, stable filaments. The structural basis of filament instability, which plays a pivotal role in host cell invasion, and thus infectivity, is poorly understood, largely because high-resolution structures of PfAct1 filaments were missing. Here, we report the near-atomic structure of jasplakinolide (JAS)-stabilized PfAct1 filaments determined by electron cryomicroscopy. The general filament architecture is similar to that of mammalian F-actin. The high resolution of the structure allowed us to identify small but important differences at inter- and intrastrand contact sites, explaining the inherent instability of apicomplexan actin filaments. JAS binds at regular intervals inside the filament to three adjacent actin subunits, reinforcing filament stability by hydrophobic interactions. Our study reveals the high-resolution structure of a small molecule bound to F-actin, highlighting the potential of electron cryomicroscopy for structure-based drug design. Furthermore, our work serves as a strong foundation for understanding the structural design and evolution of actin filaments and their function in motility and host cell invasion of apicomplexan parasites.

Keywords: F-actin; Plasmodium; cryo-EM; jasplakinolide; malaria.


Conflict of interest statement

The authors declare no conflict of interest.

Figures

Fig. S1.
Fig. S1.
Inhomogeneity of nonstabilized PfAct1 filaments does not allow structural analysis by cryo-EM. (A) Representative cryo-EM micrograph of filamentous PfAct1 in the absence of JAS. The image was bandpass-filtered to enhance the contrast. (Scale bar, 250 nm.) (B) Contrast-enhanced close-up view showing short irregular filament-like assemblies. (Scale bar, 100 nm.)
Fig. S2.
Fig. S2.
Cryo-EM refinement and resolution of PfAct1. (A) Representative digital micrograph at −2.4-μm defocus. (Scale bar, 50 nm.) (B) Side and top view (Inset) of the final angular distribution after 3D refinement (SI Materials and Methods). (C) FSC curve between maps from two independently refined half-datasets. The FSC0.143 criterion indicates an average resolution of 3.8 Å. (D) Color-coded local resolution estimated by SPHIRE (54). Note that the resolution drops gradually toward the ends of the filament.
Fig. 1.
Fig. 1.
Structure of JAS-stabilized PfAct1 filament. (A) Cryo-EM reconstruction of PfAct1 (gray, with five central subunits in blue, cyan, and magenta) stabilized by JAS (yellow). (B) Side view of subunit D (density: gray, atomic model: cyan) with bound ADP (blue) illustrating the SD organization of actin. A close-up view of ADP-Mg2+ (C) and a slightly tilted top view of JAS (D) are shown with respective densities. (Scale bar, 1.5 nm.)
Fig. S3.
Fig. S3.
Comparison of the nucleotide-binding site of filamentous PfAct1 and α-actin. (A) Overview of one subunit of filamentous PfAct1. Coordination of ADP-Mg2+ in the nucleotide-binding pocket of PfAct1 (B, blue) and α-actin (C, green) [PDB accession code 5JLF (32)]. Interactions are highlighted by dashed lines. Close-up view of the density map of ADP-Mg2+ from PfAct1 (D) and α-actin (E) [EMDB accession code 8162 (32)].
Fig. 2.
Fig. 2.
Structurally deviating D-loop in PfAct1. (A) Backbone of the central subunit colored by the root mean square deviation (RMSD) between PfAct1 and α-actin [PDB ID code 5JLF (32)], illustrating a significant deviation within the D-loop. (B) Superimposed electron density maps of PfAct1 (gray) and α-actin (yellow) [EMDB accession code 8162 (32)]. (C) Backbone of corresponding atomic models in blue and green, respectively [α-actin: PDB accession code 5JLF (32)]. The observed differences within the D-loop originate most likely from P42 in PfAct1 at the position of Q41 in α-actin that introduces a kink.
Fig. S4.
Fig. S4.
Interstrand and intrastrand interactions. (A) Interaction of the plug with two neighboring subunits. The central actin subunit is depicted in magenta, and adjacent ones are depicted in blue and cyan. Main interactions between subunits are highlighted by dotted lines. (B) Same view as in A showing the surface of the central subunit colored by electrostatic Coulomb potentials ranging from −10 kcal⋅mol−1 (red) to +10 kcal⋅mol−1 (blue). Front (C) and side (D) views of the D-loop interacting with the adjacent intrastrand subunit are shown. Models and surfaces are colored from high (yellow) to low (white) hydrophobicity.
Fig. S5.
Fig. S5.
Additional hydrophobic intra- and interstrand contact sites. (A) In PfAct1 V288 in SD3 of the upper subunits insets into a hydrophobic groove in SD4 of the lower intrastrand subunit, resembling a lock-and-key interaction. (B) Hydrophobic residues in SD4 interact with SD1 of the opposing subunit, mediating the interstrand contact. Surfaces are colored from high (yellow) to low (white) hydrophobicity.
Fig. S6.
Fig. S6.
G- to F-actin transition of PfAct1. Front (A) and side (B) views of an atomic model of globular α-actin illustrate the SD organization of actin [PDB ID code 1J6Z (63)]. (C) Taking globular α-actin as a reference, SD1 and SD2 of globular PfAct1 are rotated by ∼7° relative to SD3 and SD4 [PDB ID code 4CBU (19)]. (D) Additional rotation of ∼11.5° of SD1 and SD2 upon polymerization further flattens the monomer. Note that the rotation of SD1 and SD2 of filamentous PfAct1 relative to globular α-actin is ∼18.5° in contrast to the 20° reported for filamentous α-actin (6, 7). In all subfigures, SD1 and SD2 are depicted in red and SD3 and SD4 are depicted in blue, respectively.
Fig. 3.
Fig. 3.
Interaction of JAS with PfAct1. (A) JAS (yellow) binds noncovalently to three actin subunits (magenta, blue, and cyan) strengthening both interstrand and intrastrand contacts. (B) Tilted top view of JAS and amino acids involved in the interaction.
Fig. S7.
Fig. S7.
Hydrophobic JAS-binding site. Side (A and B) and tilted top (C) views of the hydrophobic JAS-binding site formed by three actin subunits. (D) Same views as in AC (I, II, and IV) and an additional bottom view (III) of JAS illustrating the hydrophobic nature of the molecule. Surfaces are colored from high (yellow) to low (white) hydrophobicity. Dashed lines indicate boundaries of actin subunits.
Fig. S8.
Fig. S8.
Conservation of the hydrophobic JAS-binding site. (AC) Same views of the JAS-binding site as in Fig. S7 AC. Surfaces are colored by conservation based on a sequence alignment of actins from different species (SI Materials and Methods) from 100% (purple) to 30% (turquois). Labeled residues correspond to PfAct1. Note that the prominent hydrophobic patches of the JAS-binding site are conserved. Dashed lines indicate boundaries of actin subunits.
Fig. S9.
Fig. S9.
Structural and sequence comparison of PfAct1 and α-actin. (A) Backbone of the central subunit colored by the RMSD between PfAct1 and α-actin. The position of the D-loop deviates significantly. (B) Color-coded sequence alignment illustrating the relatively low sequence identity of PfAct1 and α-actin [α-actin: PDB accession code 5JLF (32)].
Fig. S10.
Fig. S10.
Altered charge in the D-loop region of PfAct1. The intrastrand contact of PfAct1 (AC) and α-actin [PDB accession code 5JLF (32)] (DF) is primarily mediated by the D-loop. (A and D) The main key-and-lock interaction, which is based on hydrophobic interactions, is found in both filaments (also Fig. 4). (B, C, E, and F) Surface charges of the D-loop differ between PfAct1 and canonical F-actin. Actin is depicted as a surface colored by electrostatic Coulomb potential, ranging from −10 kcal⋅mol−1 (red) to +10 kcal⋅mol−1 (blue), or as a ribbon in the color of the respective subunit.
Fig. 4.
Fig. 4.
Weaker interaction of the plug in PfAct1. Comparison of the plug region of PfAct1 (AC) and α-actin (DF) [PDB accession code 5JLF (32)]. (DF) Electrostatic interactions involving R39, H40, and M269 stabilize the interstrand contact of α-actin. (AC) Substitution of these residues to lysine, asparagine, and lysine, respectively, weakens this interface in PfAct1. Actin is depicted as surface colored by electrostatic Coulomb potential ranging from −10 kcal⋅mol−1 (red) to +10 kcal⋅mol−1 (blue) or as a ribbon in the color of the respective subunit.
Fig. 5.
Fig. 5.
Destabilized intrastrand contact near JAS-binding site in PfAct1. (A) In α-actin, I287 insets into a groove of the adjacent intrastrand subunit resembling a lock-and-key interaction. (B) In PfAct1, isoleucine is replaced by valine, resulting in a weaker intrastrand interaction. (C) JAS (gray) binds close to this intrastrand contact, reinforcing the interface. Surfaces are colored from high (yellow) to low (white) hydrophobicity. Dashed lines indicate boundaries of actin subunits.
Fig. 6.
Fig. 6.
Destabilized interstrand contact near JAS-binding site in PfAct1. (A) Interstrand contact of α-actin is mediated by the hydrophobic residues V201 and T194 (Fig. 5A). (B) Hydrophobicity is reduced in PfAct1 due to substitutions to serine and histidine, respectively, resulting in a destabilized interface (Fig. 5B). (C) JAS (gray) binds at this interface and strengthens the interstrand contact. Surfaces are colored from high (yellow) to low (white) hydrophobicity, and ribbons are depicted in the color of the respective subunit.
Fig. S11.
Fig. S11.
Change of free energy, ΔΔG, at important interfaces due to in silico alanine mutations. Comparison of ΔΔG of PfAct1 (AC) and α-actin (DF) [PDB accession code 5JLF (32)]. The interactions at the plug region as well as at the intrastrand contact near the JAS-binding site are weaker in PfAct1 (A and B) than in α-actin (D and E). The D-loop interface of PfAct1 (C) closely resembles the one of α-actin (F). Ribbons are depicted transparently in the color of the respective subunit. (G) Table summarizing the change of ΔΔG in kcal⋅mol−1. Residues are grouped by interface. Side chains are colored by ΔΔG, ranging from 0 kcal⋅mol−1 (white), to 2 kcal⋅mol−1 (red), to +3.8 kcal⋅mol−1 (wine red). Positive values correspond to an increase in free energy, and negative values arise from repelling interactions.

Similar articles

Cited by

References

    1. Pollard TD. Actin and actin-binding proteins. Cold Spring Harb Perspect Biol. 2016 doi: 10.1101/cshperspect.a018226. - DOI - PMC - PubMed
    1. Straub FB. Actin. Stud Inst Med Chem Univ Szeged. 1942;II:3–15.
    1. Kabsch W, Mannherz HG, Suck D, Pai EF, Holmes KC. Atomic structure of the actin: DNase I complex. Nature. 1990;347:37–44. - PubMed
    1. Holmes KC, Popp D, Gebhard W, Kabsch W. Atomic model of the actin filament. Nature. 1990;347:44–49. - PubMed
    1. Fujii T, Iwane AH, Yanagida T, Namba K. Direct visualization of secondary structures of F-actin by electron cryomicroscopy. Nature. 2010;467:724–728. - PubMed

Publication types

MeSH terms

Associated data

LinkOut - more resources