. 2017 Oct 3;114(40):E8518-E8527.
doi: 10.1073/pnas.1710708114. Epub 2017 Sep 18.

Exceptionally tight membrane-binding may explain the key role of the synaptotagmin-7 C2A domain in asynchronous neurotransmitter release

Affiliations

Exceptionally tight membrane-binding may explain the key role of the synaptotagmin-7 C2A domain in asynchronous neurotransmitter release

Rashmi Voleti et al. Proc Natl Acad Sci U S A. .

Abstract

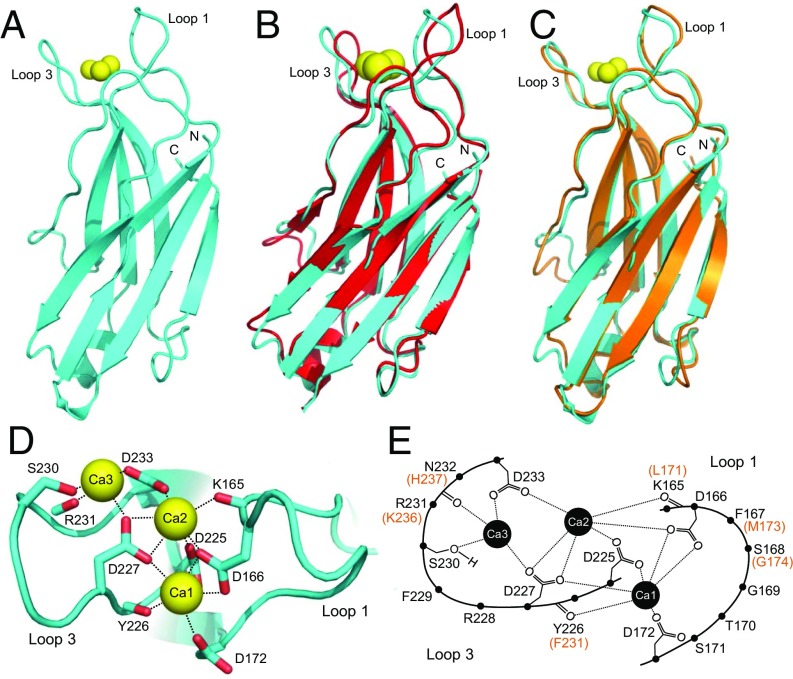
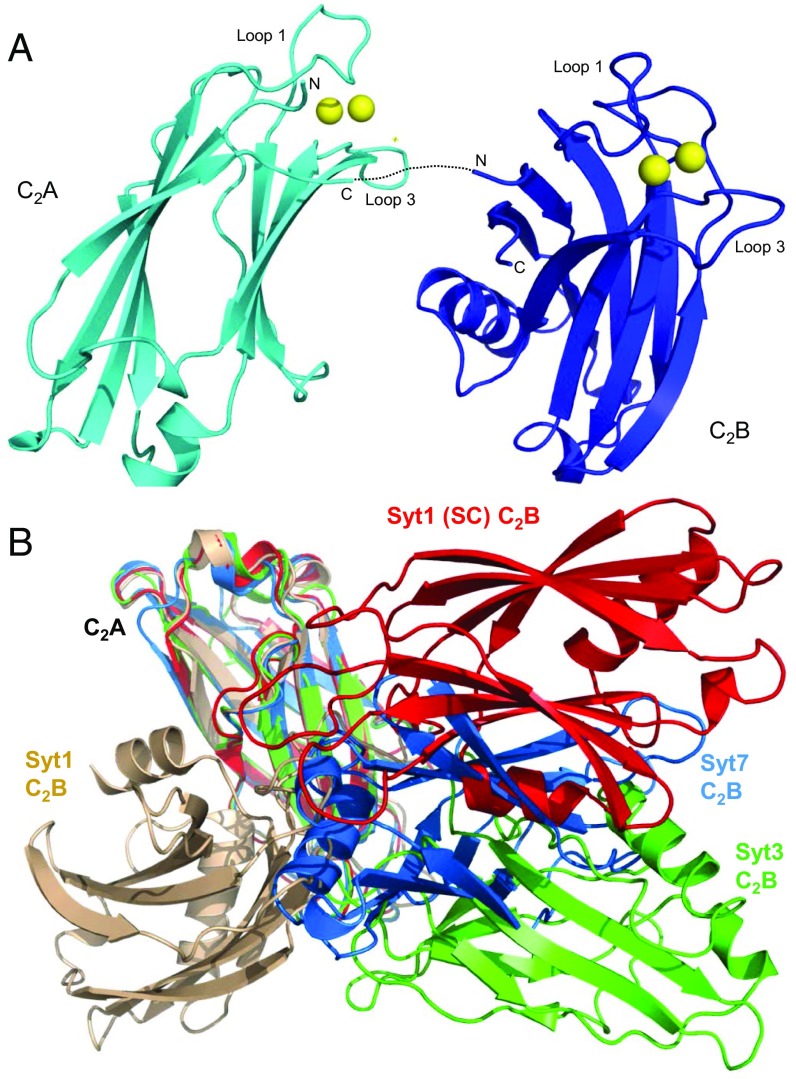
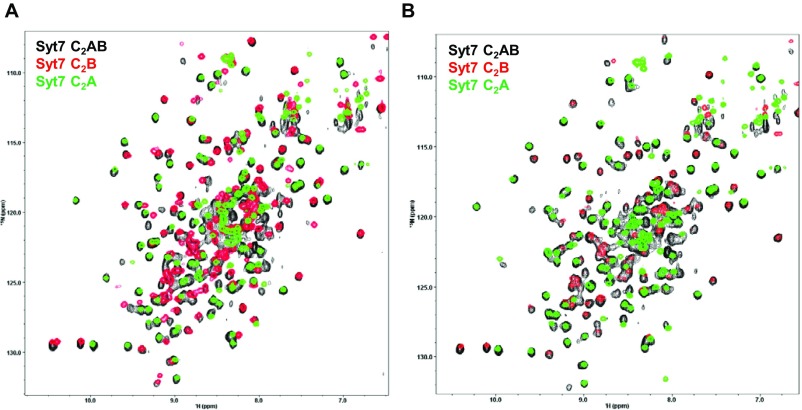
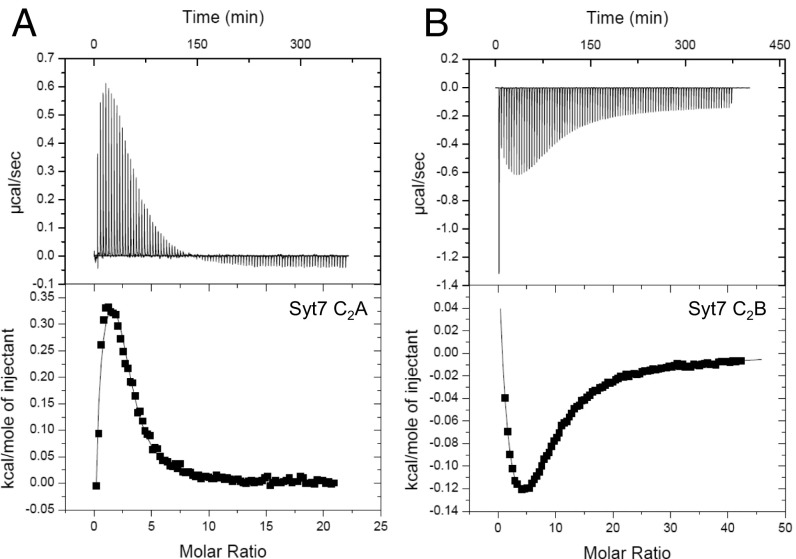
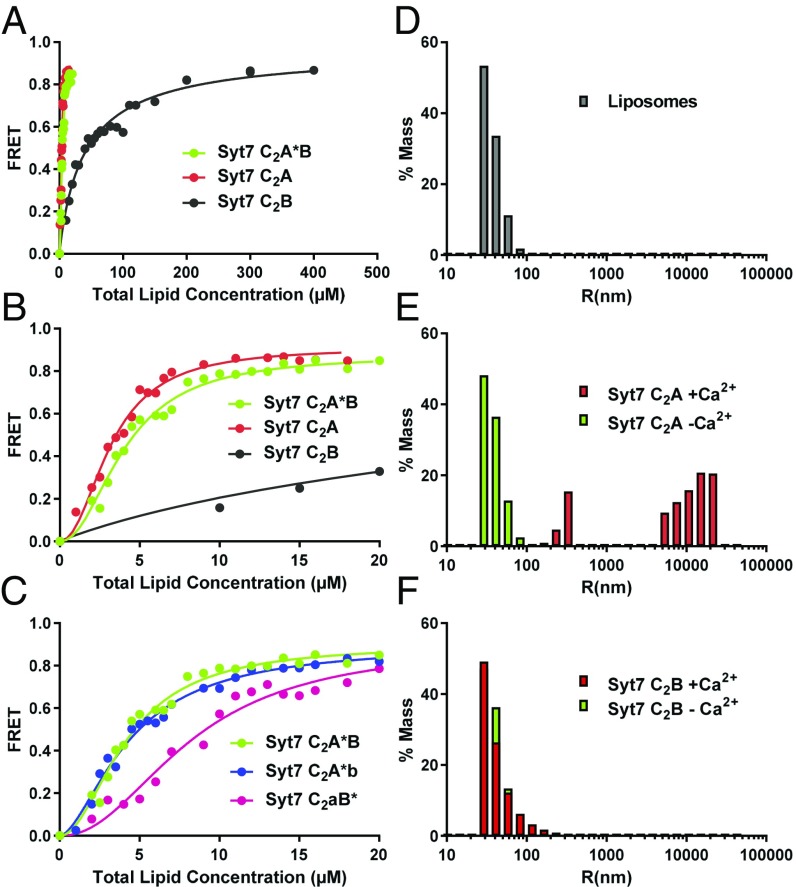
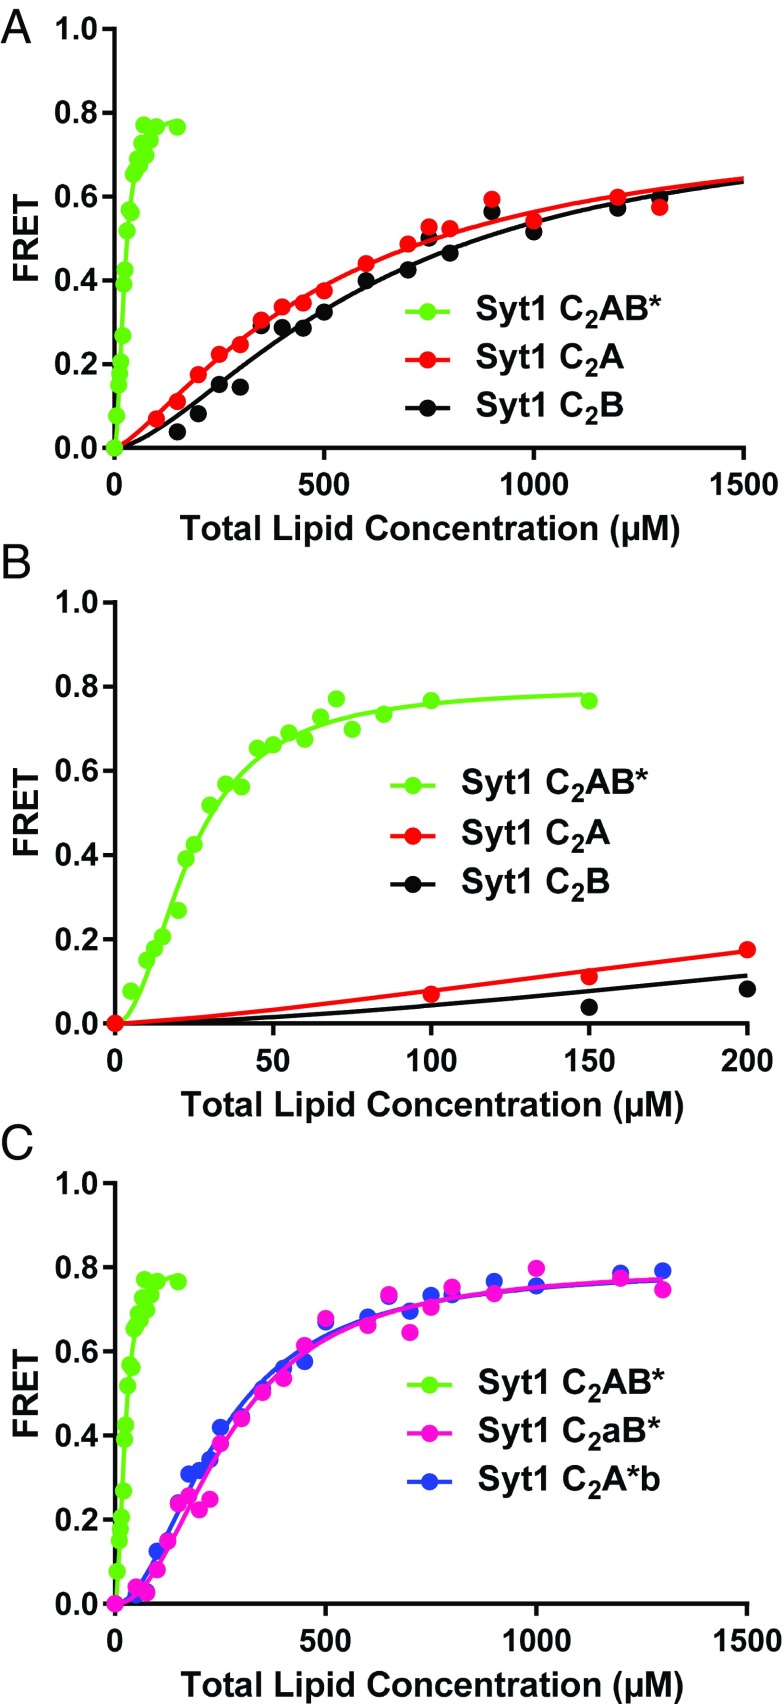
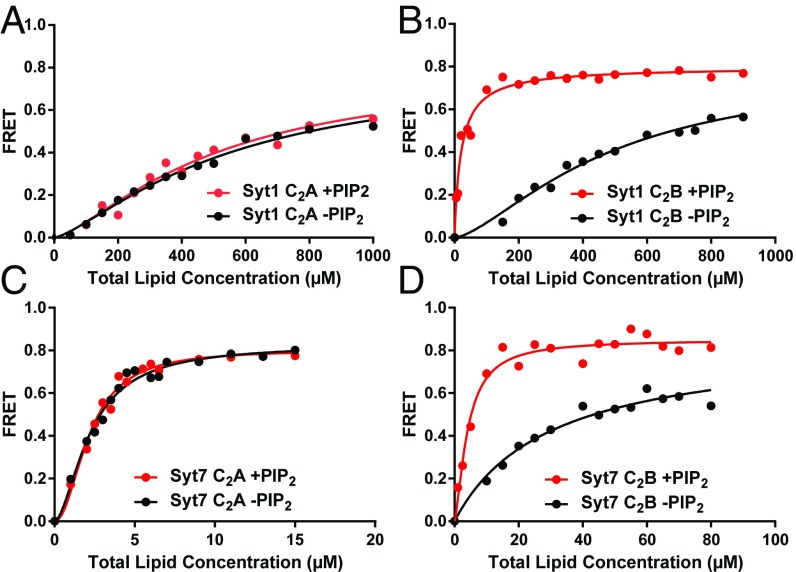
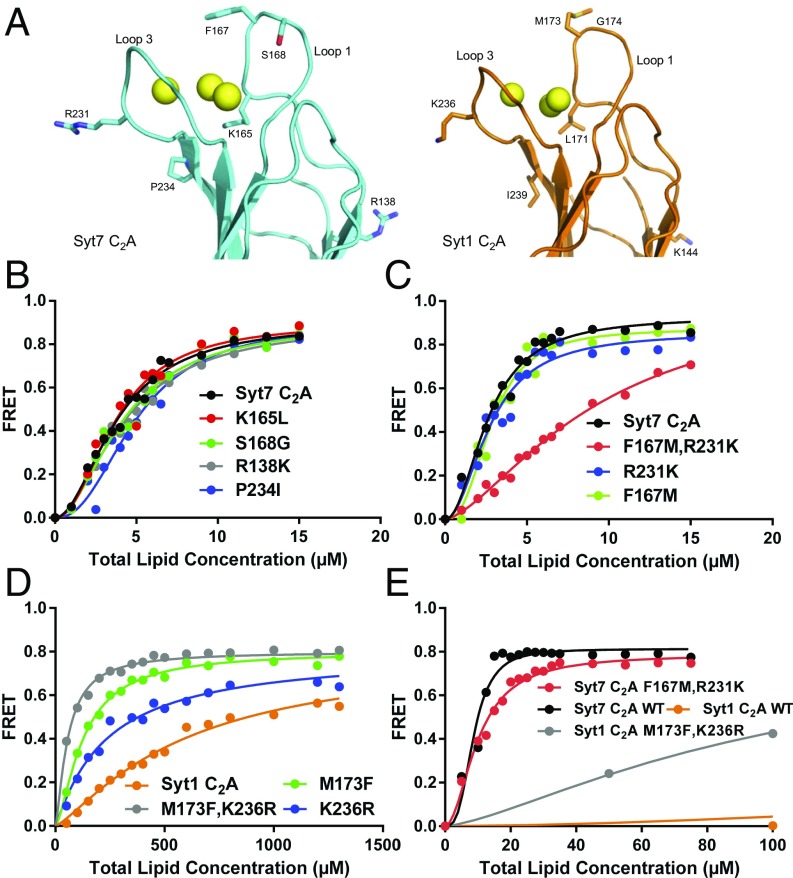
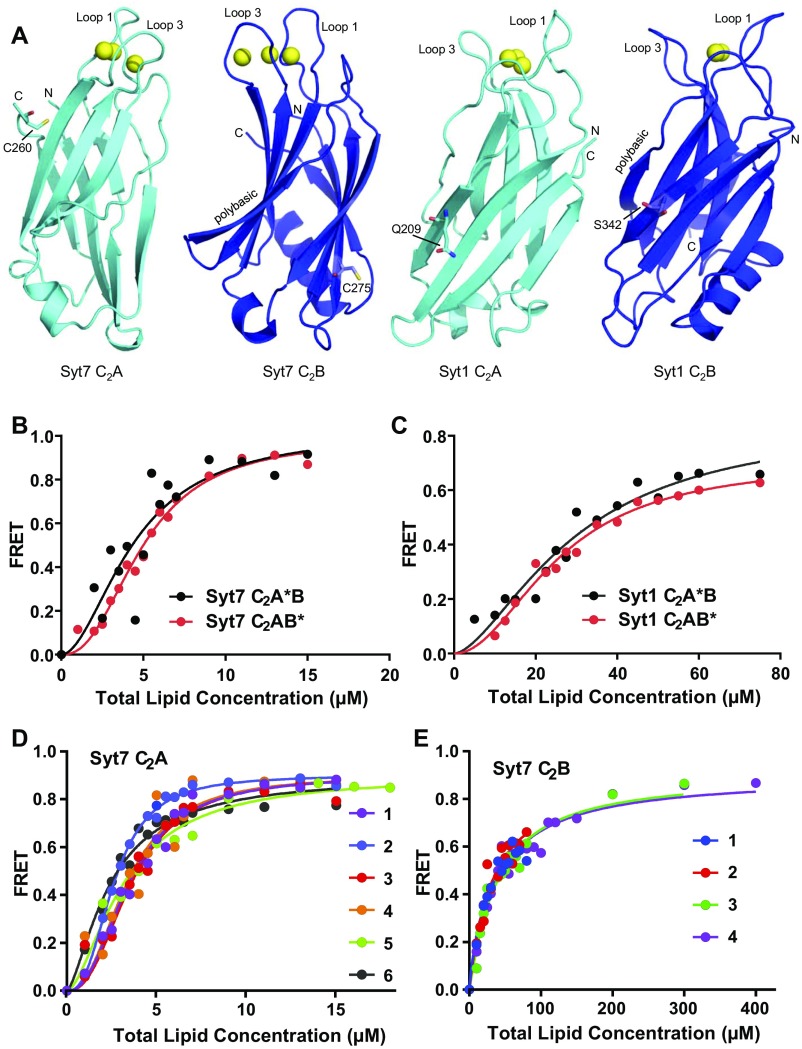
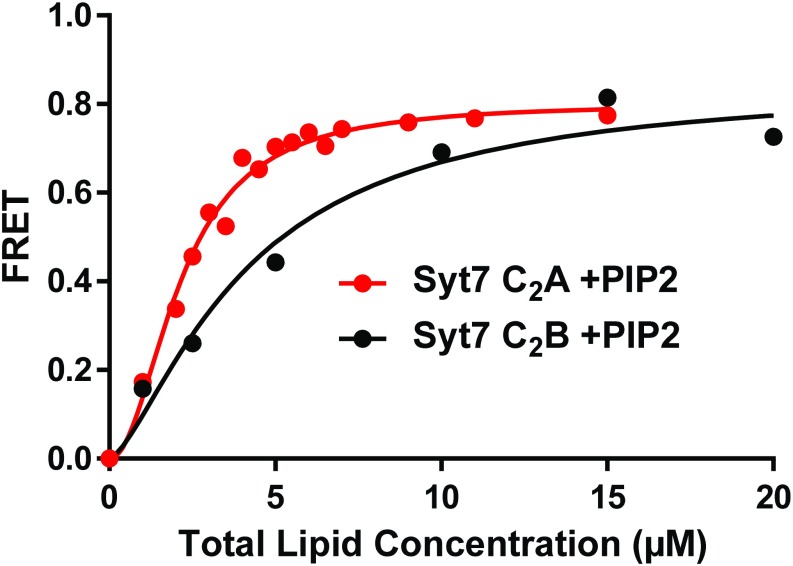
Synaptotagmins (Syts) act as Ca2+ sensors in neurotransmitter release by virtue of Ca2+-binding to their two C2 domains, but their mechanisms of action remain unclear. Puzzlingly, Ca2+-binding to the C2B domain appears to dominate Syt1 function in synchronous release, whereas Ca2+-binding to the C2A domain mediates Syt7 function in asynchronous release. Here we show that crystal structures of the Syt7 C2A domain and C2AB region, and analyses of intrinsic Ca2+-binding to the Syt7 C2 domains using isothermal titration calorimetry, did not reveal major differences that could explain functional differentiation between Syt7 and Syt1. However, using liposome titrations under Ca2+ saturating conditions, we show that the Syt7 C2A domain has a very high membrane affinity and dominates phospholipid binding to Syt7 in the presence or absence of l-α-phosphatidylinositol 4,5-diphosphate (PIP2). For Syt1, the two Ca2+-saturated C2 domains have similar affinities for membranes lacking PIP2, but the C2B domain dominates binding to PIP2-containing membranes. Mutagenesis revealed that the dramatic differences in membrane affinity between the Syt1 and Syt7 C2A domains arise in part from apparently conservative residue substitutions, showing how striking biochemical and functional differences can result from the cumulative effects of subtle residue substitutions. Viewed together, our results suggest that membrane affinity may be a key determinant of the functions of Syt C2 domains in neurotransmitter release.

Keywords: X-ray crystallography; membrane binding; neurotransmitter release; synaptotagmin-1; synaptotagmin-7.


Conflict of interest statement

The authors declare no conflict of interest.

Figures

Fig. 1.
Fig. 1.
Crystal structure of the Ca2+-bound Syt7 C2A domain. (A) Ribbon diagram of the crystal structure of the Ca2+-bound Syt7 C2A domain. The three bound Ca2+ ions are shown as yellow spheres. The two loops involved in Ca2+ binding are indicated (loop 1 and loop 3), and the N and C termini are labeled N and C, respectively. (B) Superposition of the crystal structure of the Ca2+-bound Syt7 C2A domain (cyan) with the solution structure of Ca2+-free Syt7 C2A domain (red) (PDB ID code 2D8K). (C) Superposition of the crystal structure of the Ca2+-bound Syt7 C2A domain (cyan) with the solution structure of Ca2+-bound Syt1 C2A domain (orange) (PDB ID code 1BYN). (D) Diagram illustrating the Ca2+-binding sites of the Syt7 C2A domain. The three bound Ca2+ ions are labeled Ca1, Ca2, and Ca3. The Ca2+ ligands are shown as stick models and labeled. (E) Diagram of the Ca2+-binding sites of Syt7 C2A domain summarizing all of the residues in loops 1 and 3 (black letters). The residues that are different in the Syt1 C2A domain are indicated in parenthesis in red letters.
Fig. 2.
Fig. 2.
Crystal structure of the Ca2+-bound Syt7 C2AB fragment. (A) Ribbon diagram of the crystal structure of the Ca2+-bound Syt7 C2AB fragment, with the C2A domain in cyan and the C2B domain in blue. The bound Ca2+ ions are shown as yellow spheres. The loops involved in Ca2+ binding are indicated (loop 1 and loop 3), and the N and C termini of both domains are labeled N and C, respectively. The sequence linking the two C2 domains, for which there is insufficient electronic density to build the structure, is illustrated by a dotted line. (B) Superposition of the crystal structure of the Ca2+-bound Syt7 C2AB (cyan and blue) with the crystal structures of Ca2+-free Syt1 C2AB (wheat; PDB ID code 2R83), Syt1 C2AB bound to the SNARE complex (red; PDB ID code 5CCG) and Ca2+-free Syt3 C2AB (green; PDB ID code 1DQV). Only the C2A domain of each structure was used for the superposition to illustrate the diversity of relative orientations between the two C2 domains in these structures. The position of all of the C2A domains is indicated by C2A and those of the different C2B domains are also labeled; Syt1 (SC) C2B domain refers to Syt1 C2AB bound to the SNARE complex.
Fig. S1.
Fig. S1.
There are no stable interactions between the C2A and C2B domains of Syt7 in solution. Superpositions of 1H-15N HSQC spectra of the Syt7 C2AB fragment (black contours), the Syt7 C2A domain (green contours) or C2B domain (red contours) in the presence of 1 mM EDTA (A) or 2 mM Ca2+ (B).
Fig. 3.
Fig. 3.
ITC analysis of intrinsic Ca2+ binding to the Syt7 C2 domains. Illustrative ITC data obtained by titration of Ca2+ versus the isolated Syt7 C2A (A) or C2B (B) domain. The curves represent the fits of the data to a three- (A) or four- (B) sequential-binding-site model.
Fig. 4.
Fig. 4.
The Syt7 C2A domain dominates binding of Syt7 to membranes and clusters liposomes. (A) Titrations of 20 nM Syt7 C2A domain, C2B domain and C2A*B fragment (the * in C2A*B denotes that the fluorescent probe is attached to C260 of the C2A domain) with liposomes lacking PIP2 in the presence of 1 mM Ca2+. Binding was monitored from the FRET developed between a donor BODIPY-FL probe attached to the proteins and a rhodamine acceptor present in the liposomes. Each point represents the average of at least three measurements performed with different liposome preparations. (B) The same titrations shown in A but changing the x axis to better show the points of the titrations obtained at low liposome concentrations. (C) Liposome titrations of 20 nM WT Syt7 C2AB fragment and mutant fragments where the Ca2+-binding sites of the C2A domain (C2aB*) or C2B domain (C2A*b) were disrupted with D225A,D227A,D233A or D357A,D359A mutations. All of the data in AC were fit to a Hill function. (D–F) Distribution of particle size measured by DLS on samples containing liposomes alone (D) or liposomes in the presence of the Syt7 C2A domain (E) or Syt7 C2B domain (F). In E and F, the diagrams show superpositions of data obtained in the absence (green bars) or presence (red bars) of Ca2+.
Fig. 5.
Fig. 5.
The Syt1 C2 domains have similar membrane affinities and cooperate in membrane binding. (A) Titrations of 100 nM Syt1 C2A domain, C2B domain and C2AB* fragment (the * in C2AB* denotes that the fluorescent probe is attached to the C2B domain) with liposomes lacking PIP2 in the presence of 1 mM Ca2+. Binding was monitored from the FRET developed between a donor BODIPY-FL probe attached to the proteins and a rhodamine acceptor present in the liposomes. Each point represents the average of at least three measurements performed with different liposome preparations. (B) The same titrations shown in A but changing the x axis to better show the points of the titrations obtained at low liposome concentrations. (C) Liposome titrations of 100 nM WT Syt1 C2AB* fragment and mutant fragments where the Ca2+-binding sites of the C2A domain (C2aB*) or C2B domain (C2A*b) were disrupted with D178A,D230A,D232A or D309A,D363A,D365A mutations. All of the data were fit to a Hill function.
Fig. 6.
Fig. 6.
PIP2 enhances the membrane affinity of the Syt1 and Syt7 C2B domains. Titrations of 100 nM Syt1 C2A domain (A) or C2B domain (B), or 20 nM Syt7 C2A domain (C) and C2B domain (D) with liposomes lacking (black circles) or containing (red circles) PIP2 in the presence of 1 mM Ca2+. Binding was monitored from the FRET developed between a donor BODIPY-FL probe attached to the proteins and a rhodamine acceptor present in the liposomes. Each point represents the average of at least three measurements performed with different liposome preparations. All of the data were fit to a Hill function.
Fig. 7.
Fig. 7.
Subtle residue substitutions underlie in part the stronger membrane binding affinity of the Syt7 C2A domain compared with the Syt1 C2A domain. (A) Ribbon diagrams of the Syt7 C2A domain (cyan) and Syt1 C2A domain (orange) showing the Cα and side chain atoms of residues that are different in their Ca2+-binding regions and were mutated to analyze the basis for their different membrane affinities (oxygens are in red, nitrogens in blue, sulfur atoms in yellow, and carbon atoms in cyan for Syt7 and in orange for Syt1). (B and C) Titrations of 20 nM WT and mutant Syt7 C2A domains with liposomes in the presence of 1 mM Ca2+. Binding was monitored from the FRET developed between a donor BODIPY-FL probe attached to the proteins and a rhodamine acceptor present in the liposomes. Each point represents the average of at least three measurements performed with different liposome preparations. (D) Analogous liposome titrations of 100 nM WT and mutant Syt1 C2A domains. (E) Analogous liposome titrations of 100 nM WT and mutant Syt1 and Syt7 C2A domains. Note that the data obtained for WT and M173F,K236R Syt1 C2A domains (orange and gray circles, respectively) are the same as those shown in D, but the scale of the x axis is different to allow comparison with the data obtained for the WT and mutant Syt7 C2A domains. All of the data were fit to a Hill function.
Fig. S2.
Fig. S2.
Placing the fluorescent probe on the C2A or C2B domain does not alter phospholipid binding to the Syt1 or Syt7 C2AB fragment. (A) Ribbon diagrams of the structures of the Syt7 and Syt1 C2A or C2B domains, as indicated. The structure of the Syt7 C2A domain is described here. Those of the Syt7 C2B domain, the Syt1 C2A domain, and the Syt1 C2B domain correspond to PDB ID codes 3N5A, 1BYN, and 1K5W, respectively. The bound Ca2+ ions are shown as yellow spheres. The two loops involved in Ca2+ binding are indicated (loop 1 and loop 3), and the N and C termini are labeled N and C, respectively. The native cysteine side chains of the Syt7 C2A and C2B domains, as well as the side chains that were mutated to cysteine in the Syt1 C2A and C2B domains to attach a fluorescent probe, are shown as stick models. (B) Titrations of 20 nM Syt7 C2A*B and C2AB* fragments (where the * indicates the domain where the fluorescent probe was attached) with liposomes in the presence of 1 mM Ca2+. Binding was monitored from the FRET developed between a donor BODIPY-FL probe attached to the proteins and a rhodamine acceptor present in the liposomes. Each point represents the average of at least three measurements performed with different liposome preparations. (C) Analogous liposome titrations of 100 nM Syt1 C2A*B and C2AB* fragments. All of the data were fit to a Hill function. (D and E) Superpositions of the data obtained in analogous titrations of 20 nM Syt7 C2A domain (D) or Syt7 C2B domain (E), illustrating the reproducibility of the results. Each symbol represents one dataset obtained with a different liposome preparation. The apparent KDs derived for the six datasets shown in D are 1.49, 2.35, 2.62, 2.42, 2.37, and 3.17 μM, and those derived for the four datasets shown in E are 34.1, 31.4, 38.1, and 36.4 μM. The Syt7 C2B domain data provide an example with small variability among different titrations while the Syt7 C2A domain data illustrate an example with the largest variability, which is reflected in a larger SD in relative terms (Table 1). Even in this case, the data exhibit excellent consistency that allows accurate comparison with the binding curves obtained for other proteins.
Fig. S3.
Fig. S3.
The Syt7 C2A domain binds to PIP2-containing liposomes with higher affinity than the Syt7 C2B domain. Titrations of 20 nM Syt7 C2A domain (red circles) or C2B domain (blue circles) with liposomes containing PIP2 in the presence of 1 mM Ca2+. Binding was monitored from the FRET developed between a donor BODIPY-FL probe attached to the proteins and a rhodamine acceptor present in the liposomes. Each point represents the average of at least three measurements. All of the data were fit to a Hill function. The data are the same shown in Fig. 6 C and D with liposomes containing PIP2.

Similar articles

Cited by

References

    1. Südhof TC. Neurotransmitter release: The last millisecond in the life of a synaptic vesicle. Neuron. 2013;80:675–690. - PMC - PubMed
    1. Südhof TC, Rothman JE. Membrane fusion: Grappling with SNARE and SM proteins. Science. 2009;323:474–477. - PMC - PubMed
    1. Rizo J, Xu J. The synaptic vesicle release machinery. Annu Rev Biophys. 2015;44:339–367. - PubMed
    1. Brunger AT, Cipriano DJ, Diao J. Towards reconstitution of membrane fusion mediated by SNAREs and other synaptic proteins. Crit Rev Biochem Mol Biol. 2015;50:231–241. - PMC - PubMed
    1. Südhof TC. Synaptotagmins: Why so many? J Biol Chem. 2002;277:7629–7632. - PubMed

Publication types

LinkOut - more resources