. 2017 Oct 3;114(40):E8478-E8487.
doi: 10.1073/pnas.1710625114. Epub 2017 Sep 18.

Endothelial insulin receptors differentially control insulin signaling kinetics in peripheral tissues and brain of mice

Affiliations

Endothelial insulin receptors differentially control insulin signaling kinetics in peripheral tissues and brain of mice

Masahiro Konishi et al. Proc Natl Acad Sci U S A. .

Abstract

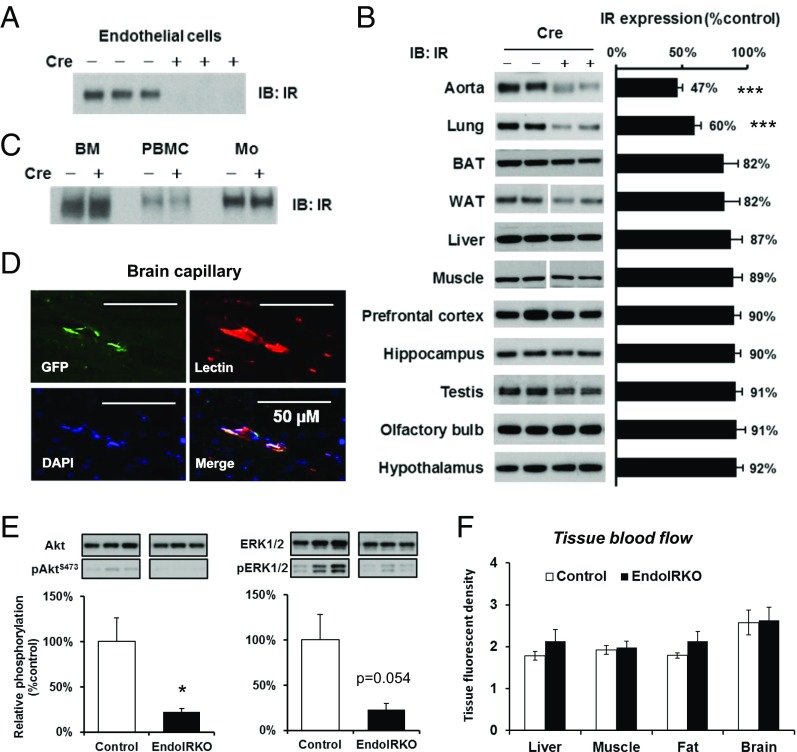
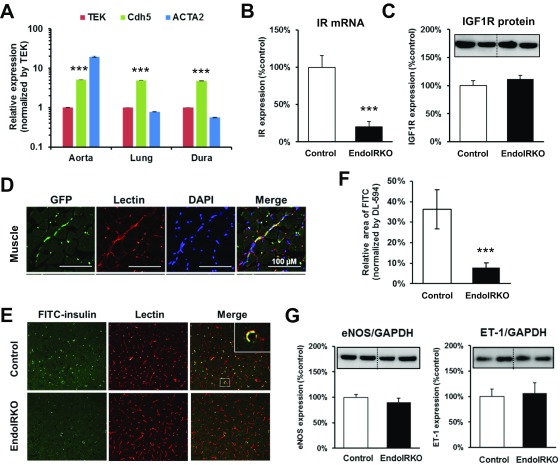
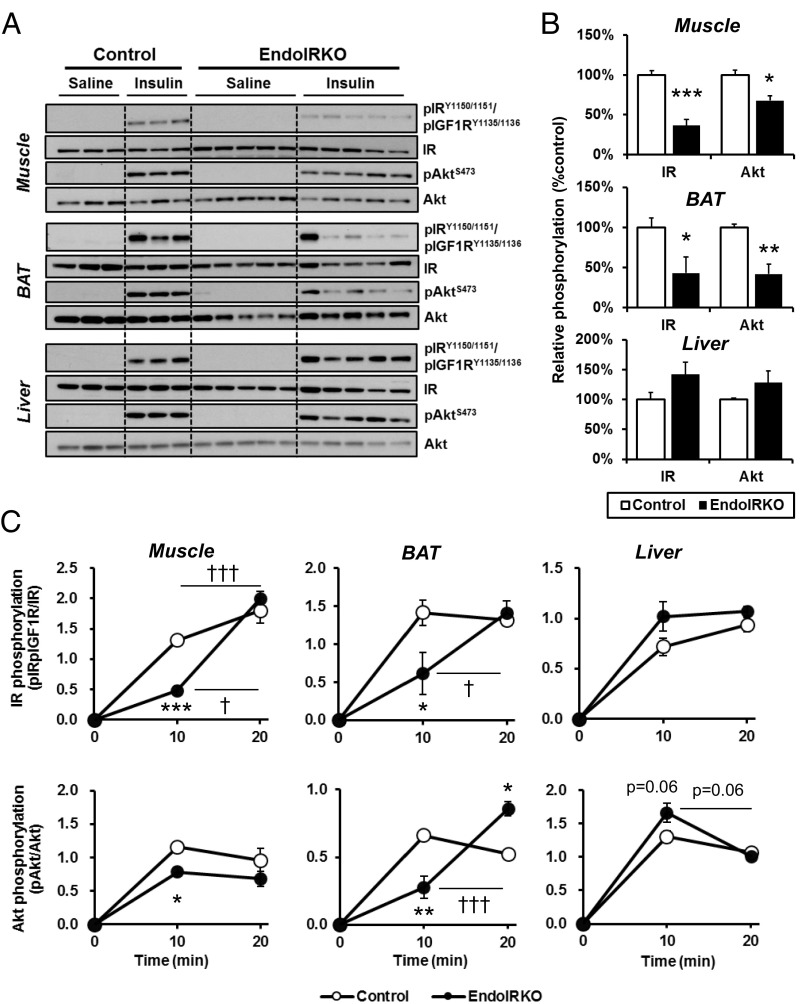
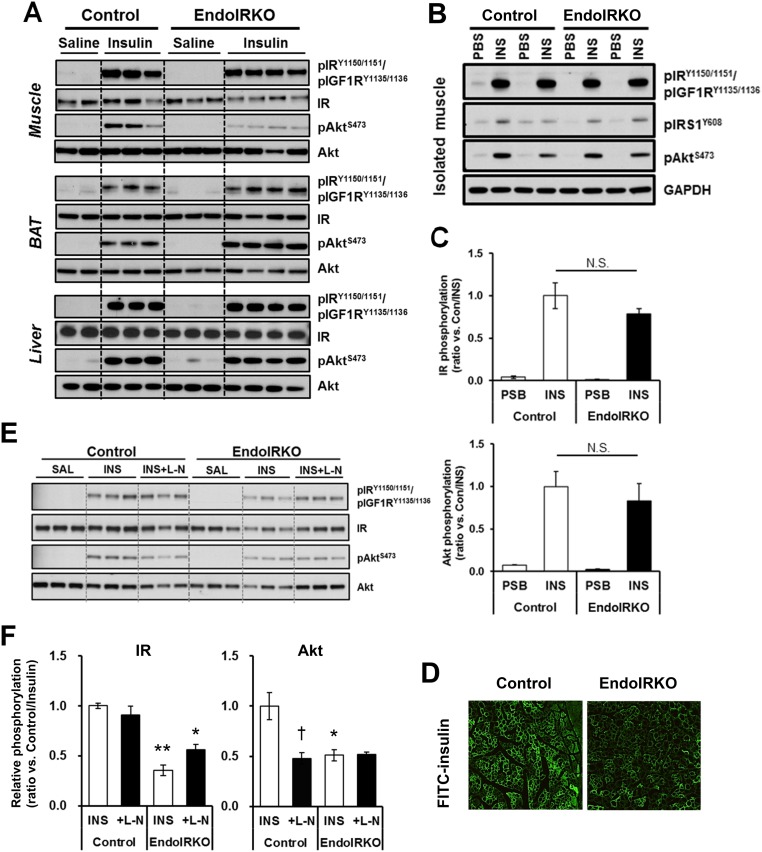
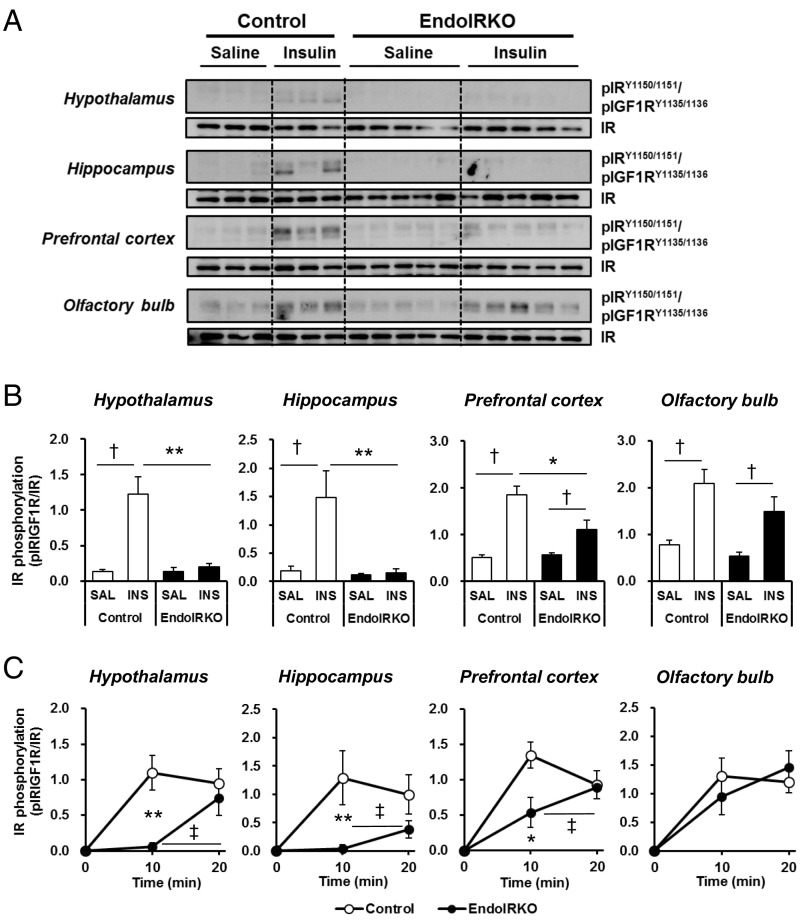
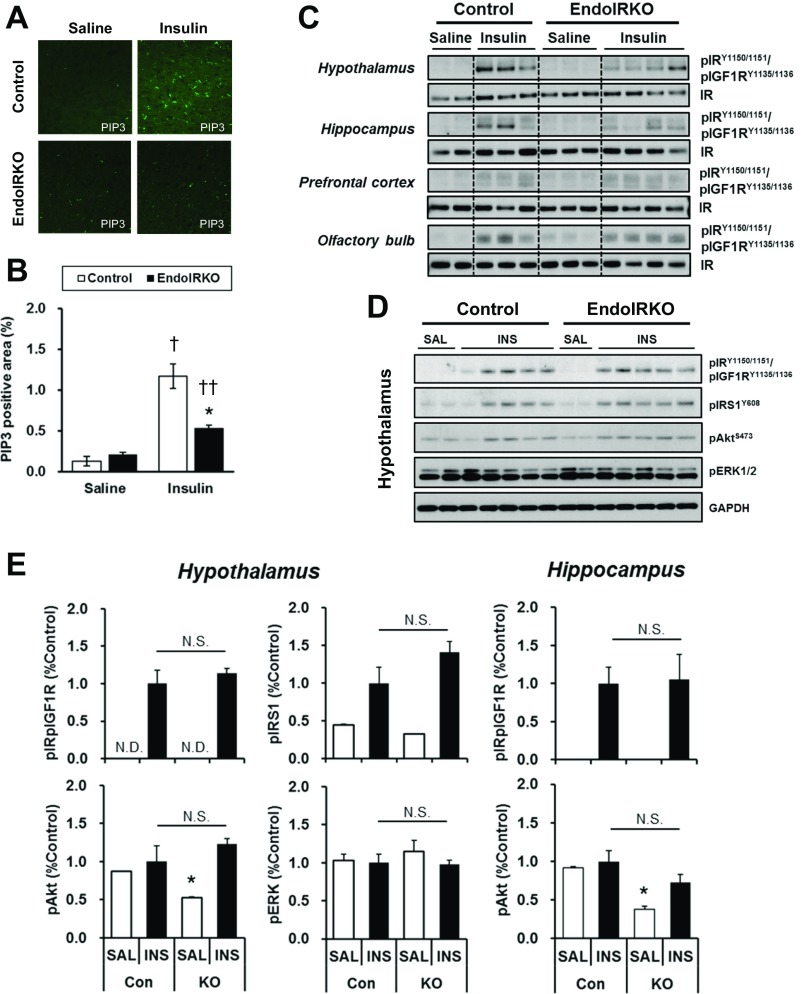
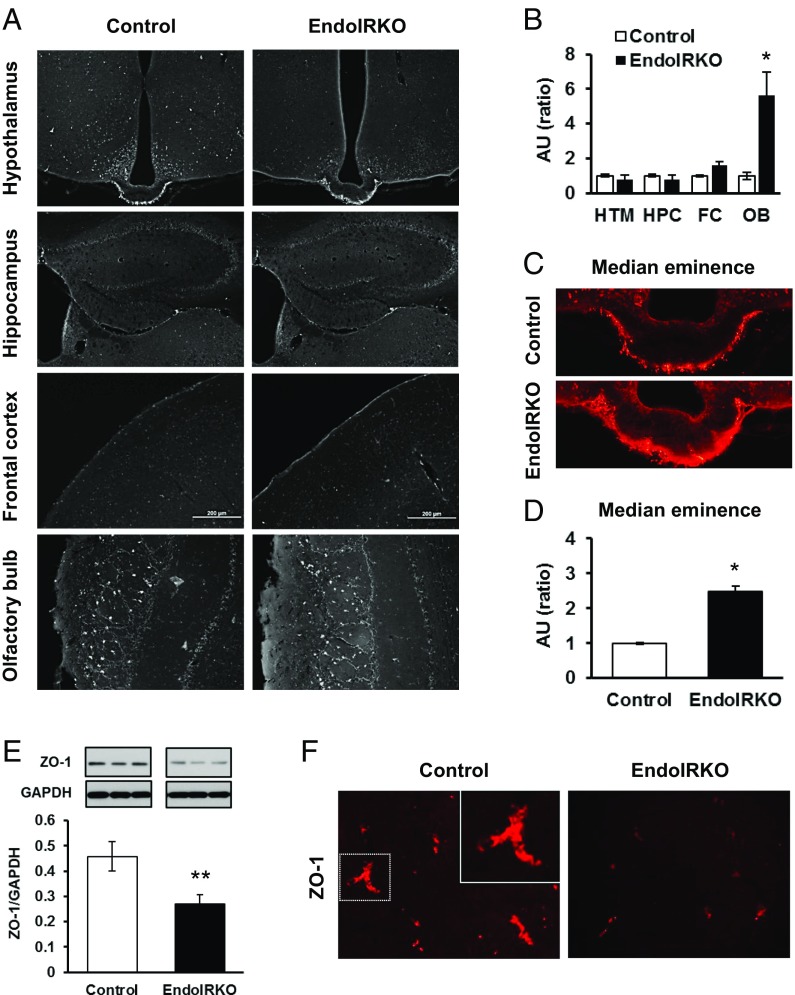
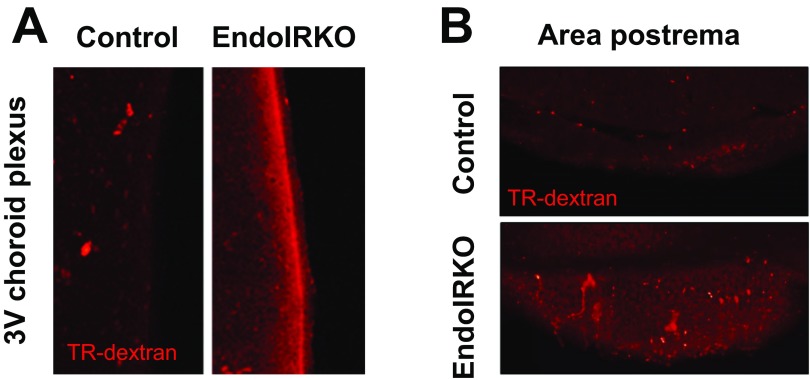
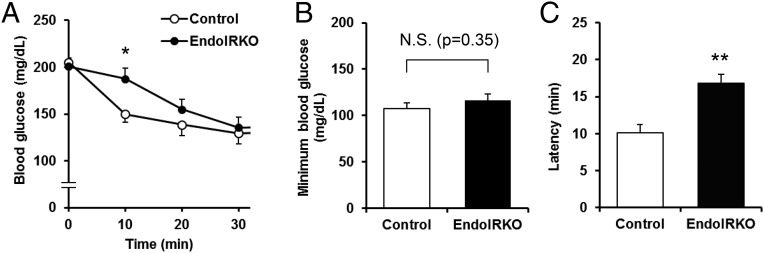
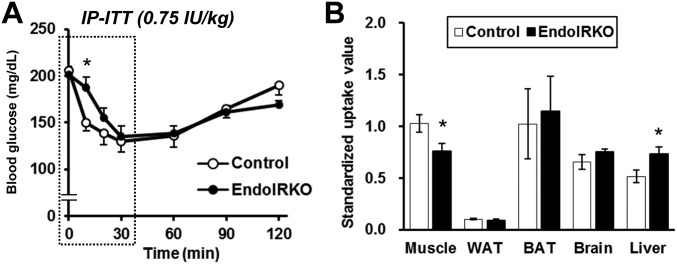
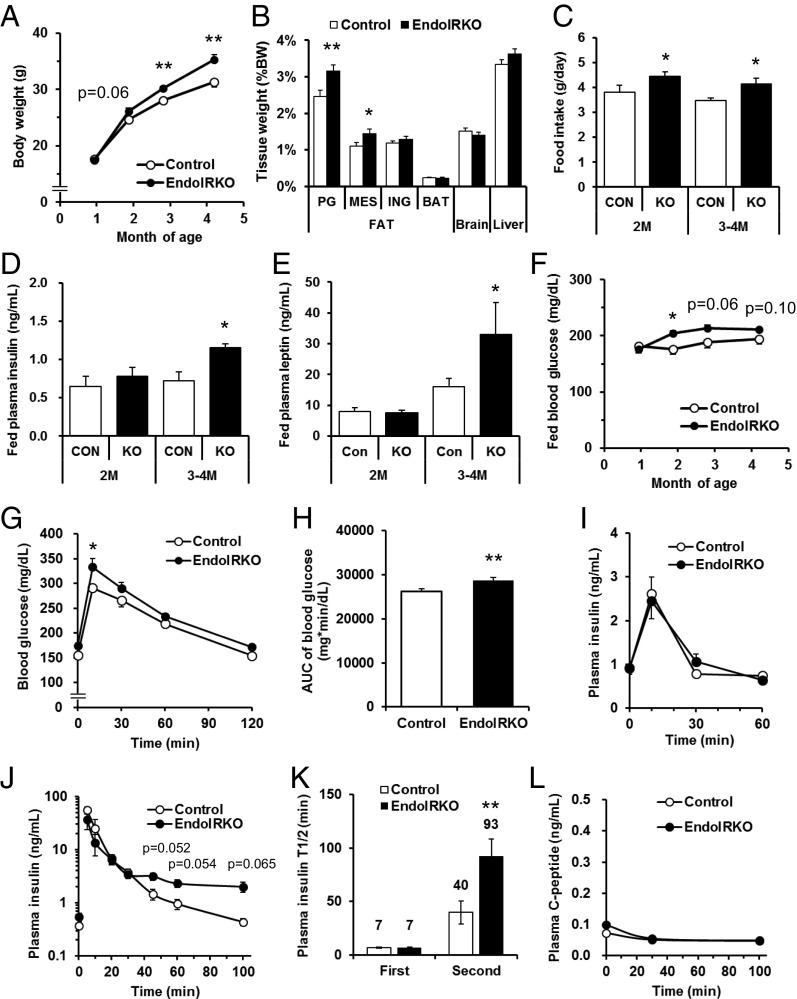
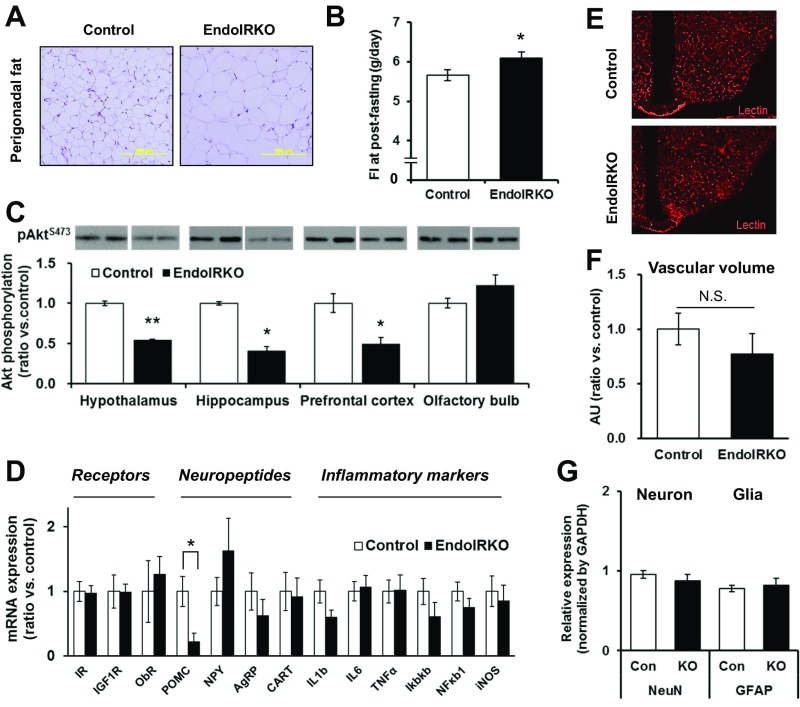
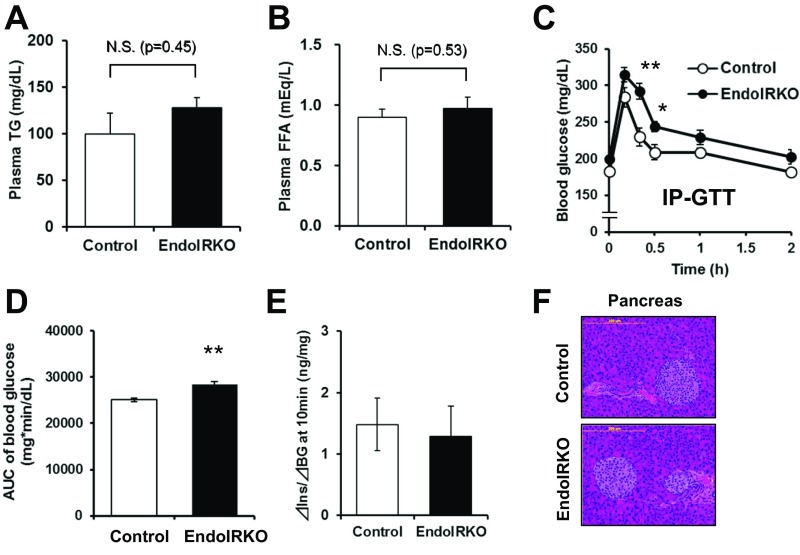
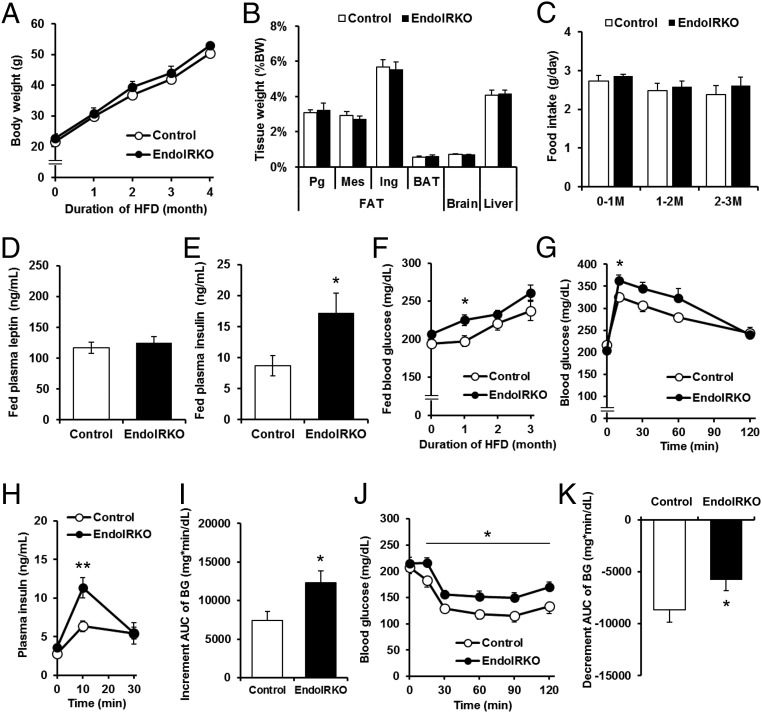
Insulin receptors (IRs) on endothelial cells may have a role in the regulation of transport of circulating insulin to its target tissues; however, how this impacts on insulin action in vivo is unclear. Using mice with endothelial-specific inactivation of the IR gene (EndoIRKO), we find that in response to systemic insulin stimulation, loss of endothelial IRs caused delayed onset of insulin signaling in skeletal muscle, brown fat, hypothalamus, hippocampus, and prefrontal cortex but not in liver or olfactory bulb. At the level of the brain, the delay of insulin signaling was associated with decreased levels of hypothalamic proopiomelanocortin, leading to increased food intake and obesity accompanied with hyperinsulinemia and hyperleptinemia. The loss of endothelial IRs also resulted in a delay in the acute hypoglycemic effect of systemic insulin administration and impaired glucose tolerance. In high-fat diet-treated mice, knockout of the endothelial IRs accelerated development of systemic insulin resistance but not food intake and obesity. Thus, IRs on endothelial cells have an important role in transendothelial insulin delivery in vivo which differentially regulates the kinetics of insulin signaling and insulin action in peripheral target tissues and different brain regions. Loss of this function predisposes animals to systemic insulin resistance, overeating, and obesity.

Keywords: brain insulin action; endothelial cells; feeding behavior; insulin receptor; insulin resistance.


Conflict of interest statement

Conflict of interest statement: Masahiro Konishi is an employee of Daiichi Sankyo and was on sabbatical leave at Joslin Diabetes Center when the study was completed.

Figures

Fig. 1.
Fig. 1.
VE-cadherin-Cre mediates efficient gene recombination and blocks insulin action in endothelial cells. Protein expression of IR was assessed by Western blotting in isolated lung endothelial cells (A), peripheral tissues and brain subregions (B), bone marrow (BM), peripheral blood mononuclear cells (PBMC), and peritoneal macrophages (Mo) from adult control and EndoIRKO mice and (n = 5–7) (C). (D) Representative images of immunohistochemical staining of GFP, lectin, and DAPI with brain sections of adult ROSA26-EGFP:VE-cadherin-Cre+/− mice. (E) Akt and ERK phosphorylation assessed by Western blotting in aorta of 2-mo-old mice after 4-h fasting (n = 7). (F) Tissue blood flow in liver, muscle, mesenteric fat, and whole brain as assessed by a fluorescent microsphere method in 4-h fasted mice (n = 8). Data are presented as mean ± SEM; *P < 0.05, ***P < 0.001 by unpaired t test.
Fig. S1.
Fig. S1.
Related to Fig. 1, VE-cadherin-Cre mediates efficient gene recombination and blocks insulin action in endothelial cells. (A) Quantitative PCR (qPCR) analysis of mRNA expression of Tie-2 (TEK), VE-cadherin (Cdh5), and ACTA2 in aorta, lung, and dura matter in 2-mo-old mice (n = 8). Values were normalized by TBP and TEK. Messenger RNA expression of IRs (B) and protein expression (C) of IGF1-receptor in aorta (n = 8) by qPCR and Western blot, respectively. (D) Representative images of GFP expressions in vessels in the skeletal muscle of 2-mo-old ROSA26EGFP:VE-cadherin-Cre+/− mice assessed by immunohistochemistry. (E) Representative images in frontal cortex for FITC-insulin and DyLight 594-labeled lectin after i.v. infusion of FITC-insulin (14 mU·kg−1·min−1) for 10 min followed by lectin injection (1 mg/kg) to 2-mo-old mice after 4-h fasting. (F) FITC-insulin binding in the frontal cortex was estimated by relative FITC-positive area normalized by DyLight594-positive area (n = 4). (G) Protein expressions of vascular mediators eNOS (Left) and ET-1 (Right), in aorta assessed by Western blotting (n =7). Data are presented as mean ± SEM; ***P < 0.001, control vs. EndoIRKO mice by unpaired t test.
Fig. 2.
Fig. 2.
Loss of endothelial IR causes kinetic delay of the insulin signaling in skeletal muscle and BAT but not liver. (A) Western blot analysis of insulin signaling in soleus muscle, interscapular BAT, and liver of 2-mo-old overnight fasted control and EndoIRKO mice 10 min after i.v. insulin stimulation (5 IU per mouse) or control saline (n = 3–5). (B) Relative phosphorylation of IR and Akt calculated as the ratio of phosphoprotein/total protein and normalized by values in control mice. (C) Time-course of relative phosphorylation of IR and Akt after subtracting values in saline group during 20 min after i.v. insulin stimulation (5 IU per mouse) (n = 2–5). Data are presented as mean ± SEM; *P < 0.05, **P < 0.01, ***P < 0.001, control vs. EndoIRKO mice by unpaired t test; P < 0.05, †††P < 0.001, 10 min vs. 20 min in each mouse by ANOVA.
Fig. S2.
Fig. S2.
Related to Fig. 2, loss of endothelial IR causes kinetic delay of the insulin signaling in skeletal muscle and BAT but not liver. (A) Western blot analysis of insulin signaling in soleus muscle, BAT, and liver of 2-mo-old mice at 20 min after i.v. insulin stimulation (5 IU per mouse) or control saline (n = 2–4). (B) Western blot analysis of insulin signaling in isolated soleus muscle of 2-mo-old mice at 10 min after ex vivo insulin (50 nM) or PBS stimulation (n = 4). (C) Relative phosphorylation of IR and Akt estimated by phospho-protein/total protein [expressed ratio vs. Con/INS (insulin trial in control mice)] after ex vivo insulin stimulation. (D) Representative images of muscle after FITC-insulin infusion (14 mU·kg−1·min−1) for 10 min in 2-mo-old mice after 4-h fasting. (E) Western blot analysis of insulin signaling in soleus muscle at 10 min after i.v. insulin stimulation (5 IU, INS) or control saline (SAL) to 2-mo-old control and EndoIRKO mice (n = 3) with pretreatment of i.p. injection of l-NAME (L-N) or saline at 30 min before insulin injection. (F) Relative phosphorylation of IR and Akt estimated by phospho-protein/total protein and normalized with values of insulin injection group in control mice (Control/INS). Data are presented as mean ± SEM; *P < 0.05, **P < 0.01, control vs. EndoIRKO mice; P < 0.05, INS vs. INS + L-N by ANOVA.
Fig. 3.
Fig. 3.
Loss of endothelial IR causes delays in insulin signaling in hypothalamus, hippocampus, and prefrontal cortex, but not olfactory bulb. (A) Western blot analysis of insulin signaling in hypothalamus, hippocampus, prefrontal cortex, and olfactory bulb of 2-mo-old overnight fasted control and EndoIRKO mice 10 min after i.v. insulin stimulation (INS, 5 IU per mouse) or control saline (SAL) (n = 3–5). (B) Relative phosphorylation of IR estimated by phosphoprotein/total protein. (C) Time-course of relative phosphorylation of IR after subtracting values in saline group during the 20 min after i.v. insulin stimulation (5 IU per mouse) (n = 2–5). Data are presented as mean ± SEM; *P < 0.05, **P < 0.01, control vs. EndoIRKO mice by unpaired t test; P < 0.05, saline vs. insulin for each mouse by unpaired t test; P < 0.05, 10 min vs. 20 min in each group of mice by ANOVA.
Fig. S3.
Fig. S3.
Related to Fig. 3, loss of endothelial IR causes delays in insulin signaling in hypothalamus, hippocampus, and prefrontal cortex, but not olfactory bulb. (A) Representative images in frontal cortex for PIP3 at 10 min after i.v. insulin (5 IU per mouse) or saline injection to 2-mo-old mice after overnight fasting. (B) Relative PIP3-positive area in frontal cortex (n = 3). (C) Western blot analysis of insulin signaling in hypothalamus, hippocampus, prefrontal cortex, and olfactory bulb of 2-mo-old control and EndoIRKO mice at 20 min after i.v. insulin stimulation (5 IU per mouse) or control saline (n = 2–4). (D) Western blot analysis of insulin signaling in hypothalamus at 10 min after i.c.v. insulin (INS, 500 µU/μL, 2 µL) or control saline (SAL) injection to 2-mo mice (n = 2–5). (E) Relative phosphorylation of IR, IRS1, Akt, and ERK in hypothalamus, and IR and Akt in hyppocampus estimated by phospho-protein/total protein [expressed ratio vs. insulin trial in control mice (Con/INS)]. Data are presented as mean ± SEM; *P < 0.05, control vs. EndoIRKO mice. P < 0.05, ††P < 0.01, saline vs. insulin by ANOVA. N.D., not detectable level; N.S., not significant difference.
Fig. 4.
Fig. 4.
Loss of endothelial IR causes impaired barrier function in the brain. (A) Representative images of brain sections of hypothalamus (HTM), hippocampus (HPC), frontal cortex (FC), and olfactory bulb (OB) at 10 min after i.v. injection of Texas Red (TR)-conjugated dextran (3 kDa, TR-dextran) to 2-mo-old mice. (B) Relative intensity of TR-dextran in each brain regions from A (n = 3). (C) Representative images of brain sections of median eminence after TR-dextran injection. (D) Relative intensity of TR-dextran in medium eminence from C (n = 3). (E) Western blot analysis of ZO-1 expression in hypothalamus in 2-mo-old mice (n = 6). (F) Representative images of hypothalamic sections with immunohistochemical stain of ZO-1 protein in 2-mo-old mice. *P < 0.05, **P < 0.01, control vs. EndoIRKO mice by unpaired t test.
Fig. S4.
Fig. S4.
Related to Fig. 4, loss of endothelial IR causes impaired barrier function in the brain. Representative images of brain sections of the third ventricle (3V) choroid plexus (A) and area postrema (B) at 10 min after i.v. injection of Texas Red (TR)-conjugated dextran (3 kDa, TR-dextran) to 2-mo-old mice (n = 3).
Fig. 5.
Fig. 5.
Loss of endothelial IR causes functional delay of systemic insulin action. (A) Blood glucose levels after i.p. injection of insulin (0.75 IU/kg) to 2-mo-old control (n = 11) and EndoIRKO mice (n = 18) fasted for 4 h before the experiment. (B) Minimum blood glucose levels after the insulin injection. (C) Latency for hypoglycemic effect of insulin calculated as a time to induce half maximum reduction after the insulin injection. Data are presented as mean ± SEM; *P < 0.05, **P < 0.01, control vs. EndoIRKO mice in ANOVA (A) or unpaired t test (B and C). N.S., not significant.
Fig. S5.
Fig. S5.
Related to Fig. 5, loss of endothelial IR causes functional delay of systemic insulin action. (A) Blood glucose levels in i.p. (IP)-ITT with 0.75 IU/kg in 2-mo-old control (n = 11) and EndoIRKO mice (n = 18). Dotted area in A was trimmed for Fig. 5A. (B) Standardized uptake value (distribution of glucose uptake in tissues) after insulin injection (1 mU/g) in combination with [14C]2-deoxyglucose (0.33 µCi/g) to 4-h fasted 2-mo-old mice (n = 5). Data are presented as mean ± SEM; *P < 0.05, control vs. EndoIRKO mice by ANOVA (A) and unpaired t test (B).
Fig. 6.
Fig. 6.
Loss of endothelial IR causes systemic insulin resistance and mild obesity. (A) Body weight changes of control (n = 10–13) and EndoIRKO mice (n = 15–33). (B) Tissue weight of 3-mo-old mice (control, n = 11; EndoIRKO, n = 13). PG, Mes, and ING is perigonadal, mesenteric, inguinal fat, respectively. (C) Cumulative food intake for 24 h in 2-mo and 3- to 4-mo-old mice (n = 12). Plasma insulin (D) and leptin (E) in 2-mo and 3- to 4-mo-old mice with nonfasting (n = 7). (F) Blood glucose levels with nonfasting condition (control, n = 10–13; EndoIRKO, n = 15–33). Blood glucose (G), area under the curve (AUC) of blood glucose (H), and plasma insulin (I) during oral glucose tolerance test (2 g/kg) performed at 2- to 3-mo-old mice after 4-h fasting before the experiment (control, n = 11; EndoIRKO, n = 12). Plasma insulin (J), half-life of insulin (T1/2) in the plasma (K), and plasma C-peptide (L) after i.v. injection of insulin (1 IU/kg, n = 3). Data are presented as mean ± SEM; *P < 0.05, **P < 0.01, control vs. EndoIRKO mice by ANOVA (A, F, G, and J) or unpaired t test (BE, H, and K).
Fig. S6.
Fig. S6.
Related to Fig. 6, loss of endothelial IR causes systemic insulin resistance and mild obesity. (A) Representative images for perigonadal fat with H&E stain in 3- to 4-mo-old control and EndoIRKO mice. (B) Cumulative food intake for 24-h after overnight fasting stimulation in 2- to 3-mo-old control (n = 7) and EndoIRKO (n = 8) mice. (C) Western blot analysis of basal brain Akt signaling in 2-mo-old mice with nonfasting. Akt phosphorylation was evaluated by phospho/total protein and normalized by control (n = 2–3). (D) Hypothalamic mRNA expressions of receptors, neuropeptides, and inflammatory markers in 2-mo-old mice after 4-h fasting assessed by qPCR (n = 11–13). (E) Representative images of hypothalamic section after i.v. lectin injection to label endothelium (1 mg/kg). (F) Quantification of lectin-positive area in hypothalamic sections (ratio vs. control, n = 3). (G) Relative protein expressions of neuronal (NeuN) and glial (GFAP) markers assessed by Western blotting in 2-mo-old mice (n = 8). Data are presented as mean ± SEM; *P < 0.05, **P < 0.01, control vs. EndoIRKO mice by unpaired t test. N.S., not significant difference.
Fig. S7.
Fig. S7.
Related to Fig. 6, loss of endothelial IR causes systemic insulin resistance and mild obesity. Plasma triglyceride (TG) (A) and FFA (B) concentrations in nonfasting condition of 3- to 4-mo-old control (n = 8–11) and EndoIRKO (n = 8–12) mice. Blood glucose levels (C) and AUC of blood glucose levels (D) during i.p. (IP)-GTT (2 g/kg) in 2- to 3-mo-old mice after 4-h fasting (n = 7–9). (E) Index of insulin secretion at 10 min after oral GTT (related to Fig. 6 G and I) estimated by changes in plasma insulin from baseline vs. changes in blood glucose from baseline. (F) Representative images for pancreatic sections with H&E stain in 3- to 4-mo-old control and EndoIRKO mice. Data are presented as mean ± SEM; *P < 0.05, **P < 0.01, control vs. EndoIRKO mice by ANOVA (C) and unpaired t test (A, B, and D). N.S., not significant difference.
Fig. 7.
Fig. 7.
Loss of endothelial IR accelerates high-fat diet-induced insulin insensitivity. (A) Body weight changes during 4 mo of HFD treatment starting at 6–8 wk of age (control, n = 9; EndoIRKO, n = 8–). (B) Tissue weight after 4 mo of HFD treatment. PG, Mes, and ING is perigonadal, mesenteric, and inguinal fat, respectively. (C) Cumulative food intake for 24 h at different stage of HFD treatment. Plasma leptin (D) and insulin (E) in nonfasting condition after 3 mo of HFD treatment. (F) Blood glucose levels with nonfasting condition. Blood glucose (G), plasma insulin levels (H), and increment area under the curve (AUC) (I) of blood glucose levels during oral glucose tolerance test (2 g/kg) performed in mice fasted for 4 h after 3 mo of HFD. Blood glucose (J) and decrement AUC (K) of blood glucose levels during insulin tolerance test (1.25 IU/kg, i.p.) in mice fasted for 4 h after 3-mo HFD treatment. Data are presented as mean ± SEM; *P < 0.05, **P < 0.01, control vs. EndoIRKO mice by ANOVA (FH and J) or unpaired t test (E, J, and K).

Similar articles

Cited by

References

    1. Rask-Madsen C, Kahn CR. Tissue-specific insulin signaling, metabolic syndrome, and cardiovascular disease. Arterioscler Thromb Vasc Biol. 2012;32:2052–2059. - PMC - PubMed
    1. Laakso M, Kuusisto J. Insulin resistance and hyperglycaemia in cardiovascular disease development. Nat Rev Endocrinol. 2014;10:293–302. - PubMed
    1. Schubert M, et al. Role for neuronal insulin resistance in neurodegenerative diseases. Proc Natl Acad Sci USA. 2004;101:3100–3105. - PMC - PubMed
    1. Biessels GJ, Reagan LP. Hippocampal insulin resistance and cognitive dysfunction. Nat Rev Neurosci. 2015;16:660–671. - PubMed
    1. Kleinridders A, et al. Insulin resistance in brain alters dopamine turnover and causes behavioral disorders. Proc Natl Acad Sci USA. 2015;112:3463–3468. - PMC - PubMed

Publication types

LinkOut - more resources