

Antagonism correlates with metabolic similarity in diverse bacteria
- PMID: 28923945
- PMCID: PMC5635879
- DOI: 10.1073/pnas.1706016114
Antagonism correlates with metabolic similarity in diverse bacteria
Abstract
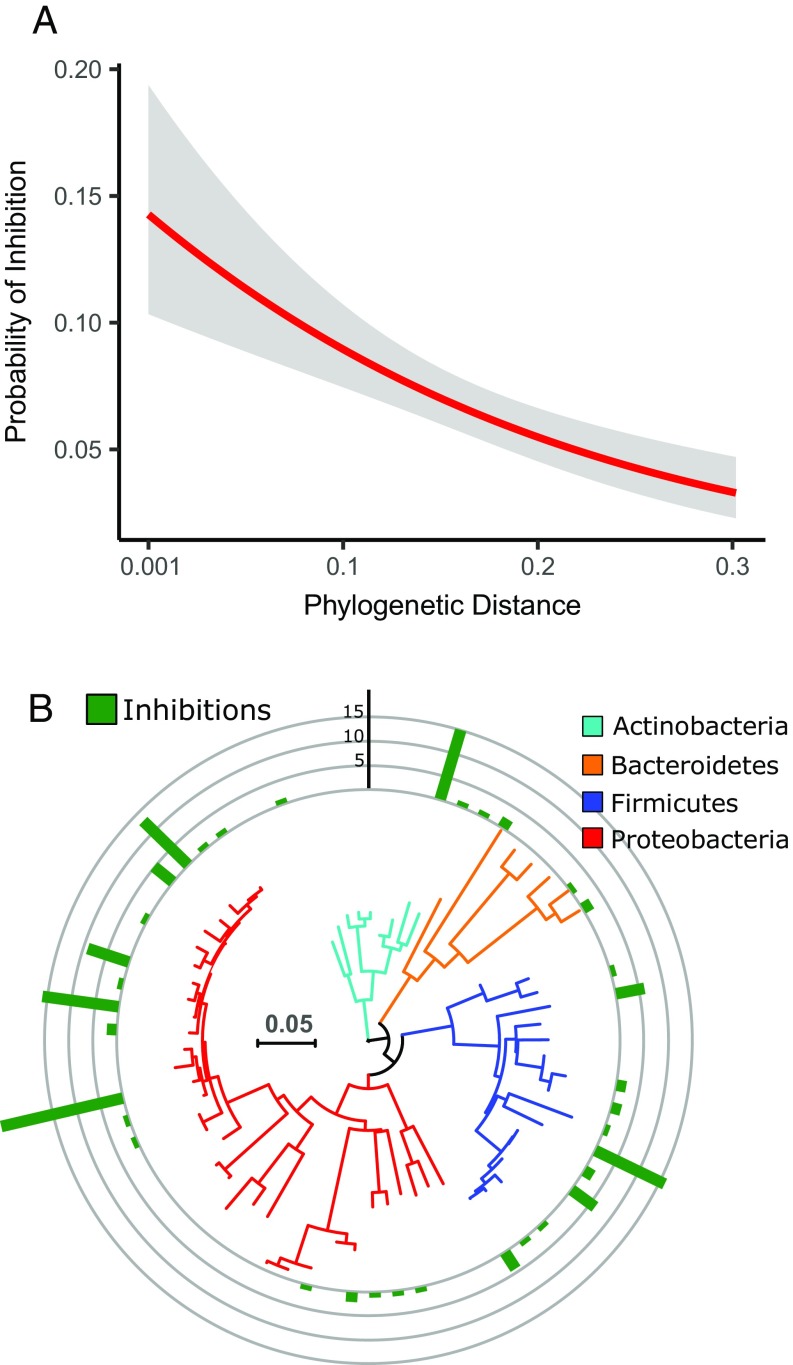
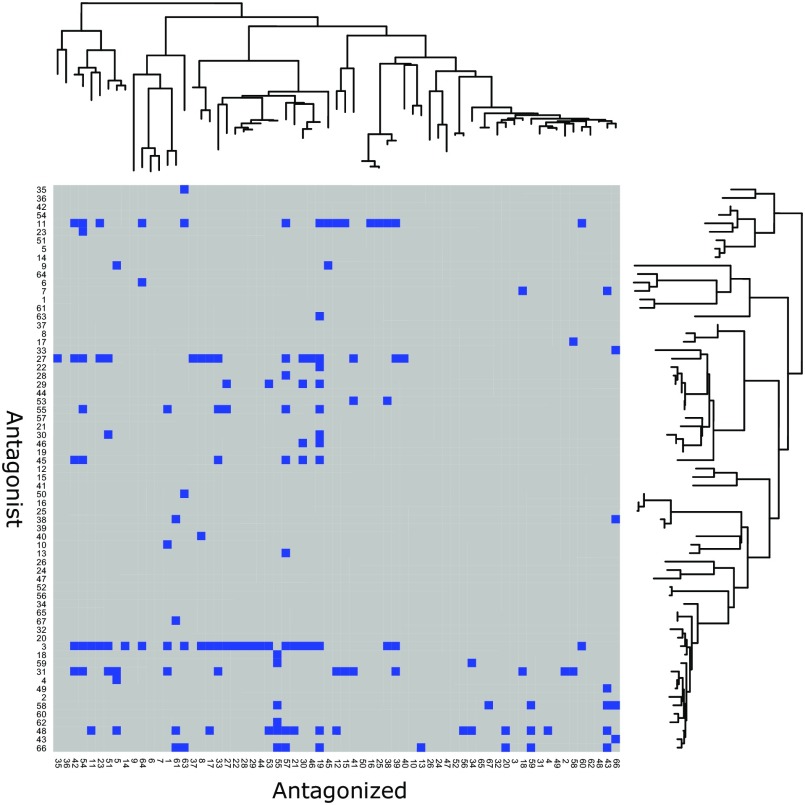
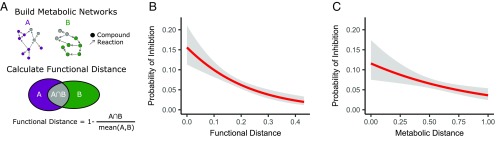
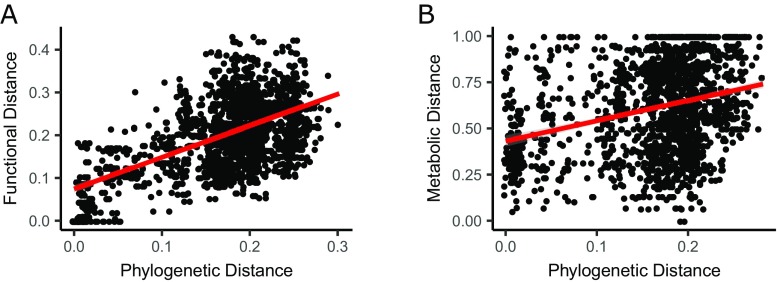
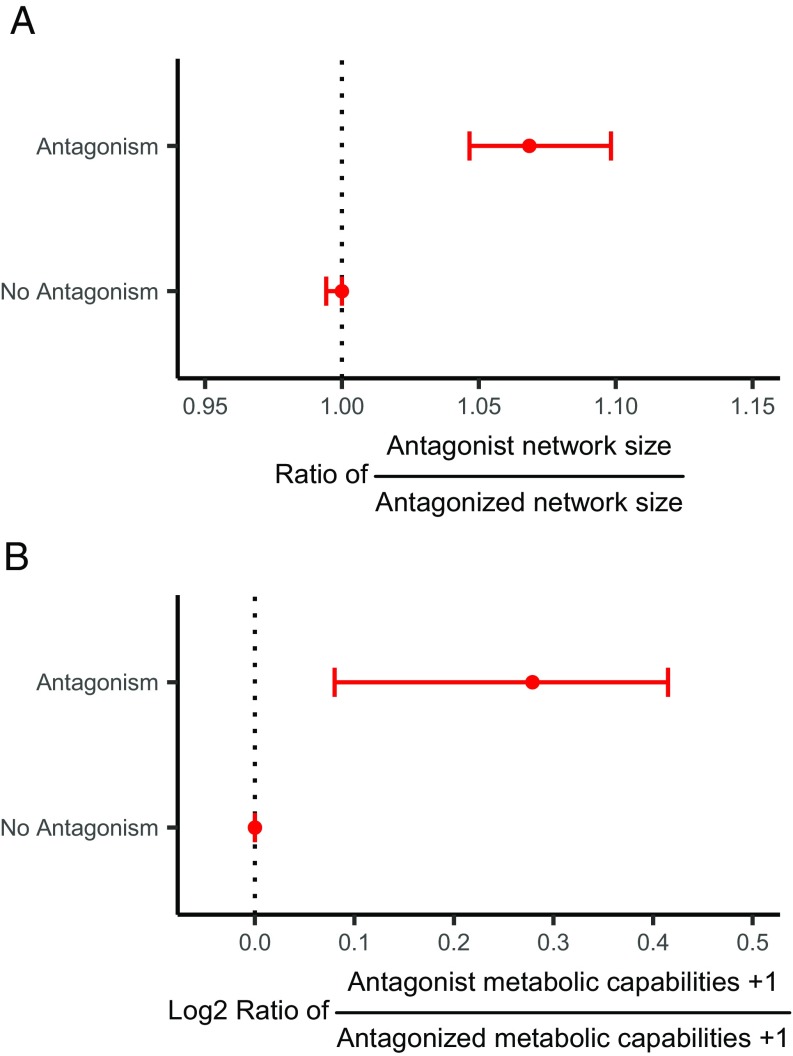
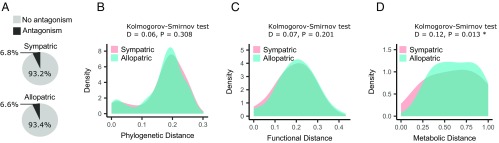
In the Origin of Species, Charles R. Darwin [Darwin C (1859) On the Origin of Species] proposed that the struggle for existence must be most intense among closely related species by means of their functional similarity. It has been hypothesized that this similarity, which results in resource competition, is the driver of the evolution of antagonism among bacteria. Consequently, antagonism should mostly be prevalent among phylogenetically and metabolically similar species. We tested the hypothesis by screening for antagonism among all possible pairwise interactions between 67 bacterial species from 8 different environments: 2,211 pairs of species and 4,422 interactions. We found a clear association between antagonism and phylogenetic distance, antagonism being most likely among closely related species. We determined two metabolic distances between our strains: one by scoring their growth on various natural carbon sources and the other by creating metabolic networks of predicted genomes. For both metabolic distances, we found that the probability of antagonism increased the more metabolically similar the strains were. Moreover, our results were not compounded by whether the antagonism was between sympatric or allopatric strains. Intriguingly, for each interaction the antagonizing strain was more likely to have a wider metabolic niche than the antagonized strain: that is, larger metabolic networks and growth on more carbon sources. This indicates an association between an antagonistic and a generalist strategy.
Keywords: antagonism; antibiotics; bacteria; competition; competition-relatedness hypothesis.
Conflict of interest statement
The authors declare no conflict of interest.
Figures
References
-
- Darwin C. On the Origin of Species. John Murray; London: 1859.
-
- Cavender-Bares J, Ackerly DD, Baum DA, Bazzaz FA. Phylogenetic overdispersion in Floridian oak communities. Am Nat. 2004;163:823–843. - PubMed
-
- Stubbs WJ, Wilson JB. Evidence for limiting similarity in a sand dune community. J Ecol. 2004;92:557–567.
-
- Violle C, Nemergut DR, Pu Z, Jiang L. Phylogenetic limiting similarity and competitive exclusion. Ecol Lett. 2011;14:782–787. - PubMed
-
- Kunstler G, et al. Plant functional traits have globally consistent effects on competition. Nature. 2016;529:204–207. - PubMed
Publication types
MeSH terms
Substances
Associated data
- Actions
- Actions
- Actions
- Actions
- Actions
- Actions
- Actions
- Actions
LinkOut - more resources
Full Text Sources
Other Literature Sources
