. 2017 Oct 3;114(40):10761-10766.
doi: 10.1073/pnas.1702490114. Epub 2017 Sep 18.

Cross-scale effects of neural interactions during human neocortical seizure activity

Affiliations

Cross-scale effects of neural interactions during human neocortical seizure activity

Tahra L Eissa et al. Proc Natl Acad Sci U S A. .

Erratum in

Abstract

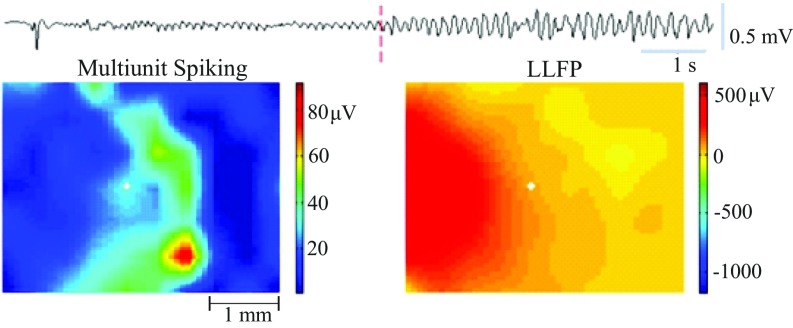
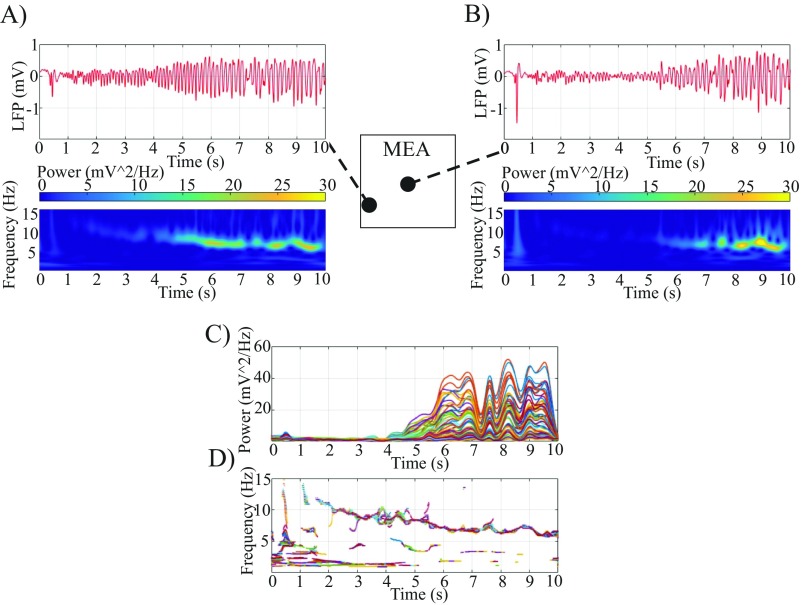
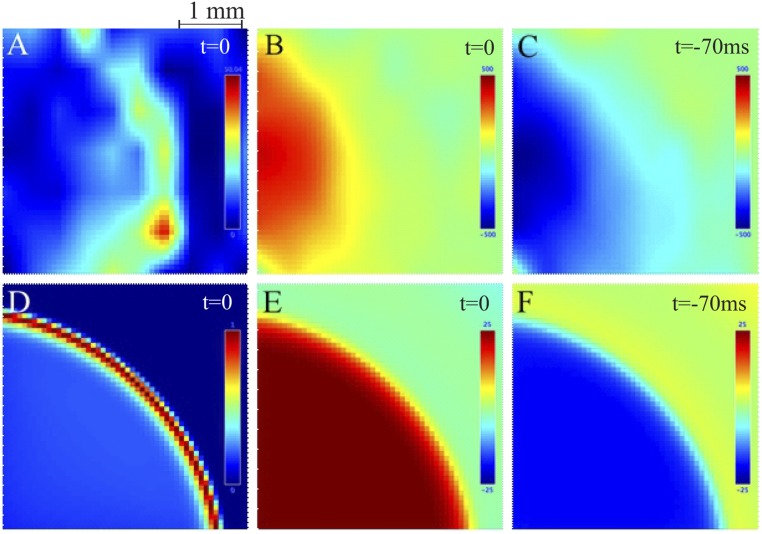
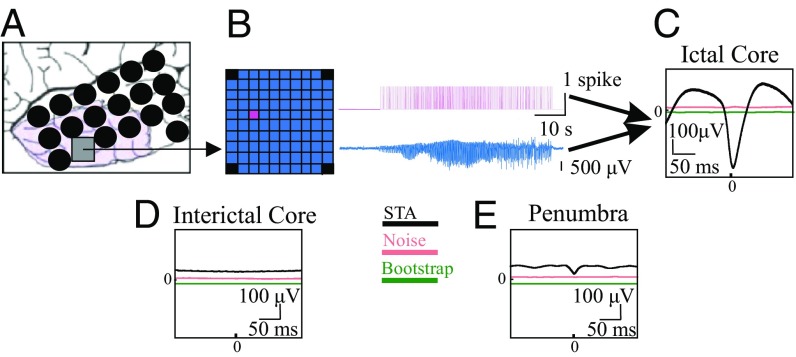
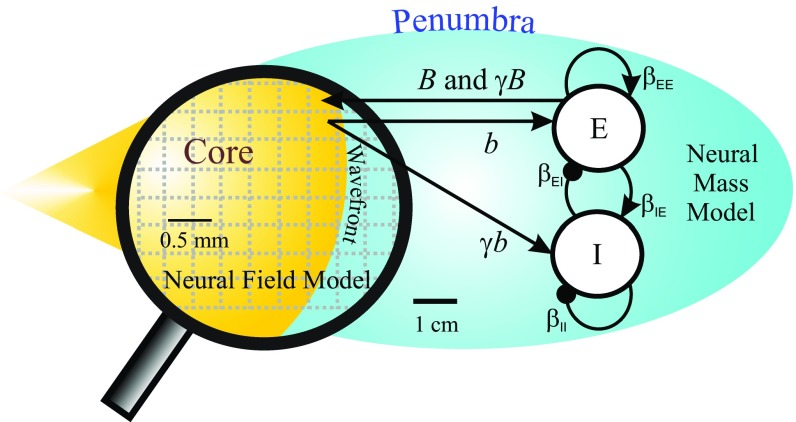
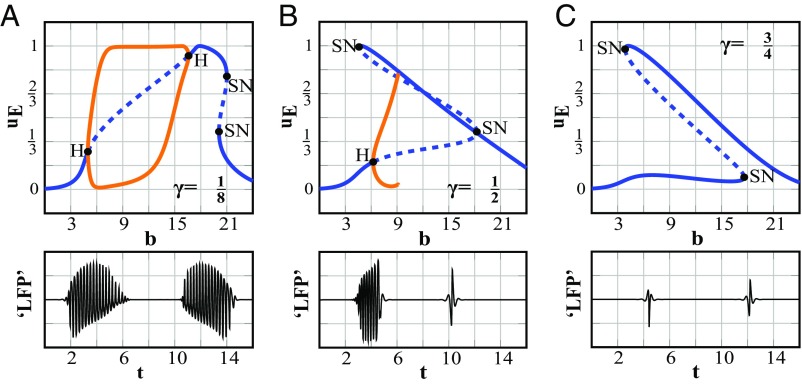
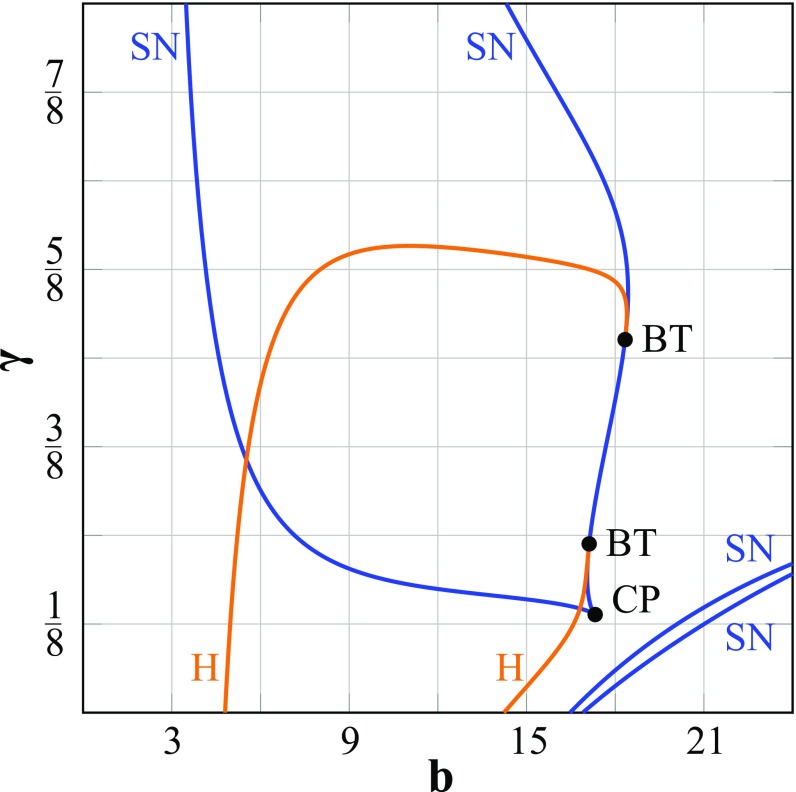
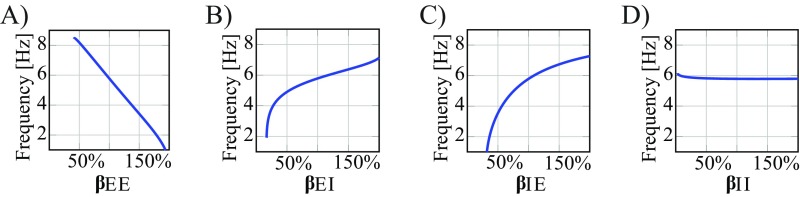
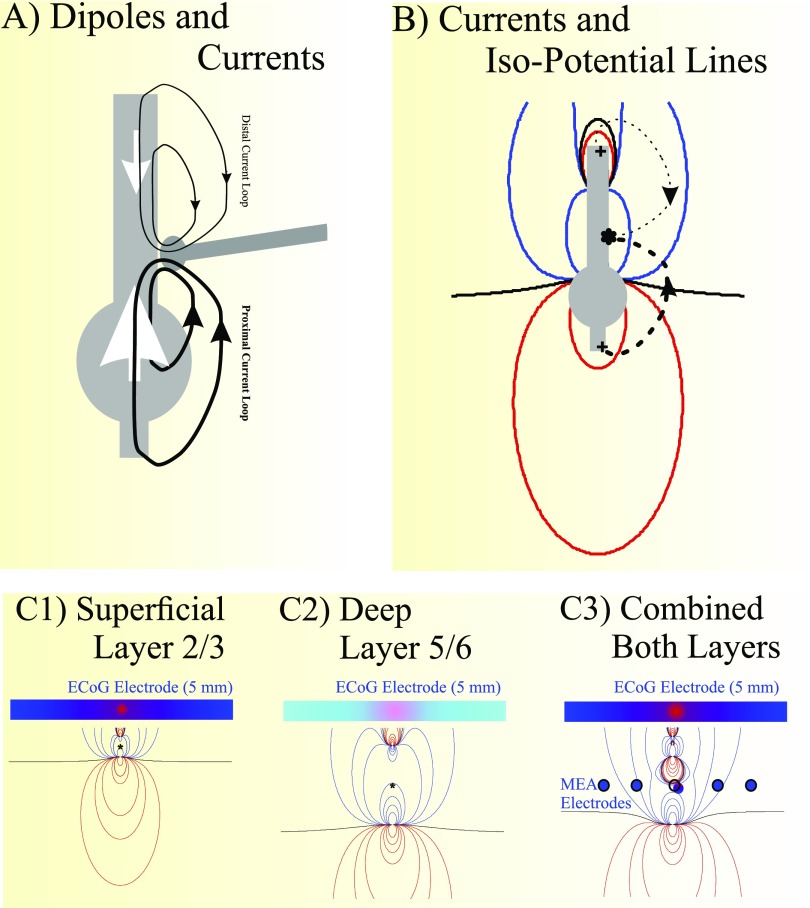
Small-scale neuronal networks may impose widespread effects on large network dynamics. To unravel this relationship, we analyzed eight multiscale recordings of spontaneous seizures from four patients with epilepsy. During seizures, multiunit spike activity organizes into a submillimeter-sized wavefront, and this activity correlates significantly with low-frequency rhythms from electrocorticographic recordings across a 10-cm-sized neocortical network. Notably, this correlation effect is specific to the ictal wavefront and is absent interictally or from action potential activity outside the wavefront territory. To examine the multiscale interactions, we created a model using a multiscale, nonlinear system and found evidence for a dual role for feedforward inhibition in seizures: while inhibition at the wavefront fails, allowing seizure propagation, feedforward inhibition of the surrounding centimeter-scale networks is activated via long-range excitatory connections. Bifurcation analysis revealed that distinct dynamical pathways for seizure termination depend on the surrounding inhibition strength. Using our model, we found that the mesoscopic, local wavefront acts as the forcing term of the ictal process, while the macroscopic, centimeter-sized network modulates the oscillatory seizure activity.

Keywords: epilepsy; feedforward inhibition; multiscale interactions; nonlinear dynamics; seizures.


Conflict of interest statement

The authors declare no conflict of interest.

Figures

Fig. S1.
Fig. S1.
Example snapshot from a movie of a seizure from patient 2 from ref. . (Upper) LLFP recording from channel 15 (position indicated by the white dot in Lower) showing the seizure onset. Time point of Lower is noted with a red dotted vertical line. (Lower) Spatial representation of the (10 × 10) MEA. The 96 channels in the grid have been linearly interpolated using 56 channels with artifact-free recordings. (Left) Multiunit activity with the corresponding LLFP (2–50 Hz) signal in Right.
Fig. S2.
Fig. S2.
Wavelet decomposition of the LFP around seizure onset shows the evolution of a dominant frequency decrease from 10–11 to 5–6 Hz over time (for example, seizure from patient 1, seizure 1). (A) Microelectrode channel 22. Upper shows raw microelectrode signal; Lower shows the time frequency plot. (B) The same as in A for channel 50. (C) Power over time for all microelectrodes. Note the large increase in power associated with the drop in dominant frequency. (D) Dominant frequencies plotted for all microelectrodes.
Fig. S3.
Fig. S3.
Spatial correlation of spiking and LLFP for the MEA (AC) and simulation (DF) shows similar patterns of activation. (A) A time snapshot, as in Fig. S1, shows the multiunit activity of the wavefront as it crosses the MEA. Color bar denotes amount of multiunit activity. (B) The corresponding LLFP at this time point shows a peak of a positive deflection in the area that the wavefront has already passed. Color bar represents the amplitude (microvolts) of the LLFP: in this case, only the positive amplitudes. (C) Approximately 70 ms earlier or two frames prior with a resolution of ∼35 ms per frame, which corresponds to one-half a period for the dominant seizure frequency in the theta band within the resolution of this analysis. Note that the LLFP shows strong amplitudes that correspond with the trough of the preceding negative deflection. Color bar is representative of LLFP amplitude. DF portray the same results as in AC for our simulated wavefront and LFP.
Fig. 1.
Fig. 1.
Spikes in the ictal core show a strong correlation with the LFP. (A) Example schematic of the MEA (gray square) and ECoG grid (black circles) placement for patient 1. Purple area denotes tissue that was later resected. (B) Cartoon MEA. Spike raster from a microelectrode is shown in magenta. Pseudo-ECoG signal (averaged LFP across the MEA) is shown in blue. (C) Example STA from spiking in the ictal core (black) with the noise estimates: with or without average (pink) and bootstrapped average (green). STAs and bootstraps were found to be significantly different (P < 0.0001) for all seizures recorded in the core (two patients, four seizures). (D) Example STA from interictal spike times. (E) Example STA from penumbral spike train (patient 4). Note that the noise estimate and bootstrap in CE are slightly shifted from their zero mean to make them visible.
Fig. S4.
Fig. S4.
(Upper) Pseudo-ECoG STA using the entire seizure (black) or postrecruitment interval (cyan). (Lower) Amplitude spectra for the pseudo-ECoG in both epochs. Lower shows the similarity between spectra.
Fig. S5.
Fig. S5.
The pseudo-ECoG STAs for all seizures. Patients 1 and 2 had MEAs placed in the core and show large-amplitude STAs, including oscillations at the dominant seizure frequency in the theta band (5–8 Hz). In contrast, penumbra patients (3, 4) show low-amplitude STAs without strong oscillatory components.
Fig. 2.
Fig. 2.
Example of STAs from the core (patient 1) with long-range correlations between the spike train and ECoG. Each panel depicts the STA (black) from the ECoG electrode at that position and a bootstrapped noise estimate (green). Colored borders reference geodesic distance from MEA. Upper shows the lateral view; Lower is the corresponding basal view. *Electrode used for the core STA in Fig. S6.
Fig. 3.
Fig. 3.
Core shows strong long-range correlations. (A) rms Values of the example STAs in Fig. 2 are plotted vs. their distance from the MEA. Each point refers to an rms value from a single ECoG electrode. Colors of the points correspond with approximate distances from the MEA shown in Fig. 2. Zero distance refers to the STA at the MEA (pseudo-ECoG STA). The black trace connects the mean and SEM for patient 1’s STAs; the green trace shows mean and SEM of the bootstrapped noise estimates. STAs and bootstraps were significantly different (P < 0.0001) for all seizures recorded in the core. The rms values for the first 4 cm also show a strong distance-dependent drop off in amplitude (r = −0.53, P < 0.01 for seizure 1, patient 1). (B) Mean and SEM rms are consistent across patients: the black traces are from the ictal core (patients 1 and 2), and the red/pink traces are from the penumbra (patients 3 and 4).
Fig. S6.
Fig. S6.
Comparison of example STAs from ECoG signals created from spiking in the core (black) and from spiking in the penumbra (gray).
Fig. 4.
Fig. 4.
STAs are composed of a sinusoidal base and a remainder term. (A) Example pseudo-ECoG STA shows wavefront spiking effects that can be observed as the difference (magenta) between the STA (black) and a sinusoidal base (green). Lower represents the amplitude spectrum of the STA. *Local minimum, which we interpret as representing excitatory activity (SI Materials and Methods). (B) Example as in A from an ECoG electrode 1 cm from the MEA. Cross denotes local maximum, which we interpret as local inhibitory activity. (C) Example as in A from an ECoG electrode at a distance of 4 cm.
Fig. S7.
Fig. S7.
Normalized power spectra for all ECoG electrodes implanted in patient 1 during seizure 1. Note that all channels show a large spike in power around 6 Hz, the identified dominant seizure frequency and the dominant frequency observed on the corresponding STAs.
Fig. 5.
Fig. 5.
Schematic of the multiscale model (reinterpreted from figure 1B in ref. 4). The model consists of a mesoscopic neural field model for the propagating wavefront that is connected to a neural mass model representing the surrounding macroscopic network. Mutual excitatory effects between the wavefront and neural mass model are represented by b and B, respectively. The activation of the inhibitory populations’ response, feedforward inhibition, is governed by γ[0,1]. Additional details on the parameters can be found in SI Materials and Methods.
Fig. 6.
Fig. 6.
Bifurcation analysis evaluates the role of feedforward inhibition activated by the wavefront at the macroscale. Upper shows the input (b)-dependent dynamics for the macroscopic activity uE as bifurcation plots. Lower shows corresponding LFP signals generated when the input b is increased and then decreased. LFP signals were filtered with conventional EEG filters. (A) For γ=1/8, the stationary state undergoes a Hopf bifurcation (H), described by a periodic orbit (orange traces), for increasing input b. When the input is increased further, the ictal state is replaced by a strong depolarized state and SN bifurcation. When the input decreases, the same trajectory is passed through but in reversed order as seen by the two sets of oscillations in the LFP signal of Lower. (B) For γ=1/2, uE undergoes a Hopf bifurcation into the ictal state, and the ictal state is replaced by a strong activated state via a homoclinic bifurcation for increasing values of the input. When the input decreases, the strong activated state falls back to the initial rest state via an SN bifurcation. The LFP shows the distinct paths from seizure onset and offset in Lower. Note that input b is varied to produce the dynamics, and therefore, the interval between simulated seizure onset and offset is arbitrary. (C) When γ=3/4, only transients are present in the simulated trace.
Fig. S8.
Fig. S8.
A two-parameter analysis shows how the bifurcation scenario of the macroscopic network depends on the degree of feedforward inhibition γ. The overall network input is determined by b. Note that the diagrams in Fig. 6 show the bifurcation analysis for the activity levels as a function of b and for γ = 1/8, 1/2, and 3/4. BT, Bogdanov–Takens bifurcation; CP, cusp point; H, Hopf bifurcation.
Fig. S9.
Fig. S9.
Dominant frequency at seizure onset is affected by the connectivity parameters at the macroscale as a function of (A) excitatory–excitatory connections, (B) excitatory–inhibitory connections, (C) inhibitory–excitatory connections, and (D) inhibitory–inhibitory connections.
Fig. S10.
Fig. S10.
(A) Cartoon of a neuron with excitatory synaptic activation showing current loops (black traces) moving to the distal and proximal ends of the neuron and the associated vertical current dipole representation (white arrows). (B) Where activation occurs and current enters the cell (asterisk), the synaptic activity gives rise to current loops (dashed lines), and a potential field is generated: positive isopotential lines (red), negative isopotential lines (blue), and zero isopotential lines (black). Where the current enters the cell, the extracellular potential is negative, and where it exits the cell (e.g., +), the potential is positive (or less negative). Current flows according to the potential gradient. C1 shows the isopotential lines of a superficially (layer 2/3) located neuron, C2 shows the isopotential lines for a deep (layer 5/6) cell, and C3 is the combined effect of both. Note that the top part of the field is truncated at the cortical surface where a 5-mm-sized ECoG electrode samples the average potential across its surface. Although the effects of deep sources are more attenuated than superficial effects, the size of the positive potentials at its surface is larger for the deep source compared with the superficial one. A number of MEA microelectrodes used to compute the pseudo-ECoG are shown in C3. The average potentials picked up by the ECoG electrodes are dominated by the negative part of the potential distribution, similar to what is recorded by the MEA electrodes.

References

    1. Smith EH, et al. The ictal wavefront is the spatiotemporal source of discharges during spontaneous human seizures. Nat Commun. 2016;7:11098. - PMC - PubMed
    1. Schevon CA, et al. Evidence of an inhibitory restraint of seizure activity in humans. Nat Commun. 2012;3:1060. - PMC - PubMed
    1. Kramer MA, Cash SS. Epilepsy as a disorder of cortical network organization. Neuroscientist. 2012;18:360–372. - PMC - PubMed
    1. Weiss SA, et al. Ictal high frequency oscillations distinguish two types of seizure territories in humans. Brain. 2013;136:3796–3808. - PMC - PubMed
    1. Martinet LE, et al. Human seizures couple across spatial scales through travelling wave dynamics. Nat Commun. 2017;8:14896. - PMC - PubMed

Publication types

MeSH terms