. 2017 Oct 3;114(40):E8528-E8536.
doi: 10.1073/pnas.1704189114. Epub 2017 Sep 18.

BPM-CUL3 E3 ligase modulates thermotolerance by facilitating negative regulatory domain-mediated degradation of DREB2A in Arabidopsis

Affiliations

BPM-CUL3 E3 ligase modulates thermotolerance by facilitating negative regulatory domain-mediated degradation of DREB2A in Arabidopsis

Kyoko Morimoto et al. Proc Natl Acad Sci U S A. .

Abstract

DEHYDRATION-RESPONSIVE ELEMENT BINDING PROTEIN 2A (DREB2A) acts as a key transcription factor in both drought and heat stress tolerance in Arabidopsis and induces the expression of many drought- and heat stress-inducible genes. Although DREB2A expression itself is induced by stress, the posttranslational regulation of DREB2A, including protein stabilization, is required for its transcriptional activity. The deletion of a 30-aa central region of DREB2A known as the negative regulatory domain (NRD) transforms DREB2A into a stable and constitutively active form referred to as DREB2A CA. However, the molecular basis of this stabilization and activation has remained unknown for a decade. Here we identified BTB/POZ AND MATH DOMAIN proteins (BPMs), substrate adaptors of the Cullin3 (CUL3)-based E3 ligase, as DREB2A-interacting proteins. We observed that DREB2A and BPMs interact in the nuclei, and that the NRD of DREB2A is sufficient for its interaction with BPMs. BPM-knockdown plants exhibited increased DREB2A accumulation and induction of DREB2A target genes under heat and drought stress conditions. Genetic analysis indicated that the depletion of BPM expression conferred enhanced thermotolerance via DREB2A stabilization. Thus, the BPM-CUL3 E3 ligase is likely the long-sought factor responsible for NRD-dependent DREB2A degradation. Through the negative regulation of DREB2A stability, BPMs modulate the heat stress response and prevent an adverse effect of excess DREB2A on plant growth. Furthermore, we found the BPM recognition motif in various transcription factors, implying a general contribution of BPM-mediated proteolysis to divergent cellular responses via an accelerated turnover of transcription factors.

Keywords: DREB2A-interacting proteins; E3 ubiquitin ligase; abiotic stress response; co-IP coupled with LC-MS/MS; posttranslational regulation.


Conflict of interest statement

The authors declare no conflict of interest.

Figures
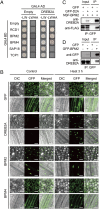
Fig. 1.
Fig. 1.
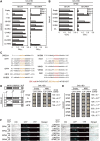
BPM2 is a DREB2A-interacting protein. (A) Validation of interactions between DREB2A and the candidate interactors by Y2H assay. The growth of yeast strains on nonselective medium (−LW) and selective medium (−LWHA) is shown. (B) Subcellular localization of DREB2A, BPM2, and BPM4 in transgenic plants under normal and heat stress conditions. These plants express N-terminal GFP-fused proteins under the control of the 35S promoter. (Upper) Images of true leaves. (Lower) Images of roots. Differential interference contrast (DIC) and GFP fluorescence images as well as merged images are shown. (Scale bars: 20 µm.) (C and D) Validation of interaction between DREB2A and BPM2 by co-IP from transgenic plants either co-overexpressing NSF-BPM2 and GFP-DREB2A (GFP-D2A) in the background of the dreb2a mutant (C) or overexpressing GFP-BPM2 in the WT background (D).
Fig. S1.
Fig. S1.
BPMs directly interact with DREB2A in the nucleus. (A) Silver staining of DREB2A and copurified proteins. Transgenic plants expressing GFP or GFP-DREB2A (GFP-D2A) were subjected to heat stress in the presence of MG132. After co-IP with an anti-GFP antibody, the recovery of proteins was estimated using silver staining. The open and closed arrowheads indicate GFP and DREB2A, respectively. (B) Quantification of yeast growth. Yeast strains were inoculated in the liquid nonselective (−LW) and selective (−LWHA) media. Yeast growth was measured as OD600 values. The error bars indicate the SD from three independent clones. Asterisks indicate significant differences compared with the empty vector: ***P < 0.001, Student’s t test. (C) Subcellular localization of DREB2A, BPM2, and BPM4 in onion epidermal cells. DIC and GFP fluorescence images as well as merged images are shown. (Scale bars: 100 µm.) (D) Interaction between DREB2A and BPMs. DREB2A was N-terminally fused to the N-terminal half of yellow fluorescent protein (YFPN), and BPMs were C-terminally fused to the C-terminal half of YFP (YFPC). CFP was cobombarded as the positive control for gene delivery. BPM2_ΔB and BPM4_ΔB lack the BTB/POZ domain, corresponding to amino acids 179–372 and 194–428, respectively. DIC, YFP fluorescence, and CFP fluorescence images as well as merged images are shown. (Scale bars: 100 µm.) Vec, empty vector. (E) Subcellular localization of BPM4_ΔB-NLS. In BPM4_ΔB-NLS, the C-terminal region of BPM4_ΔB corresponding to amino acids 429–465 of BPM4 was replaced with amino acids 373–406 of BPM2. (Scale bars: 100 µm.) (F) Interaction between DREB2A and BPM4_ΔB-NLS. (Scale bars: 100 µm.) (G) In vitro interaction between BPM2 and DREB2A. The interaction was confirmed through a pull-down assay. The GST or GST-BPM2 protein was incubated with the Trx-6xHis-DREB2A (Trx-His-D2A) protein. The open and closed arrowheads indicate GST and GST-BPM2, respectively.
Fig. 2.
Fig. 2.
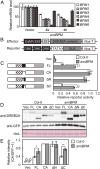
BPM2 interacts with DREB2A by recognizing the SBC motif in NRD. (A) Identification of the BPM2-interacting domain in DREB2A using a Y2H assay. (Left) Schematic diagram of the DREB2A fragments. The numbers indicate the corresponding amino acid residues. AP2, DNA-binding domain; NRD, negative regulatory domain; AD, activation domain; FL, full-length DREB2A; CA, DREB2A CA. (B) Mutation analysis of the SBC motif. (Left) Amino acid sequences of the preys. Underscored bold letters represent the potential SBC motif, and underscored regular letters indicate the mutated residues.
Fig. S2.
Fig. S2.
All BPM family members have the potential to interact with DREB2A via the NRD. (A and B) Quantification of yeast growth. The error bars indicate the SD from three independent clones. Asterisks indicate significant differences compared with the empty vector: ***P < 0.001, Student’s t test. (C) BPM-binding sites in BPM-interacting proteins. The SBC (ϕ-π-S-S/T-S/T) and SBC-like (ϕ-π-S-X-S/T) motifs in the BPM-interacting proteins (DREB1A, ERF1, ERF4, HB5, HB6, HB16, MYB56, MYB89, RAV1, WIND1, WIND2, and WRI1) are indicated. Among these proteins, HB5 and HB6 do not have either motif. (D) Identification of the NRD-interacting domain of BPM2. Interaction of MATH domain (ΔMATH) and BTB domain (ΔBTB) lacking forms of BPM2 with the NRD was evaluated by a colony growth assay and a β-galactosidase assay. Mean (± SD) values of β-galactosidase activity from three independent clones are shown. Asterisks indicate significant differences compared with the empty vector: **P < 0.01, Student’s t test. (E) Interaction between the NRD and all BPM family members. The mean (± SD) values of β-galactosidase activity from three independent clones are shown. Asterisks indicate significant differences compared with the empty vector: **P < 0.01, Student’s t test. (F) Interaction between DREB2A and BPMs in onion epidermal cells. BPM1_ΔB, BPM3_ΔB, BPM5_ΔB, and BPM6_ΔB lack the BTB/POZ domain, with amino acids 180–408, 171–364, 175–371, and 182–378 being deleted, respectively. (Scale bars: 100 µm.)
Fig. S3.
Fig. S3.
DRIP1 and DRIP2 do not affect the NRD-mediated repression of DREB2A activity. (A and B) Identification of the DRIP1/2 interacting domain of DREB2A. Interaction between DREB2A fragments and DRIP1/2 was evaluated by the growth assay on the agar plates (A) and in the liquid medium (B). The error bars indicate the SD from three independent clones. Asterisks indicate significant differences compared with the empty vector: ***P < 0.001, Student’s t test. (C) Transactivation of the reporter gene by DREB2A variants in the drip1 drip2 double mutant. The reporter activity obtained with CA was set to 1. The error bars indicate the SD from three replicate samples.
Fig. 3.
Fig. 3.
Knockdown of BPMs leads to DREB2A accumulation in protoplasts. (A) Expression levels of BPM1-6 in two amiBPM plants. The expression of BPM genes was determined through qRT-PCR analysis. The expression level of each BPM in VC was set to 100. The error bars indicate the SD from triplicate technical repeats. (B) Schematic diagram of the reporter and effector constructs. (C) Transactivation of the reporter gene by DREB2A variants. The error bars indicate the SD from three replicate samples. Asterisks indicate statistically significant differences between reporter activities: **P < 0.01; ***P < 0.001, Student’s t test. ΔN, DREB2A ΔN-NRD; ΔC, DREB2A ΔC-NRD. (D and E) Protein accumulation levels of DREB2A variants. The relative signal intensities of DREB2A variants normalized to the intensity of GFP are shown in (E). The signal intensity obtained with CA was set to 1. The error bars indicate the SD from triplicate experiments. Asterisks indicate significant differences between signal intensity: *P < 0.05; **P < 0.01, Student’s t test. The Rubisco large subunit (rbcL) stained with Ponceau S is shown as a loading control.
Fig. 4.
Fig. 4.
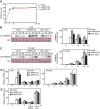
DREB2A hyperaccumulates in the amiBPM plants grown on agar plates under stress conditions. (A and B) Accumulation levels of the DREB2A protein under heat (A) and drought (B) stress. (Left) Immunoblot analysis. (Right) Relative DREB2A band intensity of the immunoblot analysis. The highest intensity was set to 100. The error bars indicate the SD from triplicate experiments. Asterisks indicate significant differences compared with VC: *P < 0.05; **P < 0.01, Student’s t test. (C) Accumulation of the DREB2A protein during heat stress treatment in the presence of DMSO or CHX. The error bars indicate the SD from triplicate experiments. Asterisks indicate significant differences of signal intensity between DMSO- and CHX-treated samples: *P < 0.05; **P < 0.01, Student’s t test.
Fig. S4.
Fig. S4.
BPM is the major regulator of DREB2A protein stability. (A) Water loss rate during the drought stress treatment. The VC and amiBPM plants were air-dried using the same methods as shown in Fig. 4B. Water loss is indicated as the percentage of initial fresh weight. The error bars indicate the SD from triplicate experiments. (B and C) The effect of DRIP1/2 on the degradation of the DREB2A protein under stress conditions. The accumulation of DREB2A in amiBPM and the drip1 drip2 double mutant under heat (B) and drought (C) stress. (Left) Immunoblot analysis. (Right) Relative DREB2A band intensity of the immunoblot analysis. The highest intensity was set to 100. The error bars indicate the SD from triplicate experiments. Asterisks indicate significant differences compared with VC: *P < 0.05; **P < 0.01, Student’s t test. ns, not significant (P > 0.05, Student’s t test). (D and E) Expression levels of DREB2A under heat or drought stress (D) or under heat stress in the presence of CHX (E). The expression of DREB2A was determined through qRT-PCR. The highest expression level was set to 100. The error bars indicate the SD from triplicate technical repeats. Asterisks indicate significant differences compared with VC: *P < 0.05; **P < 0.01, Student’s t test.
Fig. 5.
Fig. 5.
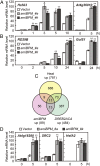
Knockdown of BPMs enhances the expression of DREB2A target genes. (A and B) Expression levels of DREB2A downstream genes under heat (A) and drought (B) stress conditions determined through qRT-PCR. The highest expression level was set to 100 for each gene. The error bars indicate the SD from triplicate technical repeats. Asterisks indicate significant differences compared with VC: *P < 0.05; **P < 0.01, Student’s t test. (C) Venn diagram comparing up-regulated genes among the heat stress-treated amiBPM, the heat stress-treated WT, and the DREB2A CA overexpressor. (D) Expression levels of DREB2A-downstream heat-inducible genes up-regulated in the microarray analysis. HsfA2 is a negative control gene regulated via DREB2A-independent pathways. The error bars indicate the SD from triplicate technical repeats. Asterisks indicate significant differences compared with VC: *P < 0.05; **P < 0.01, Student’s t test.
Fig. 6.
Fig. 6.
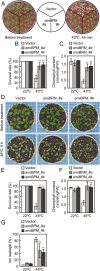
Knockdown of BPMs confers thermotolerance. (A–C) Thermotolerance test of the amiBPM plants on agar plates. (A) Images of plants before (Left) and after (Right) heat shock (43 °C for 45 min). (B) Survival rate of the control (22 °C) and heat-stressed (43 °C) plants. The error bars indicate the SD from nine replicates (n = 17 each). Asterisks indicate significant differences between amiBPM and VC plants: **P < 0.01, Student’s t test. (C) Chlorophyll content of control and heat-stressed plants. The error bars indicate the SD from at least three replicates. Asterisks indicate significant differences between amiBPM and VC plants: **P < 0.01, Student’s t test. (D–G) Thermotolerance test of the amiBPM plants on soil. (D) Images of plants before (Top) and after (Bottom) heat shock (45 °C for 5 h). (E) Survival rates of control (22 °C) and heat-stressed (45 °C) plants. The error bars indicate the SD from three replicates (n = 56 total). Chlorophyll content (F) and ion leakage (G) of control and heat-stressed plants are shown with error bars indicating the SD from at least three replicates. Asterisks indicate significant differences between amiBPM and VC plants: **P < 0.01, Student’s t test.
Fig. S5.
Fig. S5.
Improvement of thermotolerance caused by BPM knockdown is negated by knockout of DREB2A. (A) Expression levels of BPM1-6 in the amiBPM/dreb2a plants. The error bars indicate the SD from triplicate technical repeats. (B) HsfA3 expression in the amiBPM/dreb2a plants under heat stress. Asterisks indicate significant differences compared with VC/WT: **P < 0.01, Student’s t test. (C–E) Thermotolerance test of the amiBPM/dreb2a plants. (C) Images of plants before (Left) and after (Right) heat shock (43 °C for 45 min). (D) Survival rate of control (22 °C) and heat-stressed (43 °C) plants. The error bars indicate the SD from four replicates (n = 15 each). (E) Chlorophyll content of control and heat-stressed plants. The error bars indicate the SD from at least three replicates.
Fig. S6.
Fig. S6.
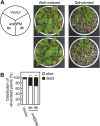
BPM knockdown causes decreased drought stress tolerance. (A and B) Drought-tolerance test of the amiBPM plants. (A) Images of well-watered (Left) and dehydrated (Right) plants. (B) Percentage of plants in different phenotype classes. Asterisks indicate significantly different distribution from VC (n = 70): **P < 0.01, Fisher’s exact test.

References

    1. Yamaguchi-Shinozaki K, Shinozaki K. Transcriptional regulatory networks in cellular responses and tolerance to dehydration and cold stresses. Annu Rev Plant Biol. 2006;57:781–803. - PubMed
    1. Ohama N, Sato H, Shinozaki K, Yamaguchi-Shinozaki K. Transcriptional regulatory network of plant heat stress response. Trends Plant Sci. 2017;22:53–65. - PubMed
    1. Covarrubias AA, Reyes JL. Post-transcriptional gene regulation of salinity and drought responses by plant microRNAs. Plant Cell Environ. 2010;33:481–489. - PubMed
    1. Miura K, Hasegawa PM. Sumoylation and other ubiquitin-like post-translational modifications in plants. Trends Cell Biol. 2010;20:223–232. - PubMed
    1. Lyzenga WJ, Stone SL. Abiotic stress tolerance mediated by protein ubiquitination. J Exp Bot. 2012;63:599–616. - PubMed

Publication types

MeSH terms