. 2017 Oct 3;114(40):10542-10547.
doi: 10.1073/pnas.1708161114. Epub 2017 Sep 18.

Multiscale characterization of the mineral phase at skeletal sites of breast cancer metastasis

Affiliations

Multiscale characterization of the mineral phase at skeletal sites of breast cancer metastasis

Frank He et al. Proc Natl Acad Sci U S A. .

Abstract

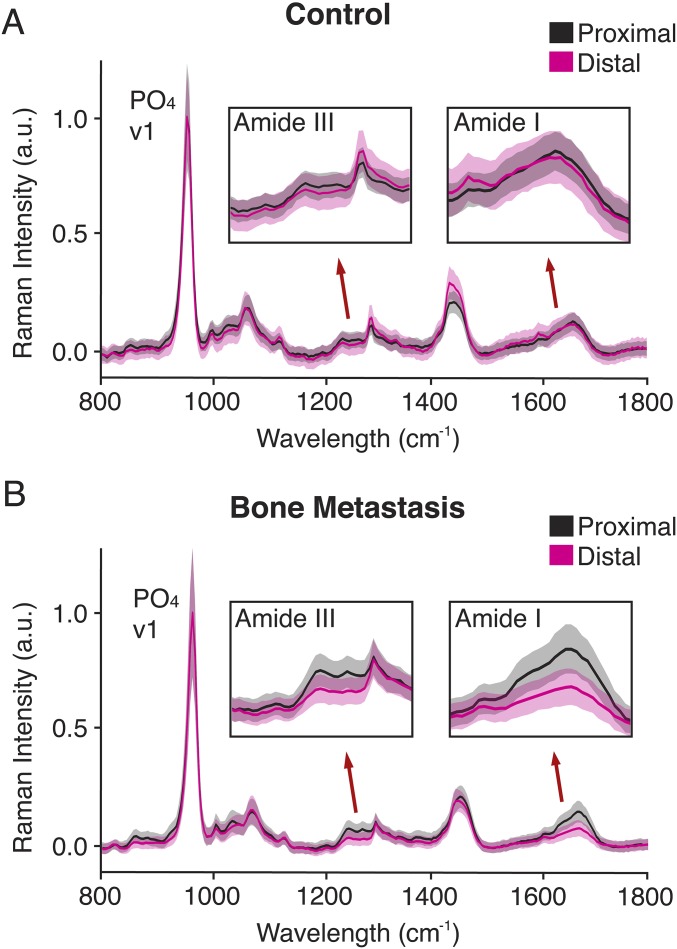
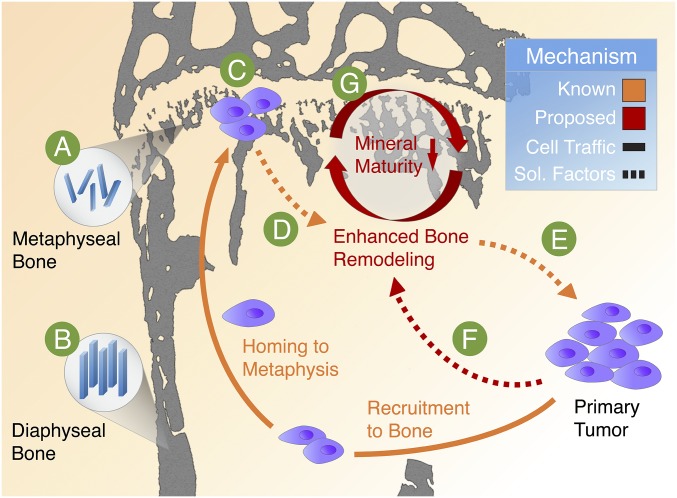
Skeletal metastases, the leading cause of death in advanced breast cancer patients, depend on tumor cell interactions with the mineralized bone extracellular matrix. Bone mineral is largely composed of hydroxyapatite (HA) nanocrystals with physicochemical properties that vary significantly by anatomical location, age, and pathology. However, it remains unclear whether bone regions typically targeted by metastatic breast cancer feature distinct HA materials properties. Here we combined high-resolution X-ray scattering analysis with large-area Raman imaging, backscattered electron microscopy, histopathology, and microcomputed tomography to characterize HA in mouse models of advanced breast cancer in relevant skeletal locations. The proximal tibial metaphysis served as a common metastatic site in our studies; we identified that in disease-free bones this skeletal region contained smaller and less-oriented HA nanocrystals relative to ones that constitute the diaphysis. We further observed that osteolytic bone metastasis led to a decrease in HA nanocrystal size and perfection in remnant metaphyseal trabecular bone. Interestingly, in a model of localized breast cancer, metaphyseal HA nanocrystals were also smaller and less perfect than in corresponding bone in disease-free controls. Collectively, these results suggest that skeletal sites prone to tumor cell dissemination contain less-mature HA (i.e., smaller, less-perfect, and less-oriented crystals) and that primary tumors can further increase HA immaturity even before secondary tumor formation, mimicking alterations present during tibial metastasis. Engineered tumor models recapitulating these spatiotemporal dynamics will permit assessing the functional relevance of the detected changes to the progression and treatment of breast cancer bone metastasis.

Keywords: Raman imaging; X-ray scattering; bone metastasis; bone mineral nanostructure; breast cancer.


Conflict of interest statement

The authors declare no conflict of interest.

Figures

Fig. 1.
Fig. 1.
Experimental setup for multiscale analysis of bone hierarchical structure. Different stages of human breast cancer were modeled in immunocompromised nude mice. To achieve bone metastasis, luciferase-labeled BoM1-2287 cells were intracardially injected, while injection into cleared mammary fat pads resulted in localized mammary tumors without overt metastasis. Mouse tibiae harvested after 5 or 7 wk were embedded in PMMA and subjected to μCT, histological analysis, and backscattered BSE to assess macro- to microscale changes in bone structure. SAXS and WAXS as well as large-area Raman imaging were used to characterize bone nanostructure and physicochemical composition.
Fig. S1.
Fig. S1.
X-ray scattering analysis setup. (A and B) Bone specimens are exposed to highly collimated X-rays in a stepwise manner on the x and y plane perpendicular to the direction of the incident beam. The scattered light registers on a 2D detector and can then be used to derive information about mineral nanostructure. Laboratory-based SAXS analysis (A) provides information about mineral orientation (ρ) and thickness (T). Synchrotron-based SAXS/WAXS analysis (B) provides enhanced spatial resolution and, in addition to orientation and thickness, information about mineral nanocrystal length (L) derived from the width of the 002 peak.
Fig. 2.
Fig. 2.
Laboratory-based SAXS analysis of tibiae from healthy mice shows that HA nanocrystals in the metaphysis are more immature than ones in the diaphysis. (A) X-ray scattering techniques provide information on bone mineral nanostructure. (B) Correlation analysis between T-parameter and ρ-parameter as determined by simple linear regression. Data points represent individual measurements. The data are color-partitioned into two regions of interest (Diph, diaphysis; Mtph, metaphysis). (C and D) Spatial representation of quantitative data. Representative ρ-parameter (mean mineral crystal orientation) (C) and T-parameter (mean mineral crystal thickness) (D) data are overlaid on corresponding BSE images. Color scales: Warmer colors indicate greater crystal orientation (C) or thickness (D). Box-and-whisker plots of all ρ-parameter (C) and T-parameter (D) data from the regions of interest. Whiskers represent the 5th percentile and the 95th percentile. Outlier data points are depicted as dots. *P < 0.05, **P < 0.001.
Fig. 3.
Fig. 3.
Multiscale characterization of the bone metastatic site identifies changes in the ECM associated with secondary tumor formation. (A–D) Macro- to microscale qualitative analysis: Representative μCT images (A and C) and Movat’s pentachrome (MP)-stained cross-sections (B and D). Color legend of the MP stain: yellow, bone; green, calcified cartilage; black, nuclei; intense red, muscle; red/pink, fibrous tissue. The metastasized tumor is highlighted by the black asterisk and outlined with dashed lines (D). (E–J) Nanoscale quantitative analysis: large-area Raman imaging of defined regions (black insets) (E and H). ‟Prox” and ‟Dist” (E, F, H, and I) indicate bone on the proximal (i.e., the epiphysis) and distal (i.e., the metaphysis) sides of the growth plate, respectively. The metastasized tumor is highlighted by the black asterisk and outlined with dashed lines (H). False color heat maps (F and I): Blue and red depict the intensities of the PO4 v1 and amide I peaks, respectively. Mean Raman spectra (bold line: means; fill areas: SD) (G and J) of the indicated bone regions with insets (range: 1,600–1,700 cm−1) highlighting the amide 1 peak (1,677 cm−1).
Fig. S2.
Fig. S2.
Mouse models of advanced breast cancer. To determine localization via bioluminescence imaging, luciferase-expressing bone metastatic breast cancer cells (BoM1-2287) were used in both conditions. (A) Injection of tumor cells into the left ventricle of the heart consistently resulted in metastasis to the hind limbs and to the brain. The animal is shown in dorsal recumbency. Tibiae were harvested 5 wk postsurgery. (B) Injection of tumor cells into a pair of contralateral mammary fat pads resulted in localized tumors only. No macrometastatic colonies were observed using this method. The animal is shown in ventral recumbency. Tibiae were harvested 7 wk postsurgery. (C) Average body weights 1 d before bone harvest. Ctrl, control mice; Tumor, mammary fat pad-injected mice. In the Tumor group, the weight of the tumor was subtracted from the total weight. P = 0.41. (D) Average growth plate thicknesses in the proximal tibiae. P = 0.73. (C and D) Data are means ± SD (n = 4). Student’s t test was used to confirm statistical significance between groups. Statistical analysis was performed in Graphpad Prism 5 (GraphPad Software).
Fig. S3.
Fig. S3.
Representative Movat’s pentachrome (MP)-stained cross-sections show massive destruction of metaphyseal trabecular bone and severe disruption of the epiphyseal chondrocytes in tibiae with metastasis. (A and B) Color legend of the MP stain: yellow, bone; green, calcified cartilage; black, nuclei; red/pink, fibrous tissue. “GP” refers to the location of the growth plate. Prox and Dist indicate bone on the proximal (i.e., the epiphysis) and distal (i.e., the metaphysis) sides of the growth plate, respectively. The metastasized tumor (B) is highlighted by the black asterisk and outlined with dashed lines.
Fig. S4.
Fig. S4.
The metaphysis experiences severe degradation during bone metastasis while the diaphysis remains unaffected. Representative BSE images of the proximal tibia (A–D) and diaphysis (E and F) from control mice (A and C) and mice with bone metastasis (B and D). C and D show the regions defined by the red insets in A and B, respectively. GP labels the growth plate.
Fig. S5.
Fig. S5.
Collagen type I content is decreased in metaphyseal bone that is interfacing with the secondary tumor. Raman spectroscopy of bone proximal (i.e., the epiphysis) and distal (i.e., the metaphysis) to the growth plate in control (A) and bone metastasis (B) conditions. Mean Raman spectra with insets (1,200–1,330 cm−1; 1,600–1,700 cm−1) highlighting the amide III (1,256 cm−1) and amide I (1,677 cm−1) peaks, respectively. The bold lines represent the means and the fill areas represent the respective SDs.
Fig. S6.
Fig. S6.
Large-area Raman imaging indicates that the phosphate-to-amide ratio (PO4/Amide I) is increased in metaphyseal bone interfacing with a secondary tumor. (A) PO4/Amide I as a function of distance from the growth plate. The bold lines represent the means and the fill areas represent the respective SDs. (B) PO4/Amide I visualized by heat maps of the region highlighted in the red insets. Bone Mets, bone metastasis; Ctrl, control. BSE images: GP labels the growth plate. The metastasized tumor is indicated by the white asterisk and outlined with dashed lines. Raman heat maps (RAMAN): ‟Distance” refers to the proximity to the growth plate. Lighter colors indicate a greater phosphate-to-amide ratio.
Fig. S7.
Fig. S7.
Large-area Raman imaging indicates that metaphyseal bone mineral crystallinity (FWHM−1 * 100 of the PO4 v1 peak) is decreased in mice with localized mammary tumors as well as in mice with bone metastasis. (A) Crystallinity as a function of distance from the growth plate. The bold lines represent the means and the fill areas represent the respective SDs. (B) Crystallinity visualized by heat maps of the region highlighted in the red insets. Bone Mets, bone metastasis; Ctrl, control; Mam Tumor, mammary tumor. BSE images: GP labels the growth plate. The metastasized tumor is indicated by the white asterisk and outlined with dashed lines. Raman heat maps (RAMAN): Distance refers to the proximity to the growth plate. Lighter colors indicate greater mineral crystallinity.
Fig. S8.
Fig. S8.
Macro- to microscale analysis of metaphyseal bone suggests no structural differences between control mice and mice with mammary tumors. (A) Representative images of Movat’s pentachrome-stained cross-sections and BSE images of comparable regions of trabecular bone in the proximal tibia. (B) μCT analysis of the trabecular bone highlighted in dark purple. Graphs represent the means ± SD of BV/TV, Tb.Th, and Tb.Sp data.
Fig. 4.
Fig. 4.
Scanning synchrotron-based SAXS/WAXS analysis of metaphyseal tissue bordering the growth plate reveals shorter HA nanocrystals in mice carrying mammary tumors. (A) Representative BSE images of the region of interest. Prox and Dist indicate the proximal and distal sides of the growth plate, respectively. (B–D) Spatial representation of quantitative data. Box-and-whisker plots summarize all L-parameter (mean mineral crystal length) (B), ρ-parameter (mean mineral crystal orientation) (C), and T-parameter (mean mineral crystal thickness) (D) data. Whiskers represent the 5th and the 95th percentile. Outlier data points are depicted as dots. *P < 0.05. n.s. indicates nonsignificance. Representative L-parameter (B), ρ-parameter (C), and T-parameter (D) data are overlaid on corresponding BSE images. Color scales: Warmer colors indicate greater crystal length (B), orientation (C), or thickness (D).
Fig. S9.
Fig. S9.
Tumor-secreted factors can promote osteogenic activity. (A) Representative Picrosirius Red-stained cross-sections of metaphyseal trabecular bone in tibiae harvested from control mice (Control) or mice injected with media conditioned by parental MDA-MB-231 (TCM) cells. The growth plate border is indicated by the white dotted line. Graphs represent the back-transformed predicted means with 95% confidence interval of green and red integrated density measurements for thin/immature and thick/mature collagens, respectively. Data are normalized to regions of diaphyseal bone. *P < 0.05. (B) Representative TRAP-stained (pink) cross-sections (with hematoxylin counterstain) of either control or TCM tibiae. Graphs represent quantification (mean ± SD) of number of osteoclasts normalized to bone perimeter (N.Oc/B.Pm). (C) Representative images of ARS in bone marrow-derived MSCs treated with control media (Control) or conditioned media from parental MDA-MB-231 breast cancer cells (TCM) or BoM1-2287 (Bone-TCM). Red color indicates positive stain for matrix calcification. Graphs represent mean ± SD of ARS extracted from stained matrices. *P < 0.05.
Fig. 5.
Fig. 5.
Proposed functional relationship between HA mineral characteristics and breast cancer bone metastasis. In mice, breast cancer cells typically colonize the metaphysis in the metabolically active proximal tibia. We show that mineral in metaphyseal bone (A) is less mature (i.e., smaller, less-perfect, and less-oriented) relative to other skeletal locations (B) not prone to initiation of metastasis. Because previous in vitro findings show that tumor cells preferentially adhere to less-mature crystals, we propose that this difference in mineral properties may be functionally relevant to the establishment of a tumor colony (C). The metastasized tumor cells can then disrupt typical bone remodeling processes (D) to result in the aberrant activity of bone cells and the increased release of tumor-recruiting soluble factors (E). Furthermore, breast cancer cells located within primary tumors can stimulate bone remodeling by secreting circulating factors (F) that enhance local osteogenesis and, thus, alter the composition and structure of the bone ECM. Here, we propose that these premetastatic changes lead to the deposition of a less-mature mineral phase (G) which may be essential in driving the vicious cycle of osteolytic bone metastasis.

Similar articles

Cited by

References

    1. Kozlow W, Guise TA. Breast cancer metastasis to bone: Mechanisms of osteolysis and implications for therapy. J Mammary Gland Biol Neoplasia. 2005;10:169–180. - PubMed
    1. Ren G, Esposito M, Kang Y. Bone metastasis and the metastatic niche. J Mol Med (Berl) 2015;93:1203–1212. - PMC - PubMed
    1. Weilbaecher KN, Guise TA, McCauley LK. Cancer to bone: A fatal attraction. Nat Rev Cancer. 2011;11:411–425. - PMC - PubMed
    1. Wang H, et al. The osteogenic niche promotes early-stage bone colonization of disseminated breast cancer cells. Cancer Cell. 2015;27:193–210. - PMC - PubMed
    1. Fratzl P, Gupta HS, Paschalis EP, Roschger P. Structure and mechanical quality of the collagen-mineral nano-composite in bone. J Mater Chem. 2004;14:2115–2123.

Publication types

MeSH terms

LinkOut - more resources