. 2017 Oct 3;114(40):E8411-E8420.
doi: 10.1073/pnas.1704962114. Epub 2017 Sep 18.

IgH isotype-specific B cell receptor expression influences B cell fate

Affiliations

IgH isotype-specific B cell receptor expression influences B cell fate

Pei Tong et al. Proc Natl Acad Sci U S A. .

Erratum in

Abstract

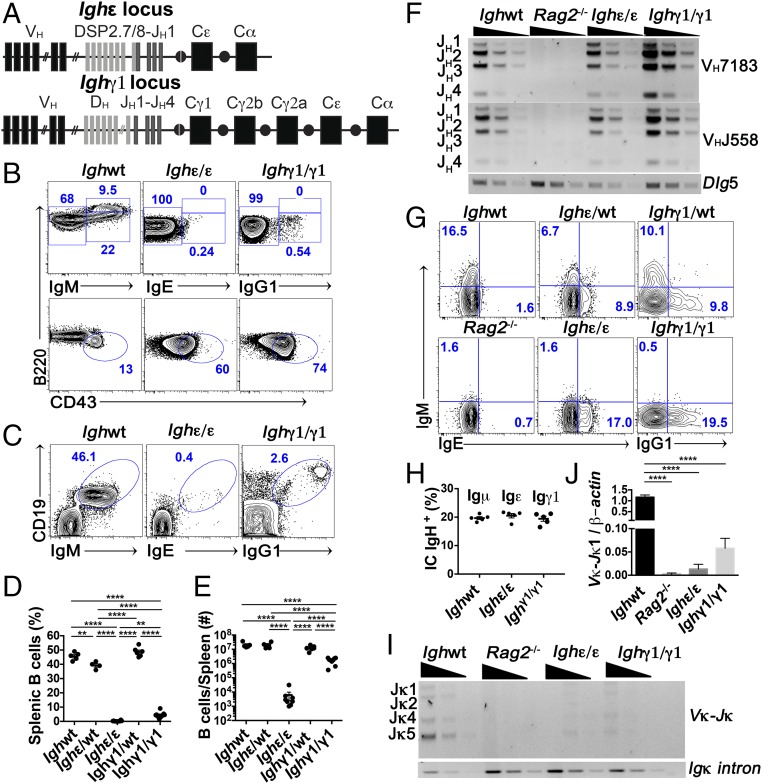
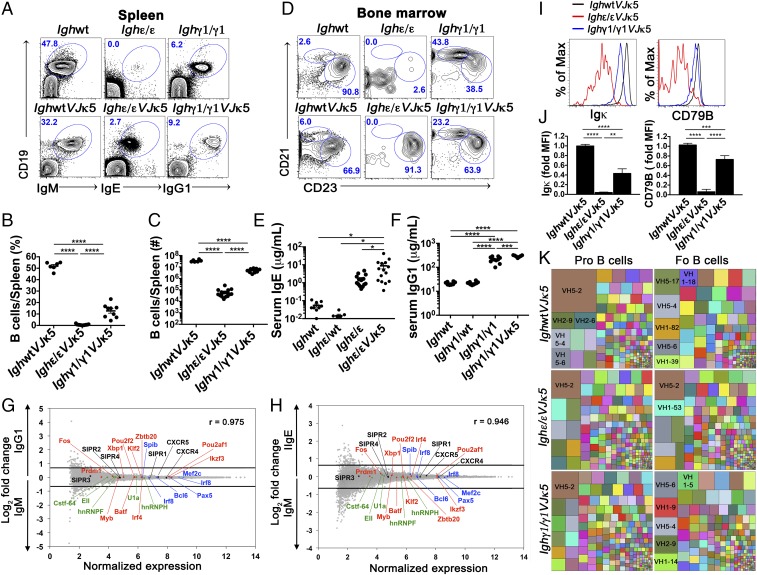
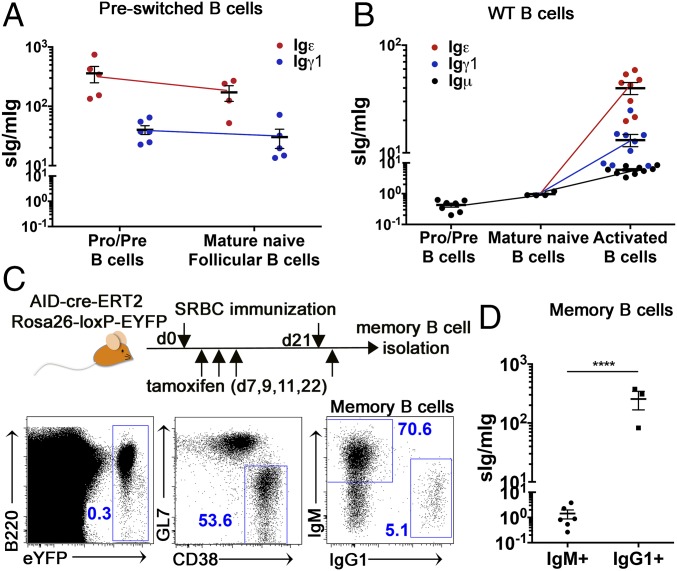
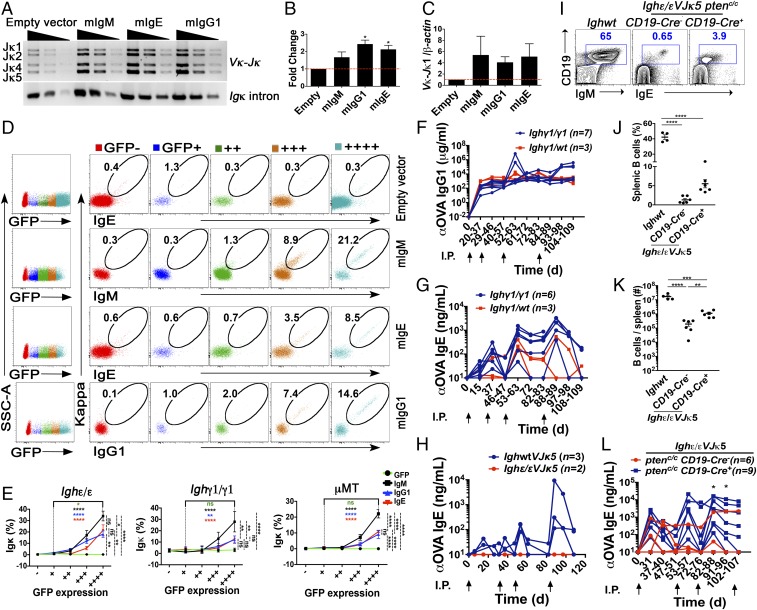
Ig heavy chain (IgH) isotypes (e.g., IgM, IgG, and IgE) are generated as secreted/soluble antibodies (sIg) or as membrane-bound (mIg) B cell receptors (BCRs) through alternative RNA splicing. IgH isotype dictates soluble antibody function, but how mIg isotype influences B cell behavior is not well defined. We examined IgH isotype-specific BCR function by analyzing naturally switched B cells from wild-type mice, as well as by engineering polyclonal Ighγ1/γ1 and Ighε/ε mice, which initially produce IgG1 or IgE from their respective native genomic configurations. We found that B cells from wild-type mice, as well as Ighγ1/γ1 and Ighε/ε mice, produce transcripts that generate IgM, IgG1, and IgE in an alternative splice form bias hierarchy, regardless of cell stage. In this regard, we found that mIgμ > mIgγ1 > mIgε, and that these BCR expression differences influence respective developmental fitness. Restrained B cell development from Ighγ1/γ1 and Ighε/ε mice was proportional to sIg/mIg ratios and was rescued by enforced expression of the respective mIgs. In addition, artificially enhancing BCR signal strength permitted IgE+ memory B cells-which essentially do not exist under normal conditions-to provide long-lived memory function, suggesting that quantitative BCR signal weakness contributes to restraint of IgE B cell responses. Our results indicate that IgH isotype-specific mIg/BCR dosage may play a larger role in B cell fate than previously anticipated.

Keywords: B cell; BCR; IgE; antibody; memory.


Conflict of interest statement

The authors declare no conflict of interest.

Figures

Fig. 1.
Fig. 1.
B cell development in Ighε/ε and Ighγ1/γ1 mice is impaired. (A) Schematic representations of the Ighε (Top) and Ighγ1 (Bottom) alleles. (B) FACS plots of live CD19+ and B220+ bone marrow cells (Top plots) as well as live B220+ CD19+ and BCR (Bottom plots). Mature recirculating B cells (B220hi BCR+), immature B cells (B220int BCR+), and pro–B cell (B220lo BCR CD43+) frequencies are indicated (n = 6). (C) FACS plots of splenic lymphocytes showing CD19 expression versus IgM, IgE, or IgG1 from the indicated mice (n = 6). (D and E) Dot graph showing summary statistics of percentages (D), and total number (E), of splenic B cells from the indicated mice. Each dot represents one mouse (n = 4–9). (F) Semiquantitative PCR analyses of JH-proximal VH7183 and JH-distal VHJ558 family rearrangements in sorted bone marrow pro-B cells from indicated mice. Dlg5 was amplified as a loading control. Threefold serial dilutions are shown. Results are typical of three experiments. Bands corresponding to rearrangements to various JH segments are indicated. (G) FACS plots showing intracellular Igμ, Igε, and Igγ1 heavy chain in pro-B cells (CD19+ B220lo Igκ CD43+) from bone marrows of the indicated mice. Results are typical of at least four experiments. (H) Percentage of intracellular Igμ, Igε, and Igγ1 heavy chain in BM pro-B cells. Each dot represents one mouse (n = 5). (I) Semiquantitative PCR analyses of Vκ Igl chain rearrangements in magnetically separated bone marrow B220+ cells from indicated mice. Intronic Igκ was amplified as a loading control. Threefold serial dilutions are shown. Bands corresponding to rearrangements to various Jκ segments are indicated on the Left. Results are typical of four experiments. (J) Quantitative PCR analyses of Vκ to Jκ1 Igl chain rearrangement relative to β-actin DNA in purified B220+ BM cells from the indicated mice. Expression is shown as fold change relative to wild-type levels. **P < 0.01, ****P < 0.0001; one-way ANOVA followed by Tukey’s post hoc test. Summary data are mean values ± SEM. See also SI Appendix, Figs. S1 and S2.
Fig. 2.
Fig. 2.
Development and characteristics of IgE+ and IgG1+ mature B cells with the introduction of a prerearranged Igκ (VJκ5). (A) FACS plots show splenic lymphocytes of the indicated mice. Numbers in the plots indicate percentage of gated live CD19+ BCR+ cells (n = 6). (B and C) Dot graphs showing percentage (B) and absolute number (C) of splenic B cells of indicated mice. (D) FACS plots of live CD19+ B220+ CD93 gated lymphocytes from spleens of the indicated mice to identify splenic marginal zone (CD21hi CD23lo) and follicular (CD21int CD23hi) B cells (n = 6). Because Ighε/εVJκ5 and Ighγ1/γ1VJκ5 mice appear to express higher levels of CD23, the gating is relative within each mouse to identify CD23hi CD21int follicular B cells. Numbers in the plots indicate percentages. (E and F) Total serum IgE (E) and IgG1 (F) concentration measured by ELISA from the indicated mice. Each dot represents individual mice. (G and H) Naïve splenic IgE+ and IgG1+ B cells show similar gene expression pattern to WT naïve IgM B cells. Microarray analysis of sorted B220+ CD93 CD23hi CD21int (follicular) splenic B cells from IghWTVJκ5 (IgM) versus Ighγ1/γ1VJκ5 (IgG1) mice (G), and IghWTVJκ5 (IgM) versus Ighε/εVJκ5 (IgE) mice (H). Selected chemokine receptor genes (black), splicing factors (green), as well as positive (red) and negative (blue) regulators of plasma cell differentiation are shown. Lines represent cutoffs for genes up- or down-regulated by a fold-change of at least 0.67 (log2). The Pearson correlation coefficient (r) between gene expression levels is given for respective plots (n = 3). (I and J) Flow cytometric histogram plots (I) and summary bar graphs (J) of live BCR+ follicular B cells from the indicated mice analyzed for surface Igκ expression (Left of I and J) and CD79B expression (Right of I and J). Fold median fluorescence intensity (MFI) was calculated by dividing MFI values by the average MFI from IgM+ from IghWTVJκ5 mice for each given subset (n = 4–5). *P < 0.05, **P < 0.01, ***P < 0.001, ****P < 0.0001; one-way ANOVA followed by Tukey’s post hoc test. Data are mean values ± SEM. (K) Treemaps showing VH gene segment frequencies in pro- and follicular (Fo) B cells from IghWTVJκ5, Ighε/εVJκ5, and Ighγ1/γ1VJκ5 mice. Each block represents combined data from all biologic repeats (n = 5–6). Within a block, each colored box represents one VH segment. The size of the box is directly proportional to the percentage of sequences, which belongs to the VH segment. The same VH segment has the same color in all of the treemaps and the largest boxes contain the VH name. PCR repeats were removed via unique molecular indexing. See also SI Appendix, Figs. S3–S6.
Fig. 3.
Fig. 3.
Moderate and severe bias to sIg in IgG1 and IgE cells, respectively. (A) Dot graph showing the ratio of sIg/mIg mRNA expression for Igε (red) and Igγ1 (blue) from B220+ BCR bone marrow (pro/pre) and mature follicular (B220+ CD93 BCR+ CD21int CD23hi) B cells from Ighε/ε (red) and Ighγ1/γ1 (blue) mouse spleens (n = 4–5). The sIg and mIg levels, as well as total Ig mRNA levels were determined by absolute qPCR using known levels of standards. (B) Dot graph showing the ratio of sIg/mIg for Igμ (black), Igε (red), and Igγ1 (blue) from the indicated B cells isolated from wild-type (WT) mice. Pro/pre B cells are from B220+ BCR bone marrow. Mature B cells are from magnetically purified B220+ splenic cells. Activated B cells were derived by stimulation of magnetically purified B220+ splenic cells with anti-CD40 antibody plus IL-4 for 4 d (n = 4–9). (C) Schematic outline (above) of AID-cre-ERT2 Rosa26-loxP-EYFP mice immunized with sheep red blood cells (SRBCs) and induced with tamoxifen as outlined. FACS plots (Below) show gating strategy for flow cytometric sorting of IgM+ and IgG1+ memory (EYFP+ CD38+ GF7) B cells (n = 6). (D) Graph showing sIg/mIg mRNA ratios of IgG1+ and IgM+ of memory B cells shown in C by the absolute qPCR method described in A. Dots represent individual mice (n = 6). The mIgG1 mRNA level was below detection in three IgG1+ memory cell samples. ****P < 0.000, two-tailed t test. Summary data are means ± SEM. See also SI Appendix, Figs. S7–S9.
Fig. 4.
Fig. 4.
Overexpression of mIgH rescues B cell development in Ighε/ε, Ighγ1/γ1, and μMT pro-B cells, and Pten deletion can generate a memory response mediated by IgE+ B cells. (A) Image of semiquantitative PCR results to detect Vκ to Jκ1 assemblages in Ighε/ε pro/pre-B cells transduced with the indicated retroviral vectors. Threefold dilutions are shown. Amplification of an intronic Igκ sequence was used as a loading control. Result is representative of three experiments. Bands corresponding to rearrangements to various Jκ segments are indicated on the Left. (B) Densitometry analysis of the semiquantitative PCR data in A with ImageJ for three repeated experiments. Shown are fold changes relative to the empty vector control (n = 3), *P < 0.05, one sample t test. Summary data are means ± SEM. (C) Quantitative PCR analyses of Vκ to Jκ1 rearrangement relative to intronic β-actin DNA in Ighε/ε pro/pre-B cells transduced with the indicated retroviral vectors. Shown are fold changes relative to the empty vector control. Summary data are means ± SEM. While each mIgH expression vector was at least twofold higher than the empty vector control, one-sample t tests showed no significant differences. (D) Representative FACS analysis of Igκ and IgE, IgM, or IgG1 surface expression in Ighε/ε pro/pre-B cells transduced with the indicated retroviral vectors. Numbers indicate percentage of surface Igκ+ IgH+ on live CD19+ B cells, which express from no GFP to highest GFP, indicated by increasing number of “+” signs (n = 6). (E) Quantification of surface Igκ+ on live CD19+ B cells which express from no GFP to highest GFP after retroviral transduction in Ighε/ε, Ighγ1/γ1, and μMT pro/pre-B cells (n = 4–6). *P < 0.05, **P < 0.01, ****P < 0.0001; one-way ANOVA followed by Tukey’s post hoc test. Data are mean values ± SEM. (F and G) Graph of ELISA data showing ovalbumin (OVA)-reactive IgG1 (F) and IgE (G) in sera from Ighγ1/γ1 (blue) and heterozygous Ighγ1/WT (red) mice immunized and boosted intraperitoneally with OVA at the time intervals shown by the upward arrows. Fisher’s exact test showed no significant differences. (H) Graph of ELISA data showing OVA-reactive IgE in sera from WT (blue) and Ighε/εVJκ5 (red) mice immunized and boosted intraperitoneally with OVA at the times shown by the upward arrows. No response was observed in two Ighε/εVJκ5 mice, whereas all three WT mice responded. (I) FACS plots showing splenic lymphocytes analyzed for CD19 and IgE expression from the indicated mice (n = 4–6). (J and K) Summary dot graphs showing percentages (J) and total number (K) of splenic B cells from the indicated mice. Dots represent individual mice (n = 4–6). **P < 0.01, ***P < 0.001, ****P < 0.0001; one-way ANOVA followed by Tukey’s post hoc test. Data are mean values ± SEM. (L) Graph of ELISA data showing OVA-reactive IgE in sera from Ighε/εVJκ5 Ptenc/cCd19cre (blue) and Ighε/εVJκ5 Ptenc/cCd19cre+ (red) mice immunized and boosted intraperitoneally with OVA at the time intervals shown by the upward arrows. The y axis shows apparent binding in milligrams/milliliters or nanograms/milliliters as indicated based on comparisons to a standard anti-ovalbumin IgG1 or anti-ovalbumin IgE antibody. Number of mice used in each immunization is shown. *P < 0.05, Fisher’s exact test. See also SI Appendix, Fig. S10.

Similar articles

Cited by

References

    1. Reth M. Antigen receptors on B lymphocytes. Annu Rev Immunol. 1992;10:97–121. - PubMed
    1. Peterson ML. Immunoglobulin heavy chain gene regulation through polyadenylation and splicing competition. Wiley Interdiscip Rev RNA. 2011;2:92–105. - PubMed
    1. Jung D, Giallourakis C, Mostoslavsky R, Alt FW. Mechanism and control of V(D)J recombination at the immunoglobulin heavy chain locus. Annu Rev Immunol. 2006;24:541–570. - PubMed
    1. Tong P, Wesemann DR. Molecular mechanisms of IgE class switch recombination. Curr Top Microbiol Immunol. 2015;388:21–37. - PubMed
    1. Nutt SL, Hodgkin PD, Tarlinton DM, Corcoran LM. The generation of antibody-secreting plasma cells. Nat Rev Immunol. 2015;15:160–171. - PubMed

Publication types