. 2017 Oct 10;114(41):E8557-E8564.
doi: 10.1073/pnas.1710927114. Epub 2017 Sep 18.

Flow-induced gelation of microfiber suspensions

Affiliations

Flow-induced gelation of microfiber suspensions

Antonio Perazzo et al. Proc Natl Acad Sci U S A. .

Abstract

The flow behavior of fiber suspensions has been studied extensively, especially in the limit of dilute concentrations and rigid fibers; at the other extreme, however, where the suspensions are concentrated and the fibers are highly flexible, much less is understood about the flow properties. We use a microfluidic method to produce uniform concentrated suspensions of high aspect ratio, flexible microfibers, and we demonstrate the shear thickening and gelling behavior of such microfiber suspensions, which, to the best of our knowledge, has not been reported previously. By rheological means, we show that flowing the suspension triggers the irreversible formation of topological entanglements of the fibers resulting in an entangled water-filled network. This phenomenon suggests that flexible fiber suspensions can be exploited to produce a new family of flow-induced gelled materials, such as porous hydrogels. A significant consequence of these flow properties is that the microfiber suspension is injectable through a needle, from which it can be extruded directly as a hydrogel without any chemical reactions or further treatments. Additionally, we show that this fiber hydrogel is a soft, viscoelastic, yield-stress material.

Keywords: flexible fiber suspension; flow-induced gelation; hydrogel.


Conflict of interest statement

The authors declare no conflict of interest.

Figures

Fig. 1.
Fig. 1.
Effect of shear rate on flexible high-aspect-ratio fiber suspensions. (A) Schematic representation of the microfluidic fiber fabrication setup with (Inset) bright-field image of flowing solutions in the flow-focusing device (scale bar, 500 μm.) (B) Nonsheared fiber suspension, ϕ = 0.1, and (C and D) different regions of the fiber-rich zone of the fiber suspension after shearing at 10 s−1 until phase separation. (Scale bars, 500 μm.) (E) Time-dependent viscosity of a fiber suspension with fiber volume fraction, ϕ = 0.1, at constant shear rates, γ˙ = 0.1, 1, 10, and 15 s−1. The gap size is 0.7 mm. (F) Demonstration of irreversibility: flow curve of a ϕ = 0.2 fiber suspension, showing viscosity as shear rate, γ˙, is first increased from 0.1–12 s−1 then decreased from 12–0.1 s−1.
Fig. S1.
Fig. S1.
Viscosity behavior over time for fiber suspensions measured in different gap sizes: (A) ϕ = 0.07 and shear rate = 10 s−1, (B) ϕ = 0.1 and shear rate = 10 s−1, (C) ϕ = 0.2 and shear rate = 10 s−1, and (D) ϕ = 0.07, 0.1, and 0.2 and shear rate = 15 s−1.
Fig. S2.
Fig. S2.
Viscosity versus time for fiber suspensions with ϕ = 0.4. (A) L/D = 114, shear rate = 10 s−1; (B) L/D = 114, shear rate = 500 s−1; (C) L/D = 228, shear rate = 10 s−1; and (D) L/D = 228, shear rate = 20 s−1. (E) Shear rate reversal imposed on a ϕ = 0.4 fiber suspension with L/D = 228 initially sheared at 20 s−1 for 90 s.
Fig. 2.
Fig. 2.
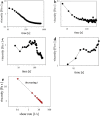
Effect of shear rate and concentration. Time-dependent viscosity of suspensions of fibers with fiber volume fractions ϕ = 0.07 (●), 0.1 (▲), 0.2 (■), and 0.4 (X) at constant shear rates: (A) 0.1, (B) 1, (C) 10, and (D) 15 s−1. The gap size is 0.7 mm.
Fig. S3.
Fig. S3.
(AC) Typical flow curves, where viscosity, η, and first normal stress difference, N1, are plotted as a function of shear rate for microfiber suspensions at volume fractions, ϕ, equal to (A) 0.07, (B) 0.1, and (C) 0.2. We report measurements until the shear rate at which the fluid was expelled from the rheometer. Lines in AC are guides to the eye.
Fig. S4.
Fig. S4.
Viscoelasticity of fiber suspensions. (A) Linear viscoelasticity of a ϕ = 0.4 suspension as a function of frequency for a given oscillatory stress of 0.7 Pa. (B) Viscoelasticity of a ϕ = 0.2 suspension as a function of oscillatory shear stress for a given frequency of 1 Hz. The elastic modulus, G′, is shown by filled symbols and the viscous modulus, G″, is shown by open symbols.
Fig. 3.
Fig. 3.
In situ visualization of sheared fiber suspensions. Time-dependent viscosity of a fiber suspension with fiber volume fraction ϕ = 0.4 at a constant shear rate of (A) 1 s−1 (shear thinning observed) and (B) 10 s−1 (shear thickening observed) using smooth glass parallel plates. In situ images of sheared fiber suspension of a fiber suspension with fiber volume fraction ϕ = 0.4 (C) at a constant shear rate of 1 s−1 at 262 s (time point indicated on A) and (D) at a constant shear rate of 10 s−1 at 77 s (time point indicated on B). (Scale bar, 200 µm.)
Fig. 4.
Fig. 4.
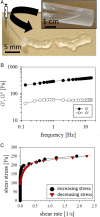
Flow-induced gelation of a ϕ = 0.4 fiber suspension: rheological properties of the fiber hydrogel. (A) Extrusion of the hydrogel from a needle and syringe containing a concentrated suspension of microfibers. (Inset ) A tilted vial containing a concentrated suspension of microfibers. (B) Linear viscoelasticity as a function of frequency of the extruded hydrogel for an oscillatory stress of 0.7 Pa. The elastic modulus, G′, is represented by filled symbols and the viscous modulus, G″, is represented by open symbols. (C) Demonstration of yielding behavior of the fiber hydrogel with increasing, up to 250 Pa, and decreasing stress ramps plotted against shear rate.
Fig. S7.
Fig. S7.
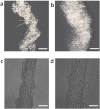
Swelling properties of extruded hydrogel. (A) Image of the fiber hydrogel as extruded and (B) the swollen hydrogel a minute after a few drops of water were added. (Scale bars, 2 mm.) (C) Microscopic detail of the fiber hydrogel as extruded and (D) microscopic detail of the swollen hydrogel a minute after a few drops of water were added. (Scale bars, 200 μm.)
Fig. S5.
Fig. S5.
Mechanical properties of fiber hydrogels. (A) Measurements showing viscoelasticity as a function of oscillatory shear stress for a given frequency of 1 Hz for the hydrogel obtained by extrusion through syringe and needle of a suspension, ϕ = 0.4. (B) Measurements showing linear viscoelasticity as a function of frequency for the same hydrogel sample in A for a given oscillatory stress of 0.7 Pa. The elastic modulus, G′, is shown by filled symbols and the viscous modulus, G″, is shown by open symbols.
Fig. S6.
Fig. S6.
Determination of yield stress of fiber hydrogels produced by extrusion from a syringe and needle of a ϕ = 0.4 suspension. (A) Continuous shear stress ramp (shown by filled circles) and stress reversal (shown by filled triangles), gap size = 1.42 mm. (B) Oscillatory shear stress variation at a given frequency of 1 Hz, gap size = 1.42 mm. (C) Continuous shear stress ramp and stress reversal, gap size = 0.7 mm. (D) Oscillatory shear stress variation at a given frequency of 1 Hz, gap size = 0.7 mm. (E) Continuous shear stress ramp and stress reversal, gap size = 0.5 mm. (F) Oscillatory shear stress variation at a given frequency of 1 Hz, gap size = 0.5 mm. (G) Oscillatory shear stress variation at a given frequency of 1 Hz, gap size = 0.3 mm. The elastic modulus, G′, is shown by filled symbols and the viscous modulus, G″, is shown by open symbols.
Fig. 5.
Fig. 5.
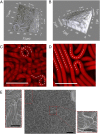
Porosity and microstructure of fiber suspensions and fiber hydrogels. (A and B) Three-dimensional confocal reconstructions of a fiber hydrogel prepared from a suspension with ϕ = 0.2 (see also Movies S1–S5). (C and D) Individual confocal z-slices showing typical fiber deformations in the hydrogel, such as (C) twisted loop or coiled and (D) aligned and looped fibers, as indicated by the dashed lines. (Scale bars, 200 µm.) (E) SEM image of a dried hydrogel, with magnified (Inset) images showing different regions of the hydrogel. (Scale bars, 200 μm in the low-magnification image and 100 μm in higher-magnification images.)
Fig. S8.
Fig. S8.
Bright-field images of fibers flowing in serpentine channels with constrictions. Fiber aspect ratios (L/D) are (A) 114, (B) 228, and (C) 340. The fibers were collected in serpentine channels and the fiber length was measured using ImageJ. (Scale bar, 1 mm.)

References

    1. Keshtkar M, Heuzey MC, Carreau PJ. Rheological behavior of fiber-filled model suspensions: Effect of fiber flexibility. J Rheol (NYNY) 2009;53:631–650.
    1. Zirnsak MA, Hur DU, Boger DV. Normal stresses in fibre suspensions. J Nonnewton Fluid Mech. 1994;54:153–193.
    1. Ganani E, Powell RL. Suspensions of rodlike particles: Literature review and data correlations. J Compos Mater. 1985;19:194–215.
    1. Cheng X, McCoy JH, Israelachvili JN, Cohen I. Imaging the microscopic structure of shear thinning and thickening colloidal suspensions. Science. 2011;333:1276–1279. - PubMed
    1. Wagner NJ, Brady JF. Shear thickening in colloidal dispersions. Phys Today. 2009;62:27–32.

Publication types