Clinical Trial
. 2017 Nov 23;130(21):2295-2306.
doi: 10.1182/blood-2017-06-793141. Epub 2017 Sep 18.

Kinetics and biomarkers of severe cytokine release syndrome after CD19 chimeric antigen receptor-modified T-cell therapy

Affiliations
Clinical Trial

Kinetics and biomarkers of severe cytokine release syndrome after CD19 chimeric antigen receptor-modified T-cell therapy

Kevin A Hay et al. Blood. .

Abstract

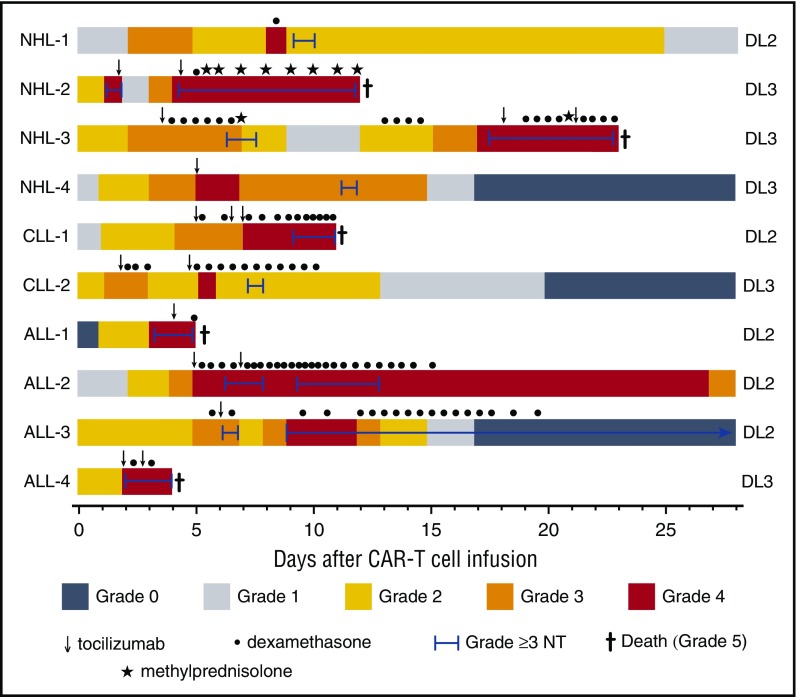
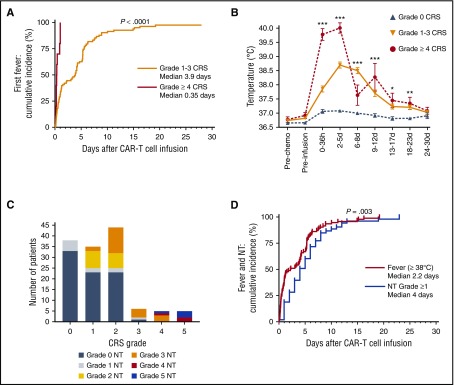
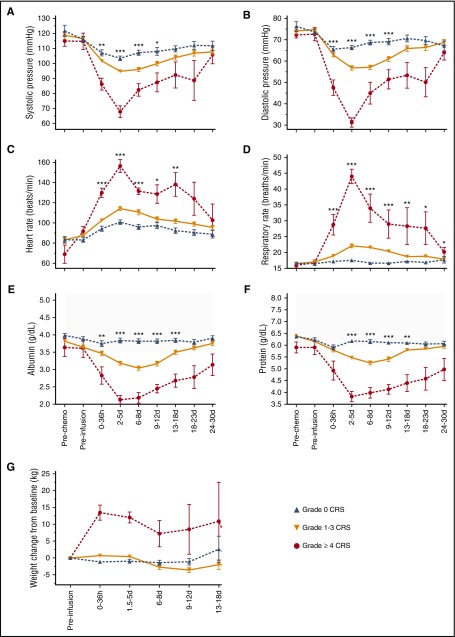
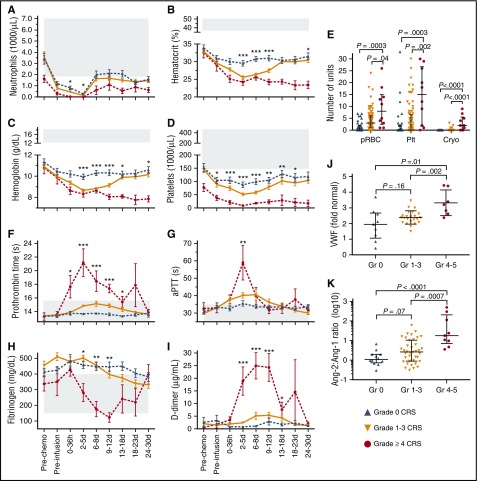
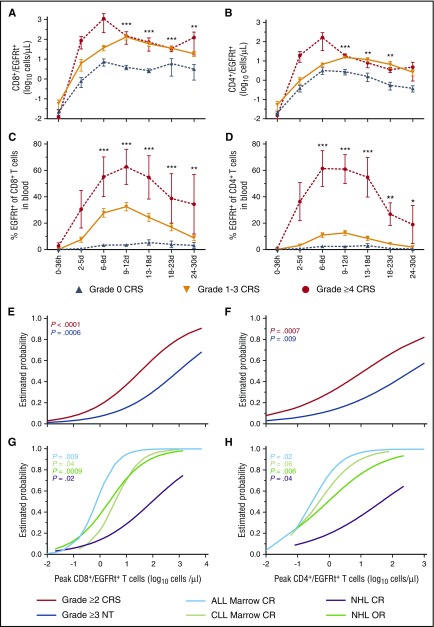
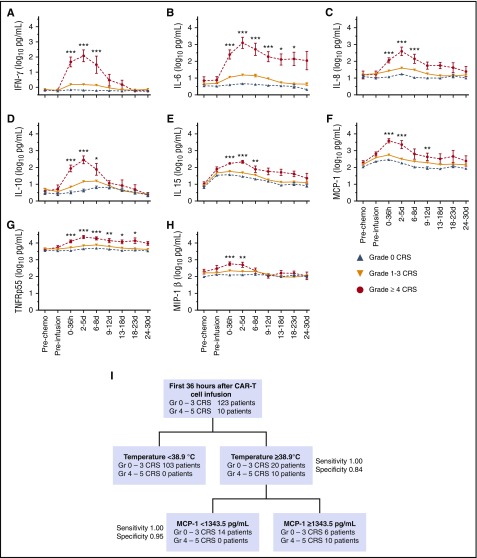
Lymphodepletion chemotherapy followed by infusion of CD19-specific chimeric antigen receptor-modified (CAR) T cells has produced impressive antitumor responses in patients with refractory CD19+ B-cell malignancies but is often associated with cytokine release syndrome (CRS). Our understanding of CRS continues to evolve, and identification of the kinetics of CRS and predictive clinical and laboratory biomarkers of severity are needed to evaluate strategies to mitigate toxicity. We report the clinical presentation of and identify biomarkers of severe CRS in 133 adult patients who received CD19 CAR T cells. CRS developed in 70% of patients, including 62.5% with grade 1 to 3 CRS (grade 1, 26%; grade 2, 32%; grade 3, 4.5%), 3.8% with grade 4, and 3.8% with grade 5. A majority of cases of grade ≥4 CRS occurred during CAR T-cell dose finding. Multivariable analysis of baseline characteristics identified high marrow tumor burden, lymphodepletion using cyclophosphamide and fludarabine, higher CAR T-cell dose, thrombocytopenia before lymphodepletion, and manufacturing of CAR T cells without selection of CD8+ central memory T cells as independent predictors of CRS. Severe CRS was characterized by hemodynamic instability, capillary leak, and consumptive coagulopathy. Angiopoietin-2 and von Willebrand factor, which are biomarkers of endothelial activation, were increased during severe CRS and also before lymphodepletion in patients who subsequently developed CRS. We describe a classification-tree algorithm to guide studies of early intervention after CAR T-cell infusion for patients at high risk of severe CRS. These data provide a framework for early intervention studies to facilitate safer application of effective CD19 CAR T-cell therapy.


Figures

Figure 1.
Figure 1.
Presentation, management, and outcomes of patients with grade ≥4 CRS. Colors on the swimmer plot indicate the CRS grade on each day through 28 days after CAR T-cell infusion in all patients who developed grade ≥4 CRS. The duration of grade ≥3 neurotoxicity and interventions with tocilizumab and/or corticosteroids are indicated in the figure. ALL-2 developed dialysis-dependent acute kidney injury (AKI) through day 26 followed by resolution of CRS-associated organ toxicity (grade 0) on day 37. ALL-3 died 4 months after CAR T-cell infusion with irreversible neurotoxicity, despite resolution of fever and hypotension associated with CRS on day 13 after CAR T-cell infusion. NHL-1 had ongoing grade 1 AKI at last available laboratory value on day 83. Doses of medications: dexamethasone 10 mg intravenously or orally, methylprednisolone 1g intravenously, tocilizumab 4 to 8 mg/kg intravenously. NT, neurotoxicity.
Figure 2.
Figure 2.
Kinetics of presentation of CRS and neurotoxicity. (A) Cumulative incidence curve for first fever ≥38°C in patients with grade 1 to 3 (n = 82) or grade ≥4 CRS (n = 10). (B) Mean ± standard error of the mean (SEM) of the maximum temperature after CAR T-cell infusion. (C) Incidence and grading of neurotoxicity within each CRS grade. (D) The median time of onset of fever ≥38°C (red, n = 92) or neurotoxicity (blue, n = 53) after CAR T-cell infusion. One patient with grade 2 CRS who developed hypotension without fever is not included. Kruskal-Wallis test ***P < .0001; **P ranges from >.0001 to <.001; *P ranges from >.001 to <.005. d, days after CAR T-cell infusion; h, hours after CAR T-cell infusion; pre-chemo, before the start of lymphodepletion chemotherapy; pre-infusion, before CAR T-cell infusion.
Figure 3.
Figure 3.
Hemodynamic instability and clinical capillary leak in grade ≥4 CRS. (A-G) Mean ± SEM of (A) minimum systolic blood pressure, (B) minimum diastolic blood pressure, (C) maximum heart rate, (D) maximum respiratory rate, (E) minimum serum protein concentration, (F) minimum albumin concentration, and (G) weight gain from the start of lymphodepletion are shown at the indicated times after CAR T-cell infusion. Gray shading indicates the normal range. Kruskal-Wallis test: ***P < .0001; **P ranges from >.0001 to <.001; *P ranges from >.001 to <.005.
Figure 4.
Figure 4.
Hematopoietic toxicity, laboratory coagulopathy, and endothelial injury in grade ≥4 CRS. (A) Minimum absolute neutrophil count, (B) hematocrit, (C) hemoglobin, and (D) platelet count are shown for patients receiving cyclophosphamide/fludarabine lymphodepletion at the indicated times after CAR T-cell infusion (n = 104). (E) Total transfused units of packed red blood cells (pRBC), platelets (Plt), and cryoprecipitate (Cryo) in the first 28 days after CAR T-cell infusion. (F) Maximum PT, (G) maximum aPTT, (H) minimum fibrinogen, and (I) maximum D-dimer concentrations are shown at the indicated times after CAR T-cell infusion. (J) The fold change in VWF concentration in serum from a subset of patients at the peak of CAR T-cell expansion (n = 60; grade 0, n = 12; grade 1-3, n = 39; grade ≥4 CRS, n = 9) compared with the VWF concentration in pooled normal plasma (12.2 μg/mL; CRYOcheck, Precision Biologic, Dartmouth, NS, Canada). (K) The Ang-2:Ang-1 ratio at the peak of CAR T-cell expansion (n = 60; grade 0, n = 12; grade 1-3, n = 39; grade ≥4 CRS, n = 9). For (A-D) and (F-I), data represent the mean ± SEM. P values were determined using the Kruskal-Wallis test. For (E,J,K), each point represents data from 1 patient. The median and IQR are shown. P values were determined using the Wilcoxon test. Gray shading indicates the normal range. ***P < .0001; **P ranges from >.0001 to <.001; *P ranges from >.001 to <.005. Gr, grade.
Figure 5.
Figure 5.
CAR T-cell counts in blood and estimated probabilities of response or toxicity. (A-B) The absolute number and (C-D) percentage of CD8+ (left) and CD4+ (right) CAR T-cells in blood. The mean ± SEM of the maximum values are shown. P values were determined by using the Kruskal-Wallis test. (E-F) Estimated probabilities by logistic regression of grade ≥2 CRS and grade ≥3 neurotoxicity at (E) peak CD8+ and (F) CD4+ CAR T-cell counts in blood. (G-H) Estimated probabilities by logistic regression of bone marrow CR in ALL and CLL patients by flow cytometry and CR or overall response (OR) in NHL patients according to Cheson imaging criteria (2014) at peak (G) CD8+ and (H) CD4+ CAR T-cell counts in blood. Lymph node CR in CLL patients is not depicted because of the limited cohort size available for analysis. P values are color-coded to indicate the association between the CAR T-cell peak counts and outcomes. ***P < .0001; **P ranges from >.0001 to <.001; *P ranges from >.001 to <.005.
Figure 6.
Figure 6.
Biomarkers for early prediction of grade ≥4 CRS. (A-H) Concentrations of listed cytokines in serum obtained from patients at the indicated time points. P values were determined by using the Kruskal-Wallis test. (I) An algorithm for early identification of patients at high risk of grade ≥4 CRS using classification-tree modeling. Early high fever (≥38.9°C) within the first 36 hours after CAR T-cell infusion triggers evaluation of serum MCP-1 concentration. Patients with fever ≥38.9°C and serum MCP-1 ≥1343.5 pg/mL are at high risk for subsequent development of grade ≥4 CRS. ***P < .0001; **P ranges from >.0001 to <.001; *P ranges from >.001 to <.005.

Comment in

Similar articles

Cited by

References

    1. Turtle CJ, Hanafi LA, Berger C, et al. . Immunotherapy of non-Hodgkin’s lymphoma with a defined ratio of CD8+ and CD4+ CD19-specific chimeric antigen receptor-modified T cells. Sci Transl Med. 2016;8(355):355ra116. - PMC - PubMed
    1. Turtle CJ, Hanafi LA, Berger C, et al. . CD19 CAR-T cells of defined CD4+:CD8+ composition in adult B cell ALL patients. J Clin Invest. 2016;126(6):2123-2138. - PMC - PubMed
    1. Turtle CJ, Hanafi LA, Li D, et al. . CD19 CAR-T cells are highly effective in ibrutinib-refractory chronic lymphocytic leukemia [abstract]. Blood. 2016;128(22). Abstract 56.
    1. Grupp SA, Kalos M, Barrett D, et al. . Chimeric antigen receptor-modified T cells for acute lymphoid leukemia. N Engl J Med. 2013;368(16):1509-1518. - PMC - PubMed
    1. Maude SL, Frey N, Shaw PA, et al. . Chimeric antigen receptor T cells for sustained remissions in leukemia. N Engl J Med. 2014;371(16):1507-1517. - PMC - PubMed

Publication types

MeSH terms