. 2017 Nov 17;292(46):18732-18746.
doi: 10.1074/jbc.M117.796235. Epub 2017 Sep 18.

A B-Z junction induced by an A … A mismatch in GAC repeats in the gene for cartilage oligomeric matrix protein promotes binding with the hZαADAR1 protein

Affiliations

A B-Z junction induced by an A … A mismatch in GAC repeats in the gene for cartilage oligomeric matrix protein promotes binding with the hZαADAR1 protein

Narendar Kolimi et al. J Biol Chem. .

Abstract

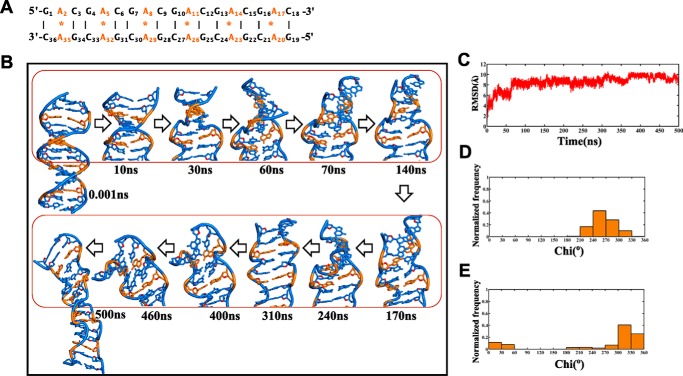
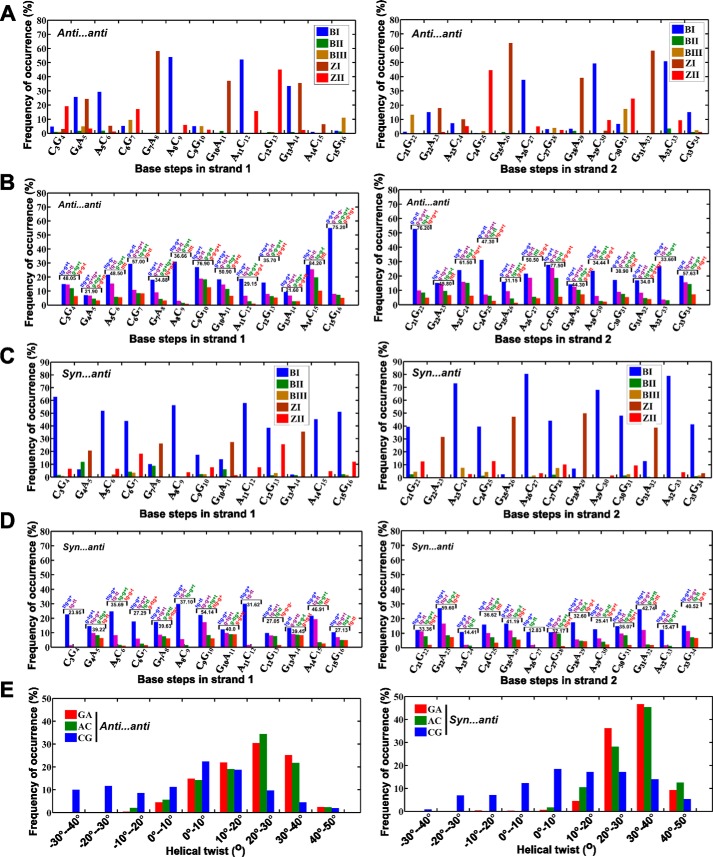
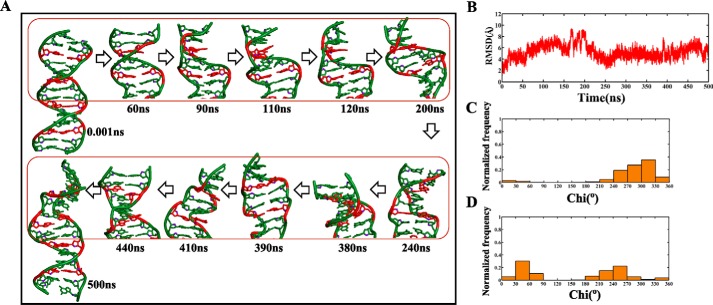
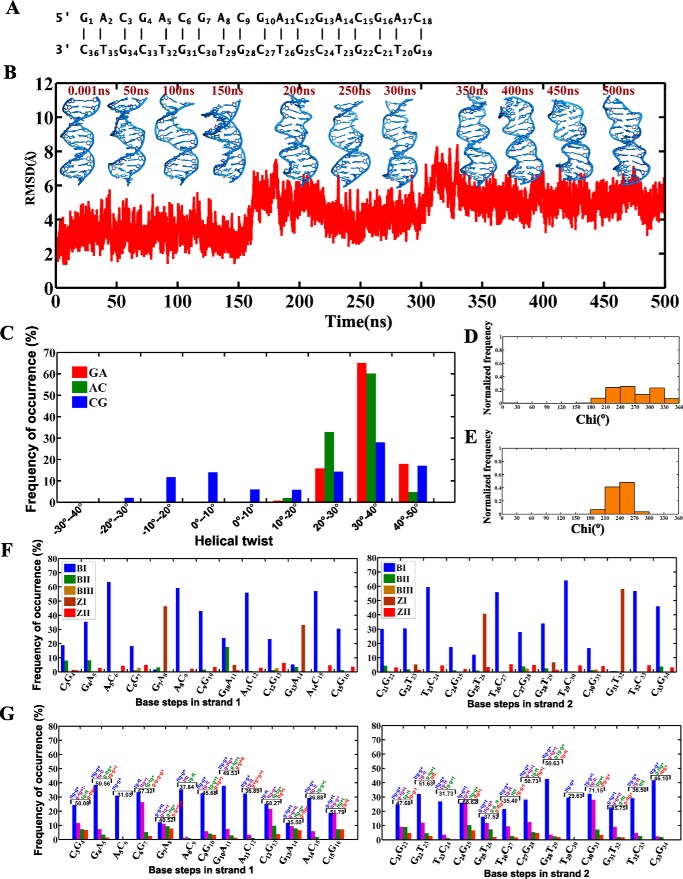
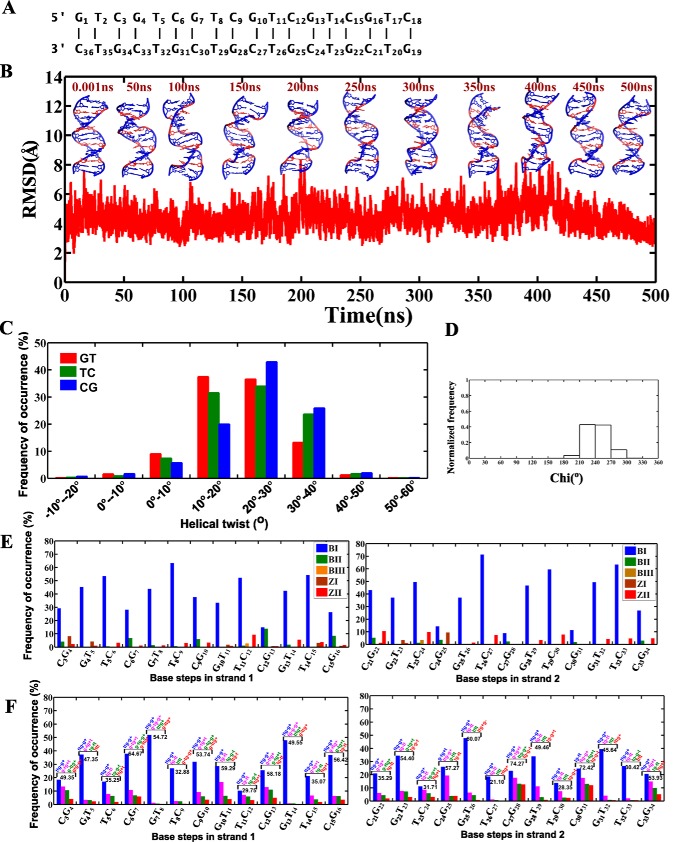
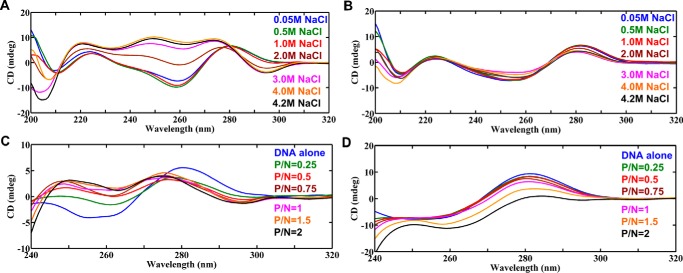
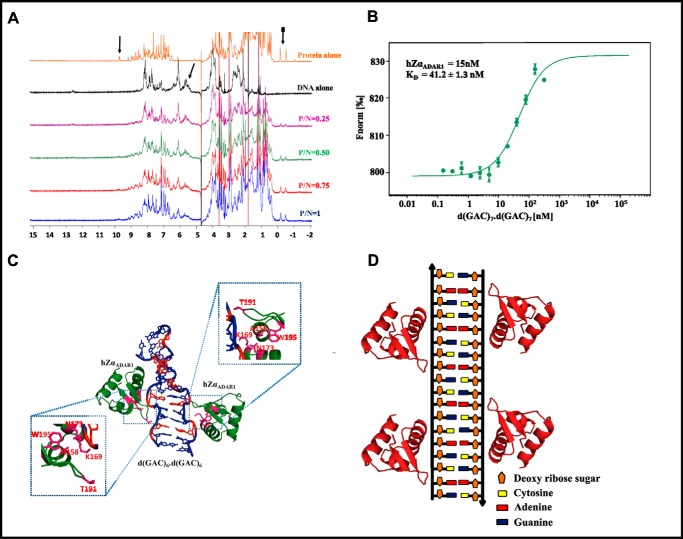
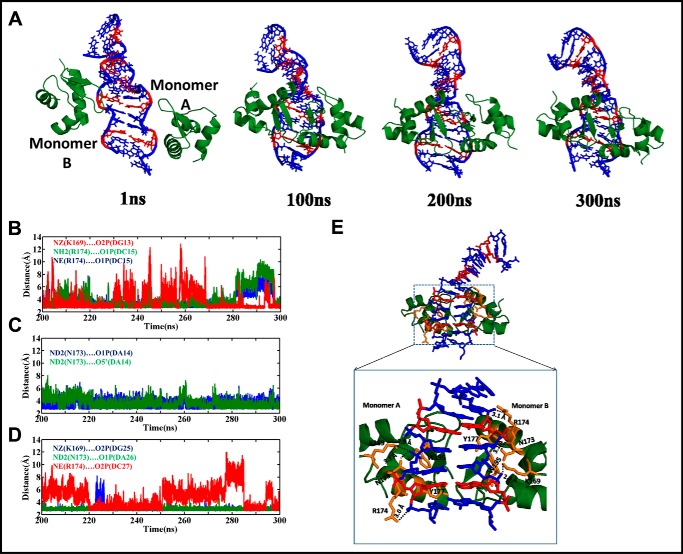
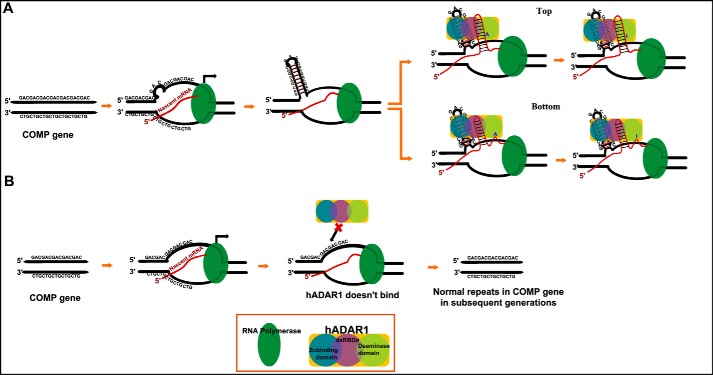
GAC repeat expansion from five to seven in the exonic region of the gene for cartilage oligomeric matrix protein (COMP) leads to pseudoachondroplasia, a skeletal abnormality. However, the molecular mechanism by which GAC expansions in the COMP gene lead to skeletal dysplasias is poorly understood. Here we used molecular dynamics simulations, which indicate that an A … A mismatch in a d(GAC)6·d(GAC)6 duplex induces negative supercoiling, leading to a local B-to-Z DNA transition. This transition facilitates the binding of d(GAC)7·d(GAC)7 with the Zα-binding domain of human adenosine deaminase acting on RNA 1 (ADAR1, hZαADAR1), as confirmed by CD, NMR, and microscale thermophoresis studies. The CD results indicated that hZαADAR1 recognizes the zigzag backbone of d(GAC)7·d(GAC)7 at the B-Z junction and subsequently converts it into Z-DNA via the so-called passive mechanism. Molecular dynamics simulations carried out for the modeled hZαADAR1-d(GAC)6d(GAC)6 complex confirmed the retention of previously reported important interactions between the two molecules. These findings suggest that hZαADAR1 binding with the GAC hairpin stem in COMP can lead to a non-genetic, RNA editing-mediated substitution in COMP that may then play a crucial role in the development of pseudoachondroplasia.

Keywords: CD; NMR; RNA editing; cartilage oligomeric matrix protein; human adar1 protein; molecular dynamics; pseudoachdroplasia; trinucleotide repeat disease.


Conflict of interest statement

The authors declare that they have no conflicts of interest with the contents of this article

Figures

Figure 1.
Figure 1.
B-DNA to B–Z junction transition in the d(GAC)6.d(GAC)6 duplex with the antianti starting glycosyl conformation for the A … A mismatch. A, sequence of the 18-mer DNA duplex that is subjected to MD simulation in this investigation. B, schematic of the duplex at various time intervals during the 500-ns simulation, which indicates formation of a left-handed conformation (shown in boxes). C, time versus RMSD profile showing significant conformational changes in the duplex, as indicated by a high RMSD value with respect to the starting model. D and E, glycosyl torsion (Chi) showing high-anti and ±syn conformational preference for As and Gs, respectively. The noncanonical A … A mismatches are indicated in orange in B.
Figure 2.
Figure 2.
Parameters associated with B–Z junction formation during 101–500-ns simulation time in the duplex containing A … A mismatches with antianti and +synanti starting glycosyl conformations. A and C, frequency of occurrence of BI, BII, BIII, ZI, and ZII conformations defined in terms of (ϵ,ζ,α,γ) at different steps of the A … A mismatch–containing duplex. Preponderance for BIII/Z conformations compared with BI/BII at GA/CG steps can be seen irrespective of the starting glycosyl conformation. B and D, frequency of occurrence of (ϵ,ζ,α,γ) conformations other than BI, BII, BIII, and Z during two different MD simulations of d(GAC)6·d(GAC)6. Populations corresponding to top four conformations are alone shown. (ϵ,ζ,α,γ) conformational preference and the corresponding frequency of occurrence of the top four populations (%) are given for each base step. E, histogram showing the distribution of helical twists at different steps of the DNA duplex. Strikingly, CG steps exhibit a tendency for lower twists (between −40° to 10°) compared with GA and AC steps. The percentage of such low twists is significantly higher in A … A mismatches compared with the canonical duplex (Fig. 4C).
Figure 3.
Figure 3.
Evolution of the B–Z junction in the d(GAC)6.d(GAC)6 duplex with +synanti glycosyl conformation for the mismatch. A, snapshots showing the unwinding of the helix because of Z-DNA evolution, resulting in negative supercoiling. The A … A mismatch is colored red. B, time versus RMSD profile illustrating (RMSD > 4Å) significant conformational changes taking place with respect to the starting model. C and D, glycosyl torsions showing (C) Gs favoring ±syn and (D) As favoring high-anti/+syn conformations, respectively.
Figure 4.
Figure 4.
The d(GAC)6·d(GTC)6 duplex containing canonical base pairs retains B-form geometry. A, sequence of the 18-mer DNA duplex containing canonical base pairs used for MD simulations. B, time versus RMSD profile along with a schematic of the d(GAC)6·d(GTC)6 duplex at various time intervals. C, histograms corresponding to helical twist values of GA, AC, and CG steps over the last 400 ns. D and E, glycosyl chi angle values for guanine (favoring the ±syn conformation, D) and adenine (favoring the anti conformation, E) residues. F and G, backbone conformational angles for canonical base pairs over the last 400 ns of simulations. (ϵ,ζ,α,γ) conformational preference and the corresponding frequency of occurrence of the top four populations (percent) other than BI, BII, BIII, ZI, and ZII are given for each base step (G).
Figure 5.
Figure 5.
The d(GTC)6·d(GTC)6 duplex containing the T … T mismatch retains B-form geometry. A, sequence of the 18-mer DNA duplex containing the T … T mismatch used for MD simulation. B, time versus RMSD profile along with a schematic of the d(GTC)6·d(GTC)6 duplex at various time intervals. C, histograms corresponding to helical twists at GT, TC, and CG steps over the last 400 ns. D, glycosyl chi angle values for guanine residues (favoring the anti/high-anti conformation). E, backbone conformational (ϵ,ζ,α,γ) angles for canonical base pairs over the last 400 ns of simulations. F, frequency of occurrence of the top four populations other than BI, BII, BIII, ZI, and ZII are given for each base step. The d(GTC)6·d(GTC)6 sequences were carried out using pmemd.cuda of the AMBER 16 suite.
Figure 6.
Figure 6.
CD spectra showing the role of the A … A mismatch in promoting Z-phillicity in the d(GAC)7.d(GAC)7 duplex. A and B, salt-dependent (A) B-to-Z transition in d(GAC)7·d(GAC)7 (contains seven A … A mismatches) and (B) absence of the same in d(GAC)7·d(GTC)7 (contains only canonical base pairs). C and D, titration of (C) d(GAC)7·d(GAC)7 and (D) d(GAC)7·d(GTC)7 with hZαADAR1, indicating complete B-Z–to–Z transition in the former and absence of the same in the latter.
Figure 7.
Figure 7.
D(GAC)7·d(GAC)7–hZαADAR1 complex model. A, 1H NMR spectra corresponding to d(GAC)7·d(GAC)7 duplex titration with hZαADAR1. Arrows indicate the reduction in peak intensities (peak broadening) as the concentration of protein increases, suggestive of an intermediate chemical exchange between the two. B, DNA concentration–dependent (the protein concentration is kept constant, whereas the DNA concentration is varied, as described under “Experimental Procedures”) binding isotherms obtained from the microscale thermophoresis assay indicate that d(GAC)7·d(GAC)7 and hZαADAR1 exhibit nanomolar binding affinity with a KD of 41 nm. C, 1H NMR–based docked model of hZαADAR1 (PDB code 2ACJ)–d(GAC)6·d(GAC)6 (MD-derived) complex (red represents the A … A mismatch). The important interactions are enlarged and boxed. D, schematic of hZαADAR1 binding at multiple mismatch sites of the d(GAC)6·d(GAC)6 duplex.
Figure 8.
Figure 8.
B-Z junction formation in the d(GAC)6·d(GAC)6 duplex facilitates the accommodation of hZαADAR1 in the minor groove. A, snapshots of d(GAC)6·d(GAC)6–hZαADAR1 complex MD simulation reveal that the β hairpins of the hZαADAR1 dimer interact with the duplex through its minor groove (A … A mismatches are colored red). B–D, time versus hydrogen bond distance profile corresponding to hZαADAR1 monomers A (B and C) and B (D). See text for details. E, snapshot illustrating all hydrogen bonding interactions between d(GAC)6·d(GAC)6 and hZαADAR1 during the simulation.
Figure 9.
Figure 9.
Proposed model for RNA editing by neuronal hADAR1 in COMP in the perspective of pseudoachondroplasia disease. A, during transcription, formation of the d(GAC) hairpin containing the Z-conformation facilitates hZαADAR1 to anchor to the hairpin stem and aids in A-to-I editing either in the corresponding nascent RNA (top) or downstream (bottom). B, under normal conditions, hZαADAR1 does not bind to the duplex because of the absence of B-Z/Z conformations, resulting in wild-type protein expression.

References

    1. Pearson C. E., Nichol Edamura K., and Cleary J. D. (2005) Repeat instability: mechanisms of dynamic mutations. Nat. Rev. Genet. 6, 729–742 - PubMed
    1. Briggs M. D., Hoffman S. M., King L. M., Olsen A. S., Mohrenweiser H., Leroy J. G., Mortier G. R., Rimoin D. L., Lachman R. S., and Gaines E. S. (1995) Pseudoachondroplasia and multiple epiphyseal dysplasia due to mutations in the cartilage oligomeric matrix protein gene. Nat. Genet. 10, 330–336 - PubMed
    1. Délot E., King L. M., Briggs M. D., Wilcox W. R., and Cohn D. H. (1999) Trinucleotide expansion mutations in the cartilage oligomeric matrix protein (COMP) gene. Hum. Mol. Genet. 8, 123–128 - PubMed
    1. Tufan A. C., Satiroglu-Tufan N. L., Jackson G. C., Semerci C. N., Solak S., and Yagci B. (2007) Serum or plasma cartilage oligomeric matrix protein concentration as a diagnostic marker in pseudoachondroplasia: differential diagnosis of a family. Eur. J. Hum. Genet. 15, 1023–1028 - PubMed
    1. Tan K., Duquette M., Joachimiak A., and Lawler J. (2009) The crystal structure of the signature domain of cartilage oligomeric matrix protein: implications for collagen, glycosaminoglycan and integrin binding. FASEB J. 23, 2490–2501 - PMC - PubMed

Publication types

MeSH terms

Supplementary concepts