

Dynamic regulation of Cdr1 kinase localization and phosphorylation during osmotic stress
- PMID: 28924043
- PMCID: PMC5682958
- DOI: 10.1074/jbc.M117.793034
Dynamic regulation of Cdr1 kinase localization and phosphorylation during osmotic stress
Abstract
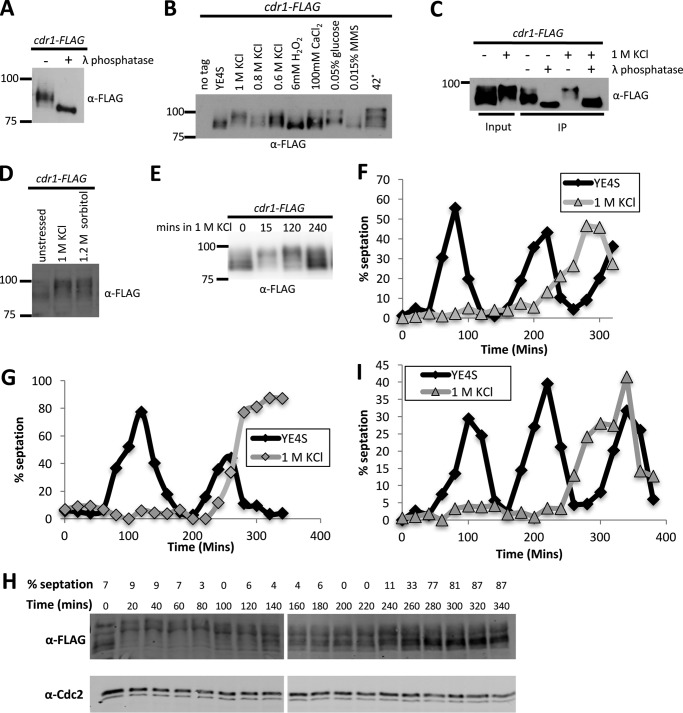
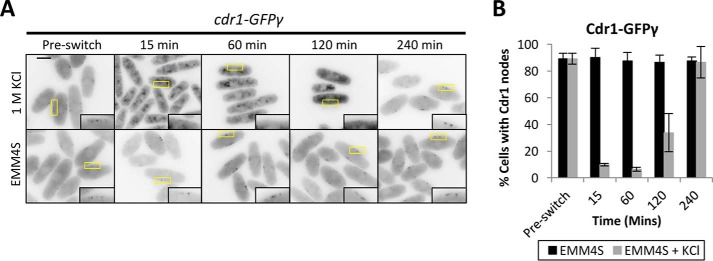
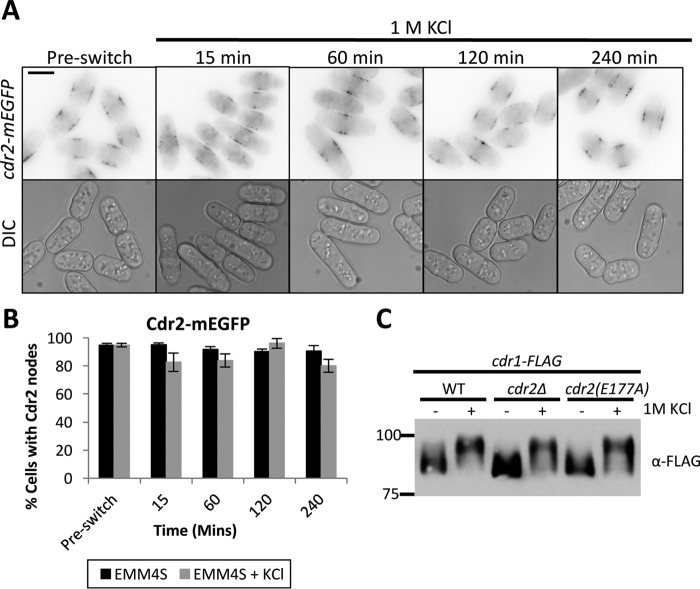
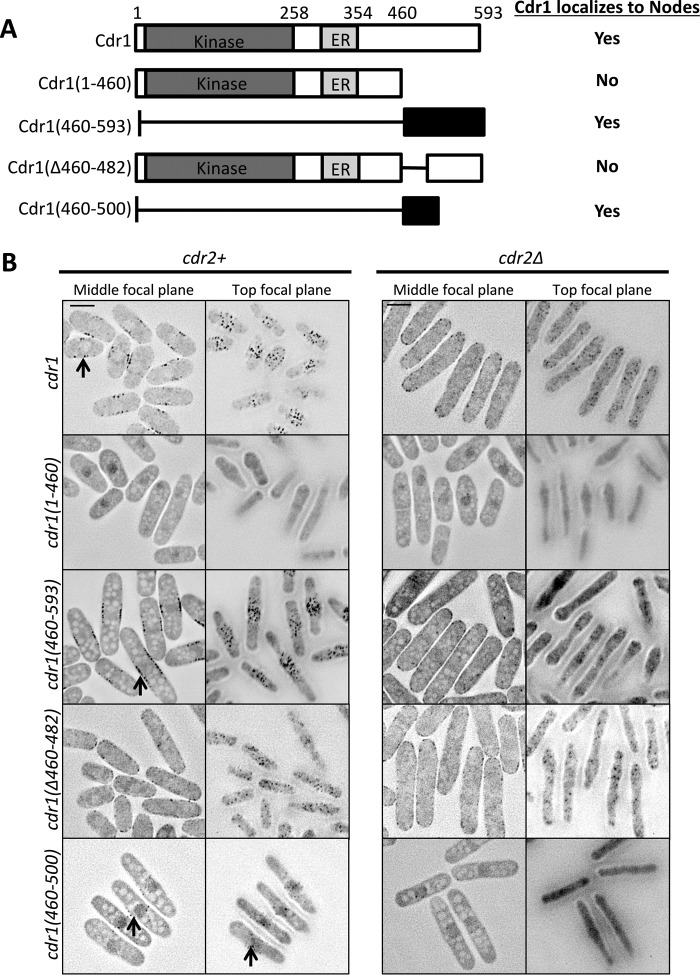
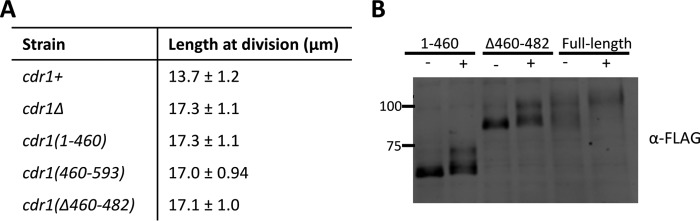
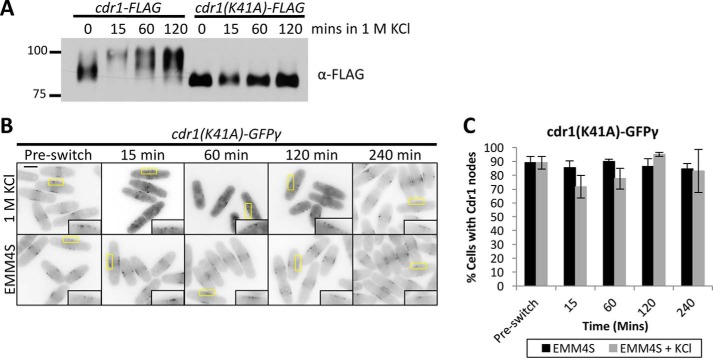
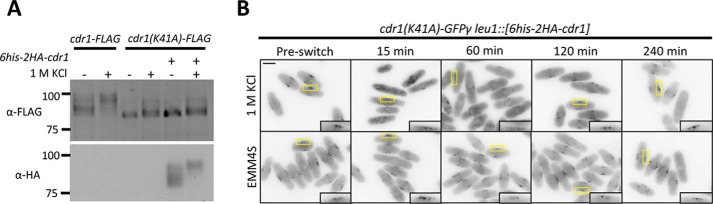
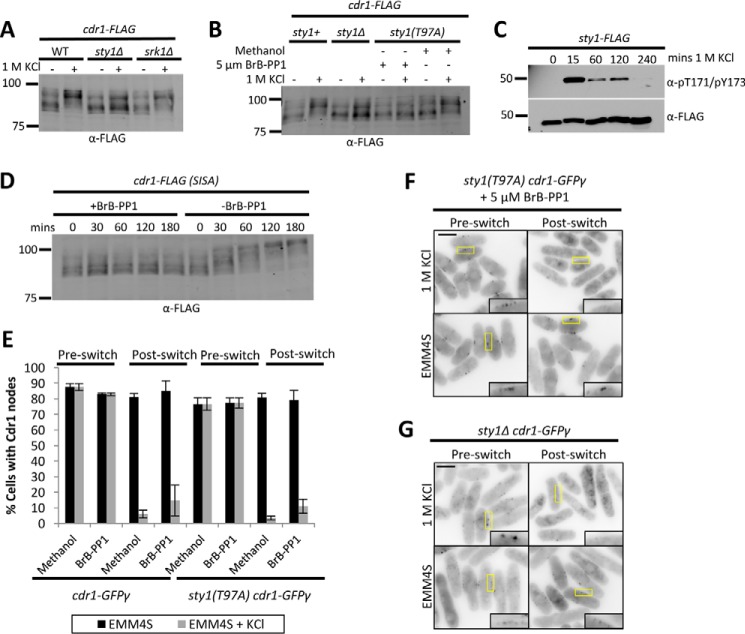
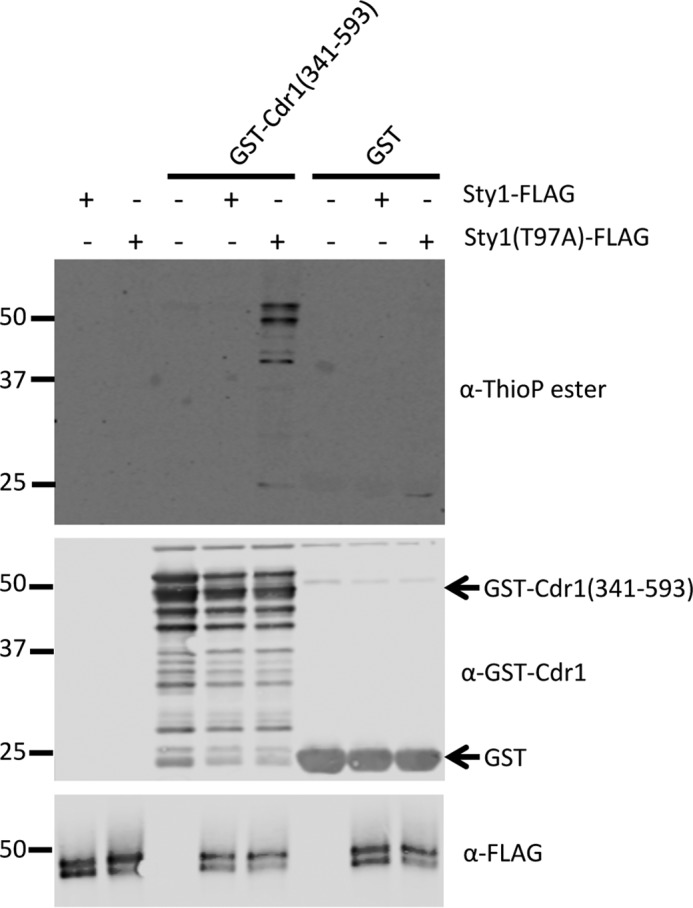
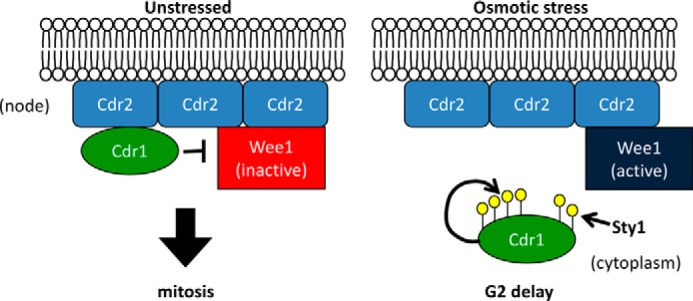
Environmental conditions modulate cell cycle progression in many cell types. A key component of the eukaryotic cell cycle is the protein kinase Wee1, which inhibits the cyclin-dependent kinase Cdk1 in yeast through human cells. In the fission yeast Schizosaccharomyces pombe, the protein kinase Cdr1 is a mitotic inducer that promotes mitotic entry by phosphorylating and inhibiting Wee1. Cdr1 and Wee1 both localize to punctate structures, termed nodes, on the medial cortex, but it has been unknown whether node localization can be altered by physiological signals. Here we investigated how environmental conditions regulate Cdr1 signaling for cell division. Osmotic stress induced hyperphosphorylation of the mitotic inducer Cdr1 for several hours, and cells delayed division for the same time period. This stress-induced hyperphosphorylation required both Cdr1 autophosphorylation and the stress-activated protein kinase Sty1. During osmotic stress, Cdr1 exited cortical nodes and localized in the cytoplasm. Using a series of truncation mutants, we mapped a C-terminal domain that is necessary and sufficient for Cdr1 node localization and found that Sty1 directly phosphorylates this domain in vitro Sty1 was not required for Cdr1 exit from nodes, indicating the existence of additional regulatory signals. Both Cdr1 phosphorylation and node localization returned to basal levels when cells adapted to osmotic conditions and resumed cell cycle progression. In summary, we identified a mechanism that prevents Cdr1 colocalization with its inhibitory target Wee1 during osmotic stress. Dynamic regulation of protein localization to cortical nodes might represent a strategy to modulate entry into mitosis under differing environmental conditions.
Keywords: Cdr1; Schizosaccharomyces pombe; Wee1; cell cycle; mitosis; osmotic stress; protein kinase; protein phosphorylation; yeast.
© 2017 by The American Society for Biochemistry and Molecular Biology, Inc.
Conflict of interest statement
The authors declare that they have no conflicts of interest with the contents of this article. The content is solely the responsibility of the authors and does not necessarily represent the official views of the National Institutes of Health
Figures
Similar articles
-
A mechanism for how Cdr1/Nim1 kinase promotes mitotic entry by inhibiting Wee1.Mol Biol Cell. 2019 Dec 1;30(25):3015-3023. doi: 10.1091/mbc.E19-08-0430. Epub 2019 Oct 23. Mol Biol Cell. 2019. PMID: 31644361 Free PMC article.
-
Compartmentalized nodes control mitotic entry signaling in fission yeast.Mol Biol Cell. 2013 Jun;24(12):1872-81. doi: 10.1091/mbc.E13-02-0104. Epub 2013 Apr 24. Mol Biol Cell. 2013. PMID: 23615447 Free PMC article.
-
The protein kinase Cdr2, related to Nim1/Cdr1 mitotic inducer, regulates the onset of mitosis in fission yeast.Mol Biol Cell. 1998 Dec;9(12):3321-34. doi: 10.1091/mbc.9.12.3321. Mol Biol Cell. 1998. PMID: 9843572 Free PMC article.
-
The fission yeast Nim1/Cdr1 kinase: a link between nutritional state and cell cycle control.Prog Cell Cycle Res. 1995;1:207-14. doi: 10.1007/978-1-4615-1809-9_16. Prog Cell Cycle Res. 1995. PMID: 9552364 Review.
-
Reversible tyrosine phosphorylation and cell cycle control.Semin Cell Biol. 1993 Dec;4(6):433-42. doi: 10.1006/scel.1993.1051. Semin Cell Biol. 1993. PMID: 8305682 Review.
Cited by
-
Conserved NDR/LATS kinase controls RAS GTPase activity to regulate cell growth and chronological lifespan.Mol Biol Cell. 2019 Sep 15;30(20):2598-2616. doi: 10.1091/mbc.E19-03-0172. Epub 2019 Aug 7. Mol Biol Cell. 2019. PMID: 31390298 Free PMC article.
-
A mechanism for how Cdr1/Nim1 kinase promotes mitotic entry by inhibiting Wee1.Mol Biol Cell. 2019 Dec 1;30(25):3015-3023. doi: 10.1091/mbc.E19-08-0430. Epub 2019 Oct 23. Mol Biol Cell. 2019. PMID: 31644361 Free PMC article.
-
The regulation of Net1/Cdc14 by the Hog1 MAPK upon osmostress unravels a new mechanism regulating mitosis.Cell Cycle. 2020 Sep;19(17):2105-2118. doi: 10.1080/15384101.2020.1804222. Epub 2020 Aug 14. Cell Cycle. 2020. PMID: 32794416 Free PMC article. Review.
-
Stable Pom1 clusters form a glucose-modulated concentration gradient that regulates mitotic entry.Elife. 2019 May 3;8:e46003. doi: 10.7554/eLife.46003. Elife. 2019. PMID: 31050341 Free PMC article.
-
Reprogramming Cdr2-Dependent Geometry-Based Cell Size Control in Fission Yeast.Curr Biol. 2019 Jan 21;29(2):350-358.e4. doi: 10.1016/j.cub.2018.12.017. Epub 2019 Jan 10. Curr Biol. 2019. PMID: 30639107 Free PMC article.
References
-
- Michea L., Ferguson D. R., Peters E. M., Andrews P. M., Kirby M. R., and Burg M. B. (2000) Cell cycle delay and apoptosis are induced by high salt and urea in renal medullary cells. Am. J. Physiol. Renal Physiol. 278, F209–F218 - PubMed
-
- Bulavin D. V., Higashimoto Y., Popoff I. J., Gaarde W. A., Basrur V., Potapova O., Appella E., and Fornace A. J. Jr. (2001) Initiation of a G2/M checkpoint after ultraviolet radiation requires p38 kinase. Nature 411, 102–107 - PubMed
MeSH terms
Substances
Grants and funding
LinkOut - more resources
Full Text Sources
Other Literature Sources
Molecular Biology Databases
Miscellaneous
