Fructooligosaccharide (FOS) and Galactooligosaccharide (GOS) Increase Bifidobacterium but Reduce Butyrate Producing Bacteria with Adverse Glycemic Metabolism in healthy young population
- PMID: 28924143
- PMCID: PMC5603605
- DOI: 10.1038/s41598-017-10722-2
Fructooligosaccharide (FOS) and Galactooligosaccharide (GOS) Increase Bifidobacterium but Reduce Butyrate Producing Bacteria with Adverse Glycemic Metabolism in healthy young population
Abstract
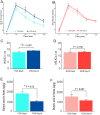
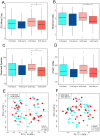
The gut microbiota has been implicated in glucose intolerance and its progression towards type-2 diabetes mellitus (T2DM). Relevant randomized clinical trial with prebiotic intervention was inadequate. We sought to evaluate the impact of fructooligosaccharides (FOS) and galactooligosaccharides (GOS) on glycemia during oral glucose tolerance test (OGTT) and intestinal microbiota. A randomized double-blind cross-over study was performed with 35 adults treated with FOS and GOS for 14 days (16 g/day). Faeces sampling, OGTT and anthropometric parameters were performed. Short-term intake of high-dose prebiotics had adverse effect on glucose metabolism, as in FOS intervention demonstrated by OGTT (P < 0.001), and in GOS intervention demonstrated by fasting glucose (P < 0.05). A significant increase in the relative abundance of Bifidobacterium was observed both in FOS and GOS group, while the butyrate-producing bacteria like Phascolarctobacterium in FOS group and Ruminococcus in GOS group were decreased. A random forest model using the initial microbiota was developed to predict OGTT levels after prebiotic intervention with relative success (R = 0.726). Our study alerted even though FOS and GOS increased Bifidobacterium, they might have adverse effect on glucose metabolism by reducing butyrate-producing microbes. Individualized prebiotics intervention based on gut microbiome needs to be evaluated in future.
Conflict of interest statement
The authors declare that they have no competing interests.
Figures


Similar articles
-
[A machine learning model based on initial gut microbiome data for predicting changes of Bifidobacterium after prebiotics consumption].Nan Fang Yi Ke Da Xue Xue Bao. 2018 Mar 20;38(3):251-260. doi: 10.3969/j.issn.1673-4254.2018.03.03. Nan Fang Yi Ke Da Xue Xue Bao. 2018. PMID: 29643029 Free PMC article. Clinical Trial. Chinese.
-
Probiotic Bifidobacterium strains and galactooligosaccharides improve intestinal barrier function in obese adults but show no synergism when used together as synbiotics.Microbiome. 2018 Jun 28;6(1):121. doi: 10.1186/s40168-018-0494-4. Microbiome. 2018. PMID: 29954454 Free PMC article. Clinical Trial.
-
A prospective randomized, double-blind, placebo-controlled, dose-response relationship study to investigate efficacy of fructo-oligosaccharides (FOS) on human gut microflora.Sci Rep. 2019 Apr 2;9(1):5473. doi: 10.1038/s41598-019-41837-3. Sci Rep. 2019. PMID: 30940833 Free PMC article. Clinical Trial.
-
Genetic mechanisms of prebiotic oligosaccharide metabolism in probiotic microbes.Annu Rev Food Sci Technol. 2015;6:137-56. doi: 10.1146/annurev-food-022814-015706. Epub 2014 Dec 19. Annu Rev Food Sci Technol. 2015. PMID: 25532597 Review.
-
Bifidobacterium fermented milk and galacto-oligosaccharides lead to improved skin health by decreasing phenols production by gut microbiota.Benef Microbes. 2014 Jun 1;5(2):121-8. doi: 10.3920/BM2012.0066. Benef Microbes. 2014. PMID: 23685373 Review.
Cited by
-
Synbiotic Effects of Lacticaseibacillus paracasei K56 and Prebiotics on the Intestinal Microecology of Children with Obesity.Probiotics Antimicrob Proteins. 2024 Nov 6. doi: 10.1007/s12602-024-10395-0. Online ahead of print. Probiotics Antimicrob Proteins. 2024. PMID: 39503979
-
A Bayesian method for identifying associations between response variables and bacterial community composition.PLoS Comput Biol. 2022 Jul 6;18(7):e1010108. doi: 10.1371/journal.pcbi.1010108. eCollection 2022 Jul. PLoS Comput Biol. 2022. PMID: 35793382 Free PMC article.
-
Novel nutraceutical supplements with yeast β-glucan, prebiotics, minerals, and Silybum marianum (silymarin) ameliorate obesity-related metabolic and clinical parameters: A double-blind randomized trial.Front Endocrinol (Lausanne). 2023 Jan 27;13:1089938. doi: 10.3389/fendo.2022.1089938. eCollection 2022. Front Endocrinol (Lausanne). 2023. PMID: 36778595 Free PMC article. Clinical Trial.
-
Probiotics and prebiotics potential for the care of skin, female urogenital tract, and respiratory tract.Folia Microbiol (Praha). 2020 Apr;65(2):245-264. doi: 10.1007/s12223-019-00759-3. Epub 2019 Nov 26. Folia Microbiol (Praha). 2020. PMID: 31773556 Free PMC article. Review.
-
Resistant Starch Consumption Effects on Glycemic Control and Glycemic Variability in Patients with Type 2 Diabetes: A Randomized Crossover Study.Nutrients. 2021 Nov 12;13(11):4052. doi: 10.3390/nu13114052. Nutrients. 2021. PMID: 34836304 Free PMC article. Clinical Trial.
References
Publication types
MeSH terms
Substances
LinkOut - more resources
Full Text Sources
Other Literature Sources
Medical

