. 2017 Sep 18;7(1):11762.
doi: 10.1038/s41598-017-12084-1.

DNA Methylomes Reveal Biological Networks Involved in Human Eye Development, Functions and Associated Disorders

Affiliations

DNA Methylomes Reveal Biological Networks Involved in Human Eye Development, Functions and Associated Disorders

María Berdasco et al. Sci Rep. .

Abstract

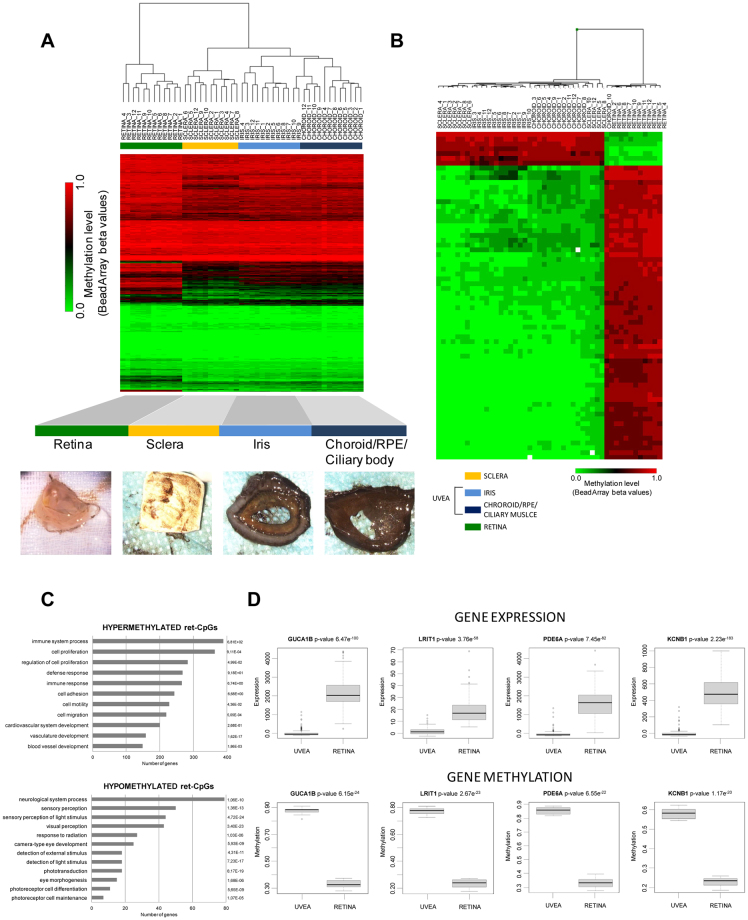
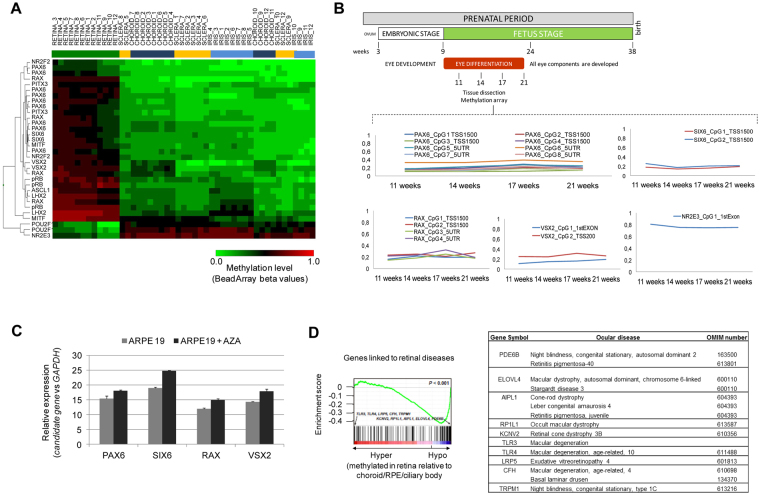
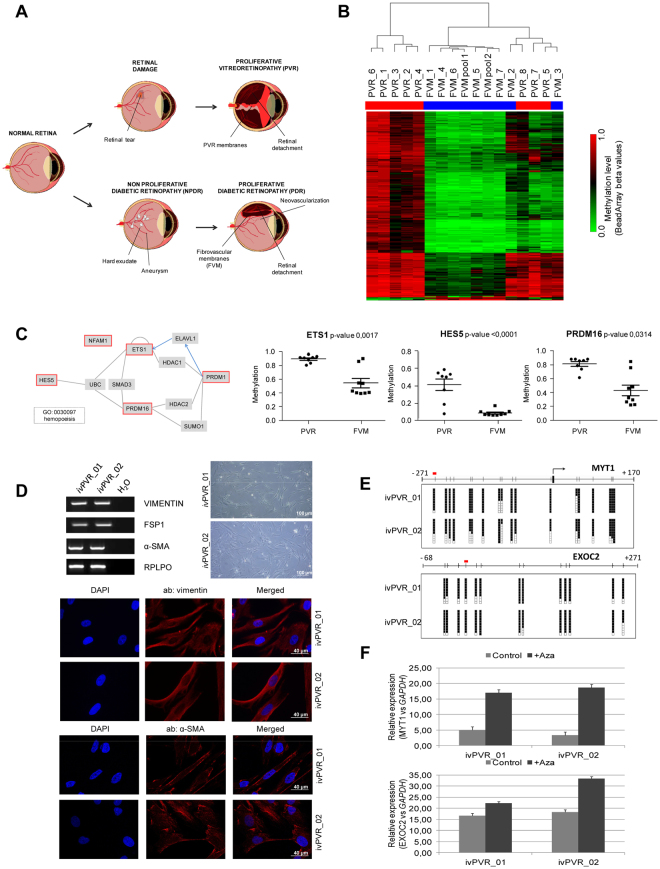
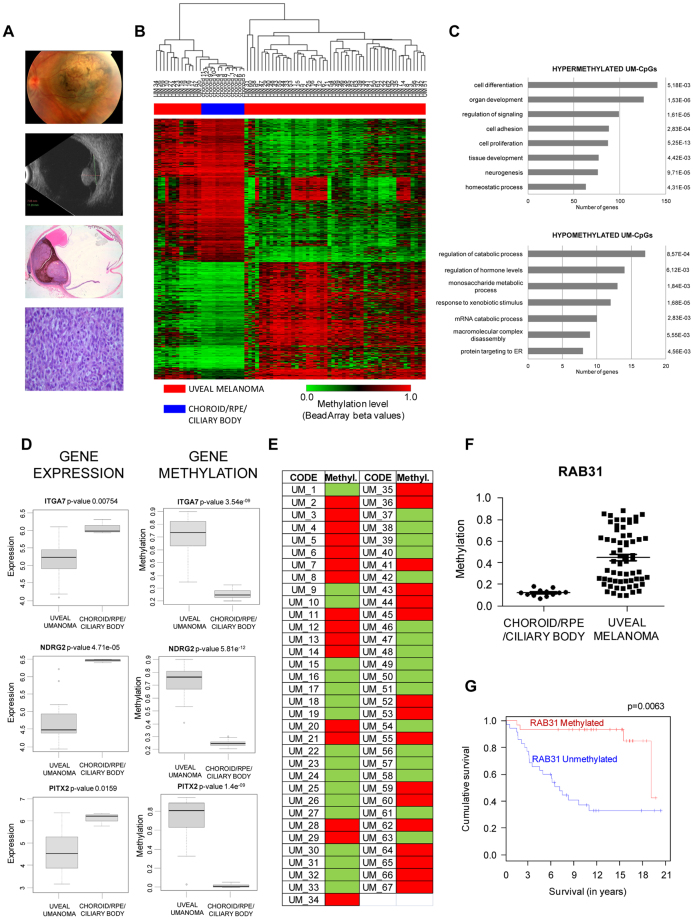
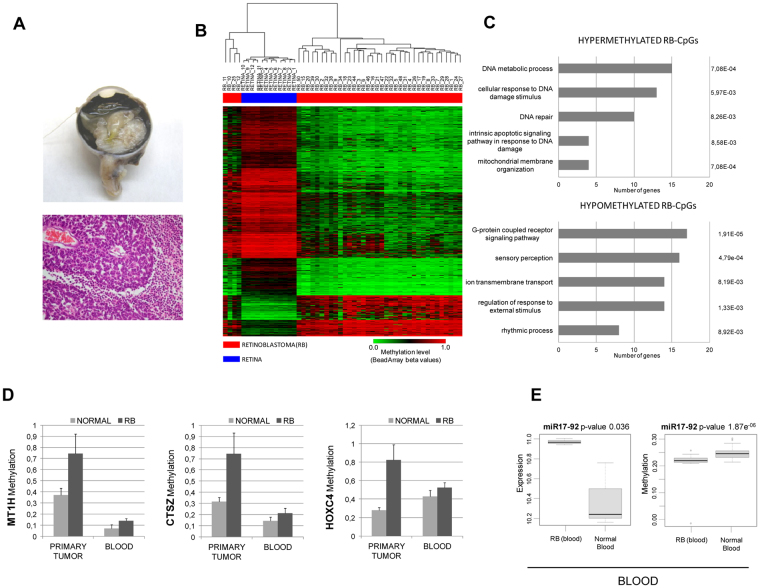
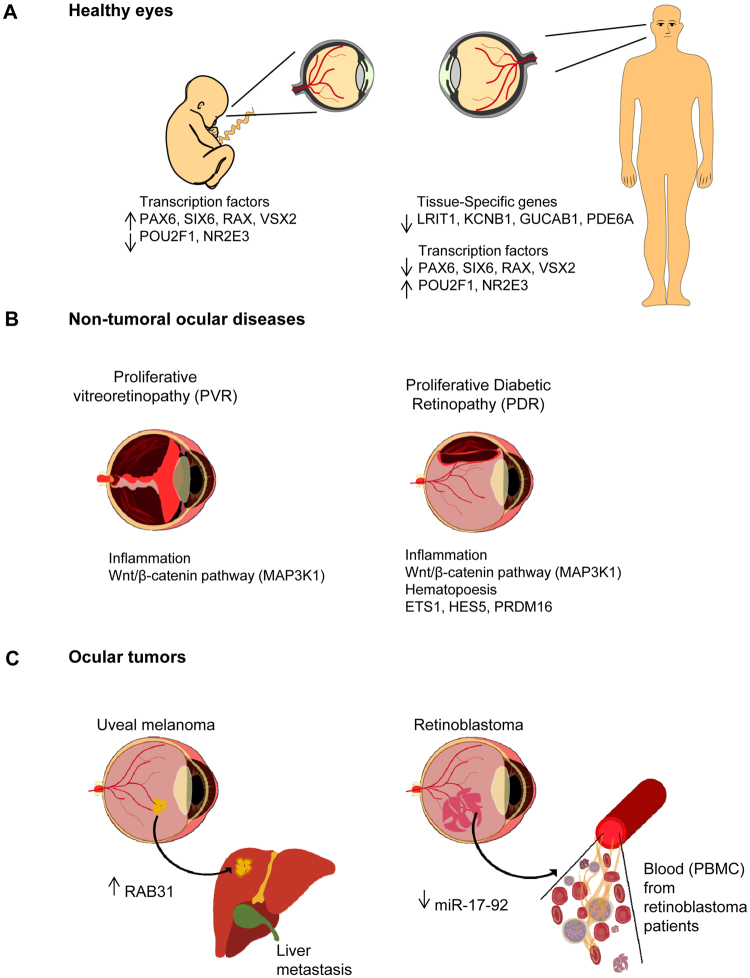
This work provides a comprehensive CpG methylation landscape of the different layers of the human eye that unveils the gene networks associated with their biological functions and how these are disrupted in common visual disorders. Herein, we firstly determined the role of CpG methylation in the regulation of ocular tissue-specification and described hypermethylation of retinal transcription factors (i.e., PAX6, RAX, SIX6) in a tissue-dependent manner. Second, we have characterized the DNA methylome of visual disorders linked to internal and external environmental factors. Main conclusions allow certifying that crucial pathways related to Wnt-MAPK signaling pathways or neuroinflammation are epigenetically controlled in the fibrotic disorders involved in retinal detachment, but results also reinforced the contribution of neurovascularization (ETS1, HES5, PRDM16) in diabetic retinopathy. Finally, we had studied the methylome in the most frequent intraocular tumors in adults and children (uveal melanoma and retinoblastoma, respectively). We observed that hypermethylation of tumor suppressor genes is a frequent event in ocular tumors, but also unmethylation is associated with tumorogenesis. Interestingly, unmethylation of the proto-oncogen RAB31 was a predictor of metastasis risk in uveal melanoma. Loss of methylation of the oncogenic mir-17-92 cluster was detected in primary tissues but also in blood from patients.


Conflict of interest statement

The authors declare that they have no competing interests.

Figures

Figure 1
Figure 1
Comparative CpG methylation analysis of main ocular tissues. (A) Unsupervised heatmap clustering of β-values from CpG methylation array of the four eye tissues. Post-mortem whole eyes without ocular diseases were dissected into: (i) iris, (ii) choroid/RPE/ciliary body, (iii) sclera and (iv) retina. Red and green colors indicate high and low levels of DNA methylation, respectively. (B) Hierarchical clustering using the 24,683 significantly differentially methylated CpGs in the retina (ret-CpGs) and the remaining ocular tissues analyzed in the array. (C) Gene ontology analysis of genes associated with hypermethylated ret-CpGs (above) and hypomethylated ret-CpGs (below). The length of each bar is proportional to the number of differentially expressed genes in the functional category. Numbers on the right represent the statistically significant p-values associated with a one-sided Fisher’s exact test. (D) Correlation analysis of gene expression data from GEO Omnibus database GSE29801 (above) and CpG methylation value obtained from Infinium 450 K array (below) for four retina-specific hypomethylated genes (GUCA1B, LRIT1, PDE6A and KCNB1).
Figure 2
Figure 2
Epigenetic regulation of retinal transcription factors. (A) Supervised cluster heatmap using the most significant differences (methylation differences higher than 33% and a false-discovery rate < 0.01 in an ANOVA test-adjusted for multiple testing) among retina and the other tissues (sclera, iris and choroid/RPE/ciliary body) contained into transcription factors involved in retina development. (B) β-methylation values of PAX6, SIX6, RAX, VSX2 and NR2E3 retinal transcription factors obtained in retina from human fetus at weeks 11, 14, 17 and 21 of gestation. (C) Quantitative reverse transcription-PCR (qPCR) analysis of the expression of PAX6, SIX6, RAX and VSX2 transcription factors after and before treatment with the demethylating agent 5-aza-2′-deoxycytidine (AZA) in the hypermethylated retinal pigment epithelial cell line ARPE19. Average of three biological replicates and standard deviations are represented. (D) Gene set enrichment analysis (GSEA) of differentially methylated genes in retina samples with defined roles in ocular diseases. A summary of the most significant genes and their ocular diseases is shown.
Figure 3
Figure 3
DNA methylation profile of fibrovascular membranes in diabetic retinopathy and rhegmatogenous retinal detachment. (A) Schematic depiction of the retinal detachment models used in the methylation study. Above, proliferative vitreoretinopathy (PVR) membranes were obtained from patients with rhegmatogenous retinal detachment due to traumatism or complications after cataract surgery. Below, the diabetic retinopathy model was composed of neuroretinas from non-proliferative diabetic retinopathy (NPDR) patients and fibrovascular membranes (FVM) in advanced proliferative disease. Normal neuroretinas were used as controls in both models. (B) Supervised hierarchical clustering using the 293 significantly differentially methylated CpGs between PVR and FVM membranes. (C) Left, interaction graph of genes from the hemopoiesis pathway containing FVM-CpGs in their regulatory regions. Blue arrows represent protein-RNA interactions; grey arrows indicate protein-protein interactions. Genes in red boxes are those containing FVM-CpGs. Right, significant methylation differences of ETS1, HES5 and PRDM16 genes between FVM and PVR membranes. (D) Characterization of in vitro-cultured fibroblasts from patients with PVR. Vitreous samples obtained from two patients at the outset of vitrectomy surgery were cultured under in vitro conditions. The resulting growing cells exhibit fibroblast morphology (left, below). Fibroblast markers (vimentin, fibroblast specific protein 1 (FSP1) and alpha-smooth muscle antigen (α-SMA) were studied by RT-PCR (left, above) and immunofluorescence (right). Ribosomal protein, large, P0 (RPLPO) genes were used as an endogenous control. (E) Bisulfite sequencing of MYT1 and EXOC2 promoter in in vitro-cultured fibroblasts from patients with PVR. CpG dinucleotides are represented as short vertical lines. Results of bisulfite genomic sequencing of 10 individual clones are shown. The presence of a methylated or unmethylated cytosine is indicated by a black or white square, respectively. The CpGs included in the methylation array are indicated by a red box. (F) Quantitative reverse transcription-PCR (qPCR) analysis of the expression of hypermethylated genes in PVR membranes (MYT1 and EXOC2) before and after treatment with the demethylating agent 5-aza-2′-deoxycytidine (AZA) in the hypermethylated in vitro PVR cell lines. Average of three biological replicates and standard deviations are represented. ivPVR; in vitro cells derived from proliferative vitreoretinopathy patients.
Figure 4
Figure 4
Epigenetic regulation in uveal melanoma. (A) From up to down, image of a choroidal melanoma in the posterior pole; an ultrasound image showing the Bruch membrane rupture secondary to tumor growth; example of an enucleated eye showing a mixed epithelioid spindle cell melanoma. (B) Supervised hierarchical clustering using the 1,841 significantly differentially methylated CpGs in uveal melanoma (UM-CpGs). (C) Gene ontology analysis of genes associated with hypermethylated UM-CpGs (above) and hypomethylated UM-CpGs (below). The length of each bar is proportional to the number of differentially expressed genes in the functional category. Numbers on the right represent the statistically significant p-values associated with a one-sided Fisher’s exact test. (D) Correlation analysis of gene expression data from GEO Omnibus database GSE51880 y GSE20986 (left) and CpG methylation value obtained from Infinium 450 K array (right) for ITGA7, NDRG2 and PITX2 genes. (E) Analysis of RAB31 promoter methylation by methylation-specific PCR in a validation cohort of uveal melanoma samples (n = 67). Red and green squares indicate hypermethylated or unmethylated CpG region, respectively. (F) Methylation values for RAB31 in normal choroid/RPE/ciliary body and uveal melanoma inferred from methylation array. (G) Kaplan–Meier analysis of RAB31 promoter hypermethylation in uveal melanoma patients. RAB31 promoter hypermethylation was significantly associated with lower overall survival (p = 0.0063).
Figure 5
Figure 5
Retinoblastoma has a specific CpG methylation signature in primary tumors and blood. (A) Representative retinoblastoma from stage E occupying more than half of the eye that was finally enucleated. Pathological studies disclosed a moderately differentiated retinoblastoma with areas of necrosis (hematoxylin and eosin staining). (B) Supervised hierarchical clustering approach using the 15,428 significantly differentially methylated CpGs in primary tumors from retinoblastoma (RB-CpGs). (C) Gene ontology analysis of genes associated with hypermethylated RB-CpGs (above) and hypomethylated RB-CpGs (below). The length of each bar is proportional to the number of differentially expressed genes in the functional category. Numbers on the right represent the statistically significant p-values associated with a one-sided Fisher’s exact test. (D) Three representative genes (MT1H, CTSZ and HOXC4) with increased methylation levels in retinoblastoma samples (from tumor and blood) with respect to their normal counterparts. (E) Gene expression (left) and ß-methylation (right) values obtained from the oncogenic miR17-92 cluster in blood from retinoblastoma patients and healthy children.
Figure 6
Figure 6
Genome-wide CpG methylation screening reveals pathways controlling tissue specificity and ocular-associated disorders. Schematic representation of our proposed candidate genes regulated by CpG methylation that may play a crucial role in maintaining tissue specificity in the eye and in ocular disorders. (A) CpG methylation-mediated silencing of retinal transcription factors from the PAX6 network was found in adult retina. (B) Left panel, inflammation-related genes are epigenetically regulated in fibrotic membranes causing rhegmatogenous retinal detachment (PVR). Right panel, in addition to inflammation- associated genes, CpG methylation of genes involved in the formation of new blood vessels reinforce the role of neovascularization in diabetic retinopathy and its therapeutic use; (C) Left panel, loss of methylation of the RAB31 gene is associated with poor survival and metastatic uveal melanoma; right panel, up-expression of the oncogenic miR-17-92 cluster is linked to loss of methylation in retinoblastoma patients. This epigenetic alteration was also detected in blood samples from retinoblastoma patients.

Similar articles

Cited by

References

    1. Merbs SL, Khan MA, Hackler L, Jr., et al. Cell-specific DNA methylation patterns of retina-specific genes. PLoS One. 2012;7:e32602. doi: 10.1371/journal.pone.0032602. - DOI - PMC - PubMed
    1. Cvekl A, Mitton KP. Epigenetic regulatory mechanisms in vertebrate eye development and disease. Heredity. 2010;105:135–151. doi: 10.1038/hdy.2010.16. - DOI - PMC - PubMed
    1. He S, Li X, Chan N, et al. Review: Epigenetic mechanisms in ocular disease. Mol Vis. 2013;19:665–674. - PMC - PubMed
    1. Yan B, Yao J, Tao ZF, et al. Epigenetics and ocular diseases: from basic biology to clinical study. J Cell Physiol. 2014;229:825–833. doi: 10.1002/jcp.24522. - DOI - PubMed
    1. Chen B, Cepko CL. HDAC4 regulates neuronal survival in normal and diseased retinas. Science. 2009;323:256–259. doi: 10.1126/science.1166226. - DOI - PMC - PubMed

Publication types

MeSH terms