. 2017 Sep 18;7(1):11813.
doi: 10.1038/s41598-017-12185-x.

Ephrin-A2 regulates excitatory neuron differentiation and interneuron migration in the developing neocortex

Affiliations

Ephrin-A2 regulates excitatory neuron differentiation and interneuron migration in the developing neocortex

Jihane Homman-Ludiye et al. Sci Rep. .

Abstract

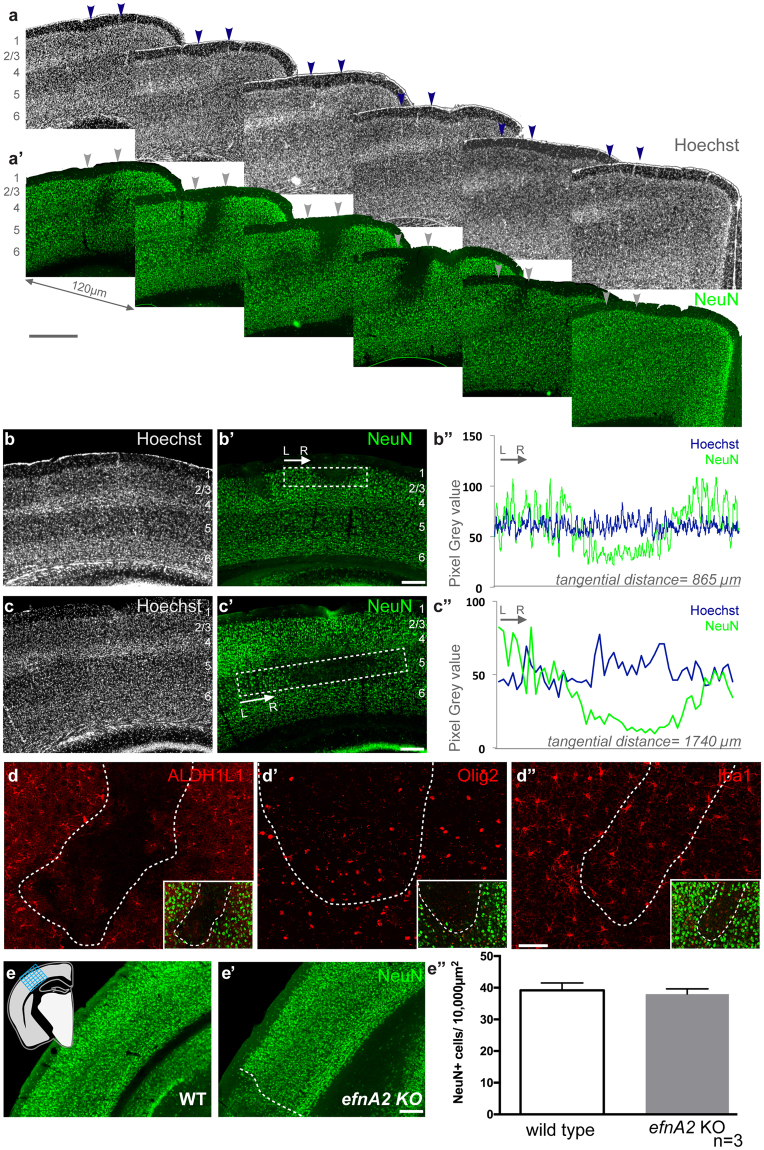
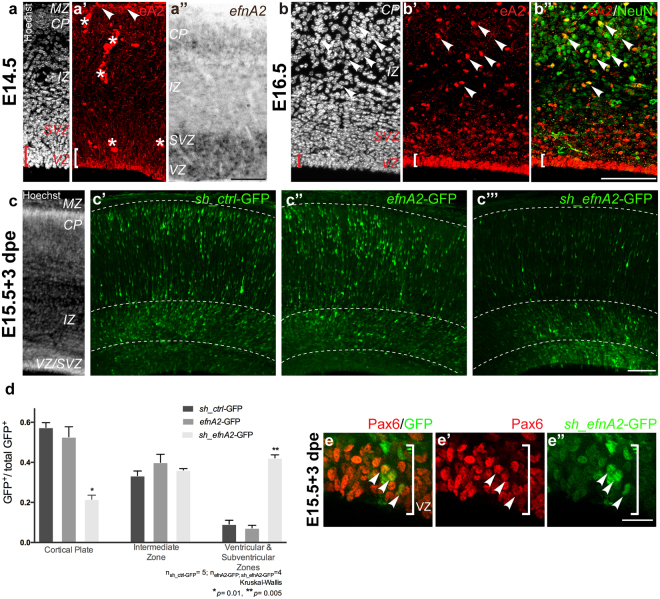
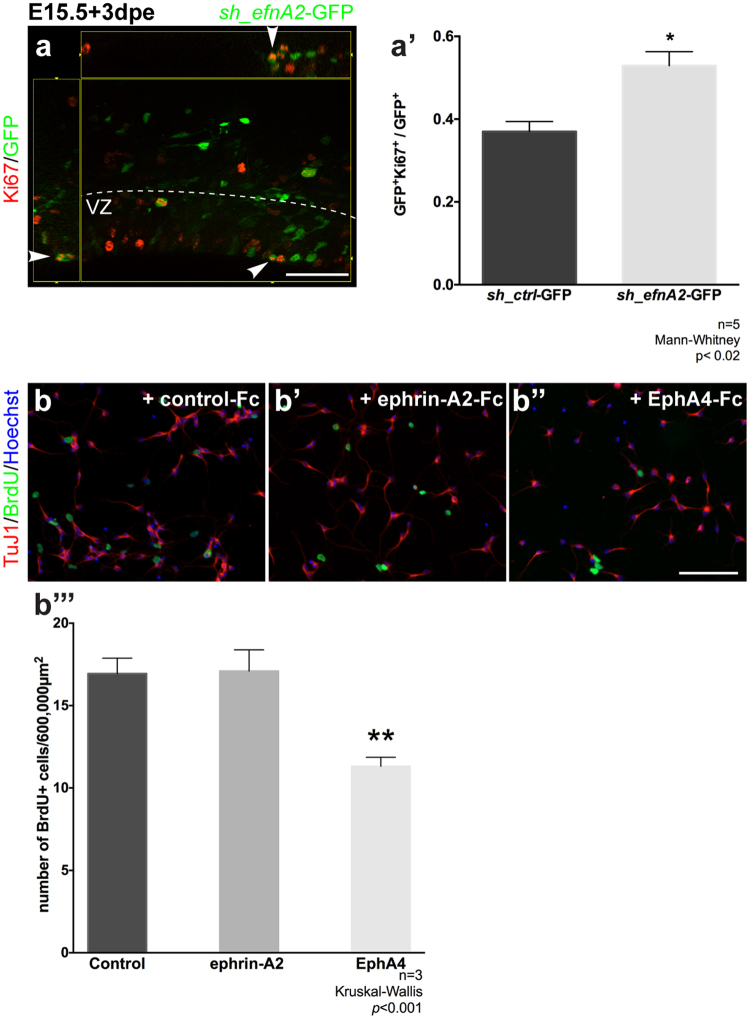
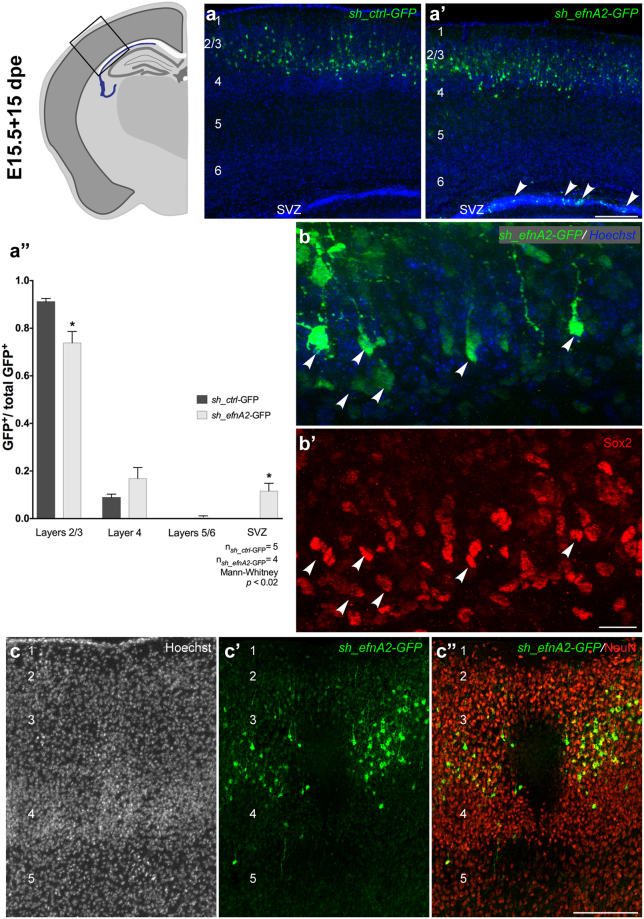
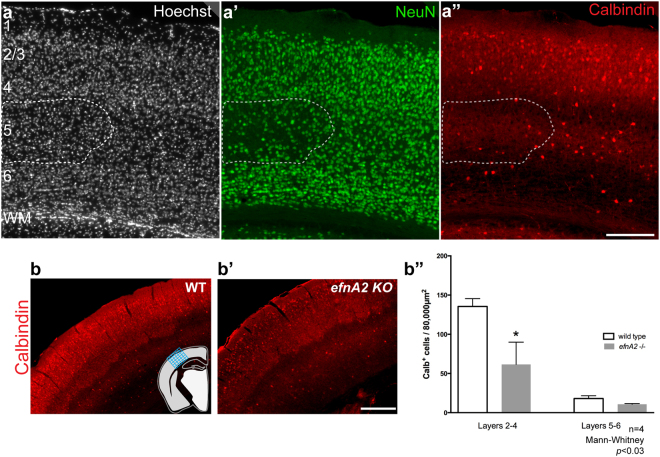
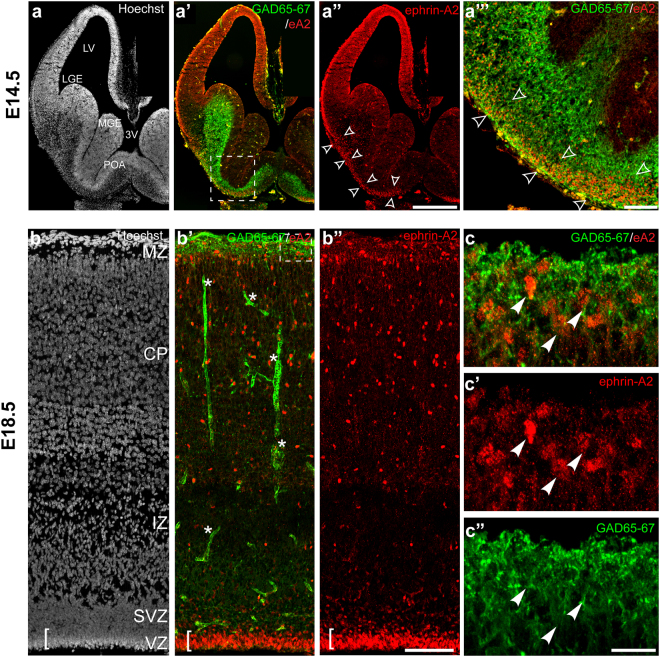
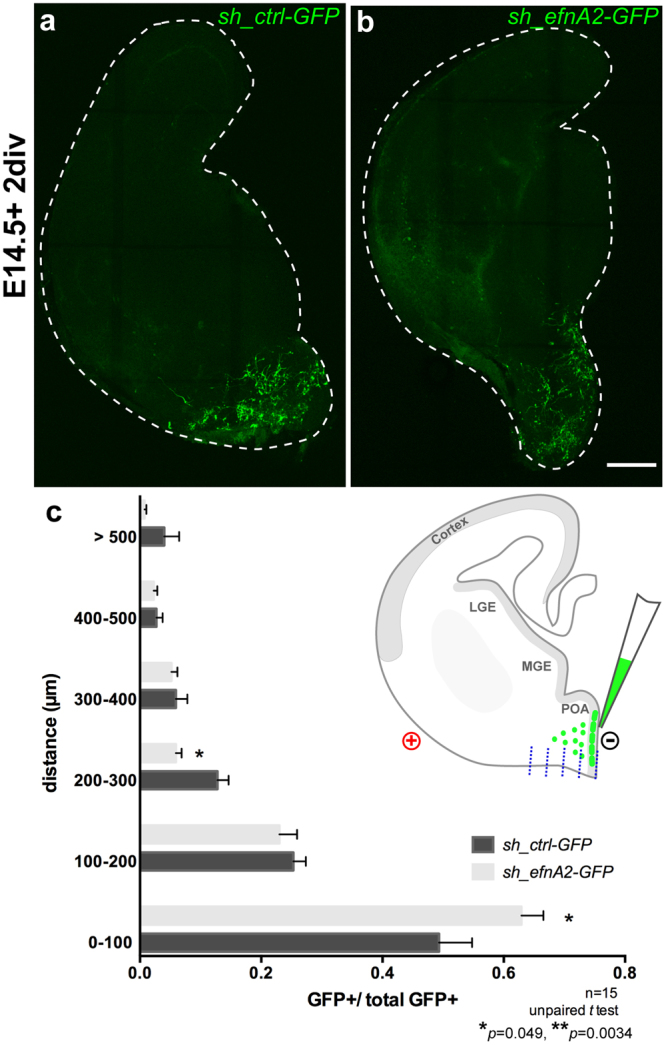
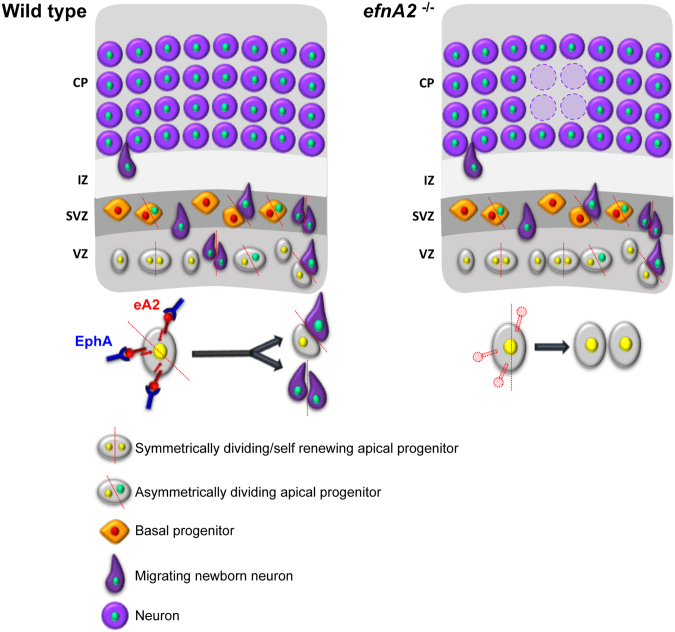
The development of the neocortex requires co-ordination between proliferation and differentiation, as well as the precise orchestration of neuronal migration. Eph/ephrin signaling is crucial in guiding neurons and their projections during embryonic development. In adult ephrin-A2 knockout mice we consistently observed focal patches of disorganized neocortical laminar architecture, ranging in severity from reduced neuronal density to a complete lack of neurons. Loss of ephrin-A2 in the pre-optic area of the diencephalon reduced the migration of neocortex-bound interneurons from this region. Furthermore, ephrin-A2 participates in the creation of excitatory neurons by inhibiting apical progenitor proliferation in the ventricular zone, with the disruption of ephrin-A2 signaling in these cells recapitulating the abnormal neocortex observed in the knockout. The disturbance to the architecture of the neocortex observed following deletion of ephrin-A2 signaling shares many similarities with defects found in the neocortex of children diagnosed with autism spectrum disorder.


Conflict of interest statement

The authors declare that they have no competing interests.

Figures

Figure 1
Figure 1
Characterisation of efnA2 KO adult neocortex. Adjacent coronal sections of efnA2 KO adult brain stained with the nuclear dye Hoechst (a) and labeled with the neuron-specific transcription factor NeuN (a’), arrowheads demarcate the maximum width for this patch of low NeuN density. efnA2 KO neocortex stained with Hoechst (b,c) and labeled with NeuN (b’c’) illustrating abnormal neuronal density in layers 2/3 (bb’) and layer 5 (cc’). (b”c”) Linear graph plot of the signal intensity for each stain measured in the boxed area in (b and c) respectively. efnA2 KO neocortex labeled with the astrocytes marker ALDH1L1 (d), the oligodendrocyte marker Olig2 (d’) and the microglia marker Iba1 (d”), hatched lines delineate regions exhibiting abnormal NeuN density ((dd”) inset). Quantification of NeuN+ cells density in wild type (e) and efnA2 KO (e’) in neocortical regions exhibiting normal laminar architecture ((e”) error bars represent SEM; hatched line in (e’) illustrates an example of zone excluded from the counting frame) in was quantified across all layers by superimposing a grid over the region of interest (schematic in (e)). Scale bars (a’) 250 µm; (b’,c’ and e’) 100 µm; (d”) 50 µm.
Figure 2
Figure 2
Loss of ephrin-A2 in apical progenitors results in reduced neuronal migration and the accumulation of progenitors in the ventricular zone. (a,b,c) Cytoarchitecture of the developing neocortex demarcated with the nuclear dye Hoechst at E14.5, E16.5 and E18.5 in wild type mice (a’) ephrin-A2 immunolabeling at E14.5, (a”) efnA2 messenger in situ hybridisation at E14.5 and (b’) at E16.5 reveals expression in the cells lining the ventricular surface of the lateral ventricle, in the MZ ((a’), arrowheads, *signal autofluorescent blood vessels) and in the cortical plate, double-labeled with NeuN ((b”) arrowheads). (c) Representative illustration of embryonic neocortex harvested at E18.5 stained with Hoechst following electroporation at E15.5 with (c’) GFP-tagged control scrambled shRNA. (c”) GFP-tagged construct coding for efnA2 for overexpression. (c”’) GFP-tagged shRNA to knockdown efnA2 (sh_efnA2-GFP) (d) ratio of GFP+ cells/compartment over the total number of GFP+ cells. (e) High magnification of the VZ of efnA2 knockdown electroporated at E15.5, analyzed at E18.5, sh_efnA2-GFP reporter (green), and Pax6 (magenta) (e’,e”) arrowheads signal electroporated cells also expressing the progenitor cell marker Pax6 (d) non-parametric Kruskal-Wallis test, error bar represent SEM CP cortical plate, IZ intermediate zone, MZ marginal zone, SVZ subventricular zone, VZ ventricular zone Scale bar (a”,b”’,c”’) 100 µm; (e”) 20 µm.
Figure 3
Figure 3
ephrin-A2 reverse signalling inhibits cortical progenitor proliferation. (a) Embryonic neocortex electroporated at E15.5 with GFP-tagged control scrambled shRNA (sh_ctrl-GFP) and GFP-tagged shRNA to knockdown efnA2 (sh_efnA2-GFP) and analyzed 3 days post electroporation (dpe) were labeled with the proliferation marker Ki67 (a’) quantification of the mitotic fraction of electroporated GFP+ cells in the ventricular zone (n = 5; p = 0.01; Mann-Whitney test, error bars represent SEM). (b) Dissociated E14.5 neocortex cultured in presence of BrdU and clustered Fc fragment (control), (b’) ephrin-A2-Fc and (b”) EphA4-Fc, labeled with the neuronal marker TuJ1 (magenta), the thymidine analogue BrdU (green) and counterstained with the nuclear dye Hoechst (white) (b”’) the number of BrdU+ cells was quantified to assess the proliferation after 24 hours in culture. (n = 3; p < 0.001; Kruskal-Wallis test, error bars represent SEM). Scale bar (a) 50 µm; (b”) 100 µm.
Figure 4
Figure 4
Loss of ephrin-A2 prevents neuronal differentiation and disrupts the distribution of excitatory neurons in the postnatal neocortex. Laminar distribution of GFP+ cells at P12 following electroporation at E15.5 (15 days post electroporation dpe) with (a) GFP-tagged control scrambled shRNA (sh_ctrl-GFP) and (a’) GFP-tagged shRNA to knockdown efnA2 (sh_efnA2-GFP), arrowheads in (a’) signal GFP + cells in the subventricular zone (SVZ) (a”) the number of GFP+ cells was quantified in each compartment and expressed as a ratio of the total GFP population (a”) scrambled control shRNA, n = 5; efnA2 shRNA, n = 4; p < 0.02; Mann-Whitney test, error bars represent SEM). GFP+ cells knockdown for efnA2 remaining in the SVZ ((b) arrowheads) express the stem cell marker Sox2 ((b’) arrowheads). (c) Loss of efnA2 does not affect the laminar architecture as revealed by Hoechst staining although distribution of the GFP+ electroporated cells (c’) and density of NeuN+ cells (c”) was profoundly altered. Scale bar (a’,c”) 200 µm; (b’) 20 µm.
Figure 5
Figure 5
Dramatic reduction of calbindin expression throughout the neocortex of efnA2 KO animals. (a) Hoechst nuclei staining of efnA2 KO neocortex demarcating the laminar architecture of the neocortex, double-labeled with (a’) the neuron-specific transcription factor NeuN, (a”) with the interneuron marker calbindin (Cb). Hatched boxes in (aa”) delineate the patches of lower neuronal density. (bb’) Example of Cb staining in the neocortex of adult wild type and efnA2 KO animals, schematic in (b) illustrates the region that was analyzed along the antero-posterior axis of the brain by applying a grid over the zone counted, regions showing abnormal density were demarcated by NeuN double-labeling and excluded. (b”) density of Cb+ interneurons across the neocortical layers of WT and efnA2 KO (n = 4, p < 0.03, Mann-Whitney test, error bars represent SEM); WM white matter; scale bar (a” and b’) 200 µm.
Figure 6
Figure 6
ephrin-A2 is expressed in migrating interneurons. (a) At E14.5 LGE, MGE and POA neurogenic zones lining the ventricular surface have high cell density and appear brighter with Hoechst staining (a’) Cells expressing ephrin-A2 colocalize with the interneuron marker GAD65–67 (boxed region magnified in (a”’)) (a”) ephrin-A2-positive cells form a stream stretching along the ventral surface of the brain from the POA to the neocortex (open arrowheads). (b) Hoechst staining reveals the lamination of the neocortex at E18.5 (b’) Interneurons expressing GAD65–67 populating the neocortex through the MZ colocalize with ephrin-A2+ cells are located in the VZ, the CP and the MZ (*signal blood vessels). (b”) ephrin-A2 expressing cells are also present in the CP and the VZ (c) High magnification of the boxed region in (b’) highlighting ephrin-A2+/GAD65–67+ interneurons (arrowheads) in the MZ entering the CP (c’) ephrin-A2 expression (c”) GAD65–67 expression reveals the radial orientation of the cell processes as interneurons enter the CP CP cortical plate, IZ intermediate zone, LGE lateral ganglionic eminence, LV lateral ventricle, 3 V third ventricle, MGE medial ganglionic eminence, MZ marginal zone, POA preoptic area, SVZ subventricular zone, VZ ventricular zone. Scale bar (a”) 500 µm, (b”) 100 µm, (c”) 20 µm.
Figure 7
Figure 7
Loss of ephrin-A2 reduces migration of POA-born interneurons. Coronal slices of brain electroporated at E14.5 with (a) GFP-tagged control scrambled shRNA (sh_ctrl-GFP) or (b) GFP-tagged shRNA to knockdown efnA2 (sh_efnA2-GFP) and cultured for 48 hours (2 days in vitro div) (c) Electroporated cells migration was established by calculating the ratio of GFP+ cells in 100 µm bin (origin = electroporation site) over the total number of GFP+ cells in the section (schematic in (c) see blue dashed lines) revealing a larger fraction of cells closer to the site of electroporation following sh_efnA2-GFP electroporation (n = 15 independent sections from separate embryos analyzed for each condition, p = 0.049; 0.0034, unpaired t test, error bars represent SEM) Scale bar (b) 200 µm.
Figure 8
Figure 8
Proposed model for ephrin-A2’s role. In normal wildtype, activation of ephrin-A2 reverse signalling following interaction with Eph promotes the asymmetrical or terminal symmetrical division of apical progenitors in the VZ to generate neurons through activation of a pro-neural pathway. In knockout animals, in absence of pro-neural signals, apical progenitors undergo symmetrical self-renewing division leading to a deficit of glutamatergic neurons in the developing cortical plate and accumulation of progenitors. These missing neurons are apparently replaced by other cells which identity is yet to be determined.

Similar articles

Cited by

References

    1. Marín O, Rubenstein JLR. Cell migration in the forebrain. Annu Rev Neurosci. 2003;26:441–483. doi: 10.1146/annurev.neuro.26.041002.131058. - DOI - PubMed
    1. Noctor SC, Martínez-Cerdeño V, Ivic L, Kriegstein AR. Cortical neurons arise in symmetric and asymmetric division zones and migrate through specific phases. Nat Neurosci. 2004;7:136–144. doi: 10.1038/nn1172. - DOI - PubMed
    1. Marín O, Rubenstein JL. A long, remarkable journey: tangential migration in the telencephalon. Nat. Rev. Neurosci. 2001;2:780–790. doi: 10.1038/35097509. - DOI - PubMed
    1. Egger B, Gold KS, Brand AH. Notch regulates the switch from symmetric to asymmetric neural stem cell division in the Drosophila optic lobe. Development. 2010;137:2981–2987. doi: 10.1242/dev.051250. - DOI - PMC - PubMed
    1. Lah GJ, Key B. Dual roles of the chemorepellent axon guidance molecule RGMa in establishing pioneering axon tracts and neural fate decisions in embryonic vertebrate forebrain. Devel Neurobio. 2012;72:1458–1470. doi: 10.1002/dneu.22010. - DOI - PubMed

Publication types

MeSH terms

LinkOut - more resources