. 2017 Sep 18;8(1):570.
doi: 10.1038/s41467-017-00646-w.

Novel ecto-tagged integrins reveal their trafficking in live cells

Affiliations

Novel ecto-tagged integrins reveal their trafficking in live cells

Clotilde Huet-Calderwood et al. Nat Commun. .

Abstract

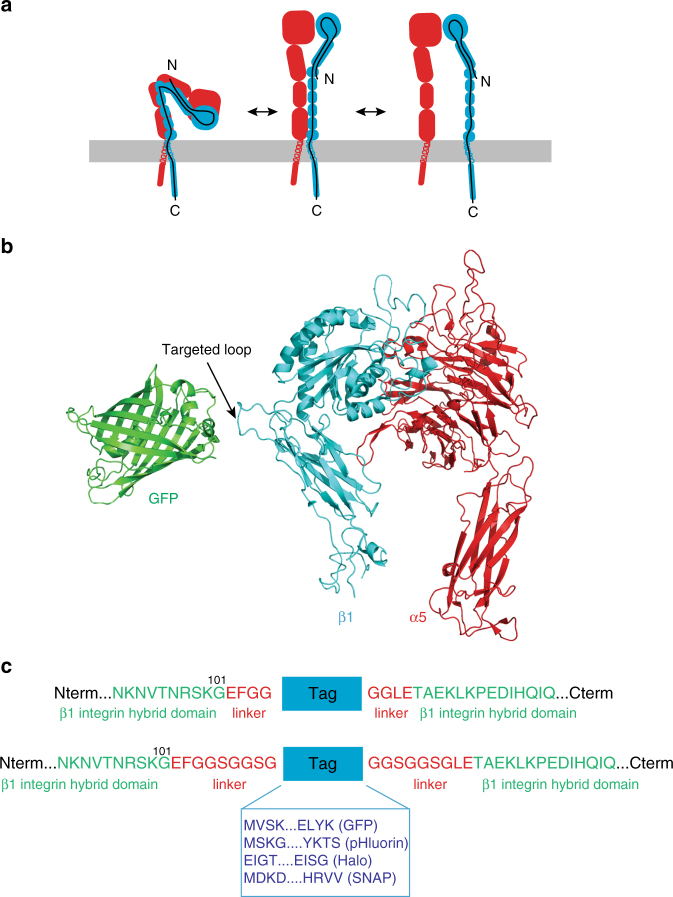
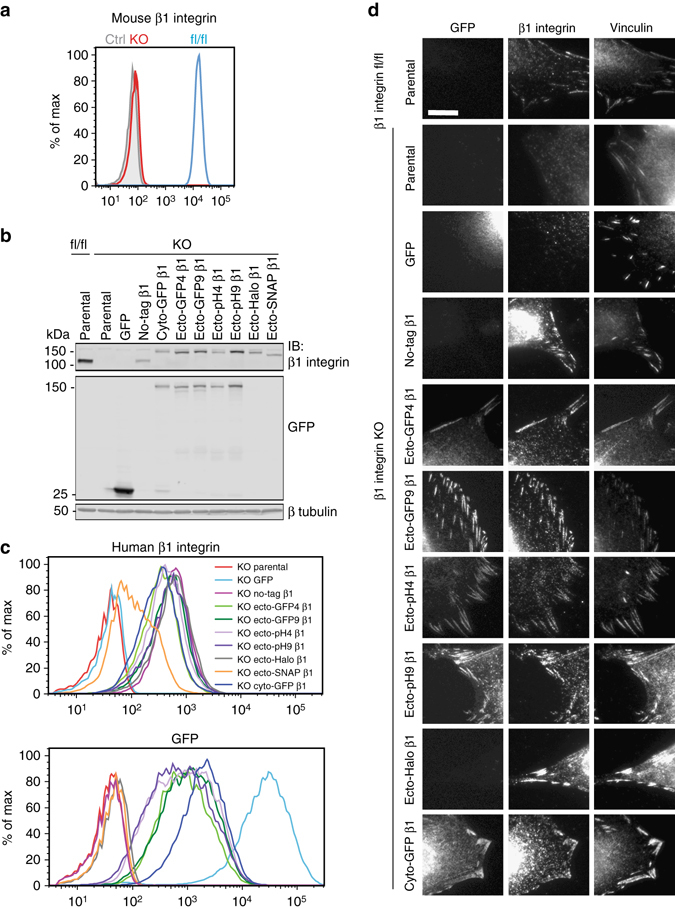
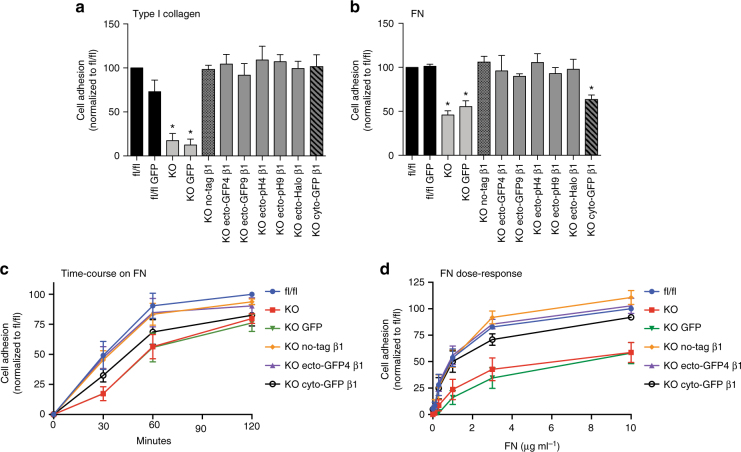
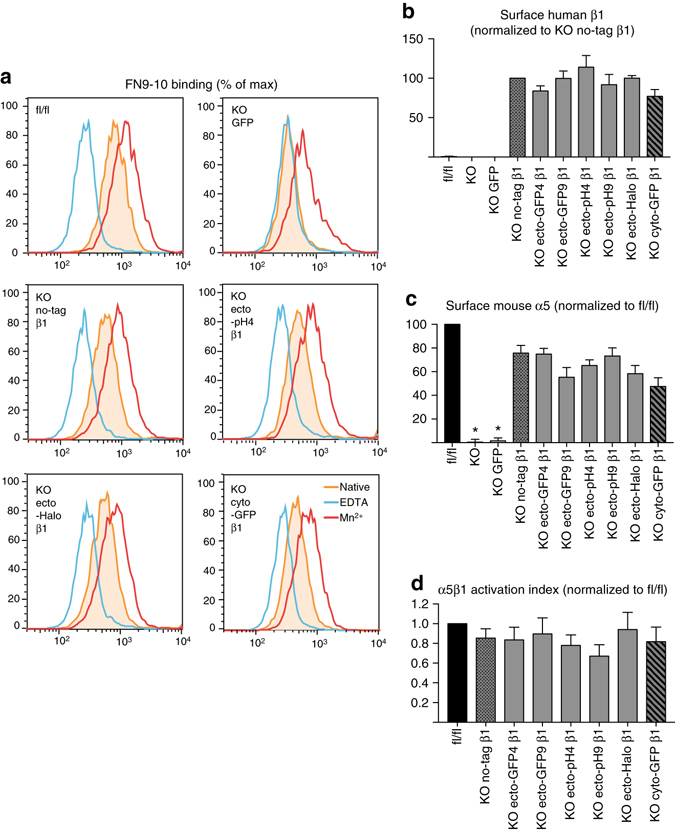
Integrins are abundant heterodimeric cell-surface adhesion receptors essential in multicellular organisms. Integrin function is dynamically modulated by endo-exocytic trafficking, however, major mysteries remain about where, when, and how this occurs in living cells. To address this, here we report the generation of functional recombinant β1 integrins with traceable tags inserted in an extracellular loop. We demonstrate that these 'ecto-tagged' integrins are cell-surface expressed, localize to adhesions, exhibit normal integrin activation, and restore adhesion in β1 integrin knockout fibroblasts. Importantly, β1 integrins containing an extracellular pH-sensitive pHluorin tag allow direct visualization of integrin exocytosis in live cells and revealed targeted delivery of integrin vesicles to focal adhesions. Further, using β1 integrins containing a HaloTag in combination with membrane-permeant and -impermeant Halo dyes allows imaging of integrin endocytosis and recycling. Thus, ecto-tagged integrins provide novel powerful tools to characterize integrin function and trafficking.Integrins are cell-surface adhesion receptors that are modulated by endo-exocytic trafficking, but existing tools to study this process can interfere with function. Here the authors develop β1 integrins carrying traceable tags in the extracellular domain; a pH-sensitive pHlourin tag or a HaloTag to facilitate dye attachment.


Conflict of interest statement

The authors declare no competing financial interests.

Figures

Fig. 1
Fig. 1
Design of an ecto-tagged β1 integrin. a Cartoon of the conformational changes in the integrin heterodimer during integrin activation; α subunit is depicted in red, β subunit in blue, and the black line represents the β subunit polypeptide chain. b Ribbon diagram of the crystal structures of the α5β1 integrin head piece (PDB: 3VI4) and GFP (PDB: 1GFL). The hybrid domain loop into which ecto-tags were inserted is indicated. c Zoom-in on the amino acid sequence of human ecto-tagged β1 integrins at the tag insertion site. Each ecto-tag (GFP, pHluorin, Halo, and SNAP, in blue, N- and C-terminal sequences specified) was inserted into the hybrid domain of human β1 integrin between residues Gly101 and Tyr102 (in green). Linkers of 4 or 9 amino acids (in red) were added on each side of the tag to facilitate cloning and provide flexibility
Fig. 2
Fig. 2
Ecto-tagged β1 integrins translocate to the cell surface and target to FAs. a Flow cytometric analysis of cell surface levels of mouse β1 integrin in β1 integrin fl/fl (blue peak) and KO fibroblasts (red peak), and control unstained KO fibroblasts (gray peak). b Immunoblot detection of endogenous and ectopic β1 integrins in lysates of 100,000 fl/fl and KO fibroblasts using a pan-β1 integrin antibody (top panel) and an anti-GFP antibody (middle panel). Tubulin was used as a loading control (bottom panel). Uncropped blots are available in Supplementary Fig. 10. c Flow cytometric analysis of cell surface levels of human β1 integrins (top panel) and GFP fluorescence (bottom panel) in parental and reconstituted β1 integrin KO fibroblasts. d Microscopy images of parental and reconstituted fl/fl and KO fibroblasts showing GFP epifluorescence (left column), β1 integrin immunofluorescence with 9EG7 antibody (center column), and vinculin immunofluorescence (right column). Scale bar, 10 μm
Fig. 3
Fig. 3
Ecto-tagged β1 integrins rescue the adhesion defect of β1 integrin KO fibroblasts. a Adhesion of parental and reconstituted β1 integrin fl/fl and KO fibroblasts 2 h after plating on wells coated with 3 μg ml−1 type I collagen. b Adhesion of parental and reconstituted β1 integrin fl/fl and KO fibroblasts 1 h after plating on wells coated with 3 μg ml−1 FN. c Time course of adhesion of parental and reconstituted β1 integrin fl/fl and KO fibroblasts on wells coated with 3 μg ml−1 FN. d Dose-response adhesion assay of parental and reconstituted β1 integrin fl/fl and KO fibroblasts for 1 h to wells coated with increasing concentrations of FN. In all experiments, cell adhesion was measured by the absorbance at 570 nm after Crystal Violet staining. Data is shown as mean ± SEM from three independent experiments. In a, b, statistical analysis was performed using one-way repeated measures ANOVA with Dunnett post hoc test. Each column was compared to fl/fl and *p < 0.05
Fig. 4
Fig. 4
Ecto-tagged β1 integrins bind soluble ligand, restore surface levels of endogenous α5 integrins, and display normal activation indices. a Flow cytometry histograms showing binding of soluble FN9-10 to parental and a subset of reconstituted KO fibroblasts, in native conditions (filled orange peak), EDTA-inhibited conditions (blue peak), or Mn2 + -treated conditions (red peak). Full data set in Supplementary Fig. 3a. b, c Quantification of surface levels of human β1 (b) and mouse α5 integrins (c) measured by flow cytometry on parental and reconstituted β1 integrin fl/fl and KO fibroblasts. d Activation index of surface α5β1 integrins on parental and reconstituted β1 integrin fl/fl and KO fibroblasts, calculated as (FN9-10 binding in native conditions—FN9-10 binding in EDTA-inhibited conditions)/surface levels of α5 integrins. All data bd is shown as mean ± SEM from four independent experiments. Statistical analysis was performed using one-way repeated measures ANOVA with Dunnett post hoc test. Each column was compared to KO no-tag β1 and *p < 0.05
Fig. 5
Fig. 5
Visualization of ecto-pHluorin-β1 integrin exocytosis in live cells by TIRFM. a, b Overlay images of ecto-pH4 β1 integrins prior to photobleaching to mark the footprint of FA (magenta) in KO fibroblasts reconstituted with ecto-pH4 β1 integrin (a) or HeLa cells overexpressing ecto-pH4 β1 integrin (b), and, the maximum projection of ecto-pH4 β1 integrin fusion events after photobleaching (fusions, green label; Supplementary Movies 1 and 2). Scale bar, 10 µm. Top left corner insets show fusion events (green) in close proximity to FA (magenta) (a, b; dashed line square). Scale bar, 2 µm. c, d, Galleries of single ecto-pH4 β1 integrin fusion events over time (solid squares on a, b; 0.25 s between images). Yellow circle denotes event in which the vesicle signal intensity of the ecto-pH4 β1 integrin fluorescence rapidly intensifies, likely due to de-acidification upon opening of the fusion pore. Scale bar, 2.5 µm. e Surface plot analysis of a fusion event showing the increase on the full-width half maximum (FWHM) of the signal peak over time, consistent with bona fide full vesicle fusion (yellow lines; 0.25 s between plots). f Temporal alignment of fusion events detected on reconstituted KO fibroblasts (black line) or HeLa cells (gray line) cells showed the expected changes in ecto-pH4 β1 integrin during fusion. Data are shown as mean ± SEM for 67 and 44 events, respectively (2 cells for each)
Fig. 6
Fig. 6
Spatial distribution analysis of ecto-pH4 β1 integrin fusion events supports direct integrin delivery to FAs. a Left panel, Distribution of fusion events (blue crosses) and FAs (white) detected by TIRFM in two KO fibroblasts reconstituted with ecto-pH4 β1 integrins (β1-pH). Center panel, the distance of fusion events to the nearest FA (yellow mask) was measured (cyan lines). Right panel, the distance of randomly simulated events around the cell surface (red mask) to the nearest FA were measured (cyan lines). Scale bar, 10 µm. b Cumulative frequency charts for the two cells demonstrating the difference in distance to FA between the measured data (cyan line) and 100 simulations (individual simulation, color lines; mean, black line). c Quantification of the median distance to FAs for β1-pH or TfRc-pH fusion events, and the simulations (β1-pH Sim and TfRc-pH Sim) performed in the same cells. The scatter-box graph shows the mean ± SD for 5 cells and the respective simulation data. Statistical analysis was performed using a two samples Student’s t-test. *p < 0.05, **p < 0.01
Fig. 7
Fig. 7
Selective surface and internal labeling of ecto-Halo β1 integrins demonstrates integrin endocytosis in live cells. a Labeling of surface ecto-Halo β1 integrins in reconstituted KO fibroblasts with Alexa488 Halo ligand and imaging by HILO TIRFM immediately after labeling (0 min). Scale bar, 15 µm. Right panel, movement of Alexa488-positive vesicle-like structures (dashed line rectangle, green arrowheads). Scale bar, 10 µm. b Kymograph of two regions of the cell (blue and red lines) illustrating the dynamics of Alexa488-positive structures before (green arrowheads) and after the addition of Alexa488 quencher antibody (white arrows). c Residual Alexa488 signal after quenching, imaged by HILO TIRFM 50 min post labeling (white arrows). Scale bar, 15 µm. d quantification of normalized ecto-Halo β1 Alexa488 intensity before and after quenching. The line graph shows the mean ± SD of the normalized intensity for 5 cells. e Overlay image of KO fibroblasts reconstituted with ecto-Halo β1 integrins, after sequential labeling with Alexa488 and SiR647 Halo ligands and imaged by TIRFM. Scale bar, 15 µm. Images on the right show the time series of two FAs (dashed line square). Scale bar, 2.5 µm. f Line graph showing the temporal changes in SiR647 and Alexa488 Halo signals in FAs measured by TIRFM during a 30 min period (mean ± SD for 4 FAs). g Scatter-box graph showing the mean ± SD for the ratio of SiR647/Alexa488 Halo signals of 388 and 523 FAs imaged by TIRFM 0 h or 1 h after incubation at 37 °C on fixed samples (6 cells per conditions). Statistical analysis was performed using a two samples Student’s t-test and ***p < 0.001

Similar articles

Cited by

References

    1. Iwamoto DV, Calderwood DA. Regulation of integrin-mediated adhesions. Curr. Opin. Cell Biol. 2015;36:41–47. doi: 10.1016/j.ceb.2015.06.009. - DOI - PMC - PubMed
    1. Morse EM, Brahme NN, Calderwood DA. Integrin cytoplasmic tail interactions. Biochemistry. 2014;53:810–820. doi: 10.1021/bi401596q. - DOI - PMC - PubMed
    1. Campbell, I. D. & Humphries, M. J. Integrin structure, activation, and interactions. Cold Spring Harb. Perspect. Biol. 3, pii:a004994, doi:10.1101/cshperspect.a004994 (2011). - PMC - PubMed
    1. De Franceschi N, Hamidi H, Alanko J, Sahgal P, Ivaska J. Integrin traffic—the update. J. Cell Sci. 2015;128:839–852. doi: 10.1242/jcs.161653. - DOI - PMC - PubMed
    1. Margadant C, Monsuur HN, Norman JC, Sonnenberg A. Mechanisms of integrin activation and trafficking. Curr. Opin. Cell Biol. 2011;23:607–614. doi: 10.1016/j.ceb.2011.08.005. - DOI - PubMed

Publication types