. 2017 Sep 18;7(1):11793.
doi: 10.1038/s41598-017-12139-3.

Pharmacological inhibition of CaMKK2 with the selective antagonist STO-609 regresses NAFLD

Affiliations

Pharmacological inhibition of CaMKK2 with the selective antagonist STO-609 regresses NAFLD

Brian York et al. Sci Rep. .

Abstract

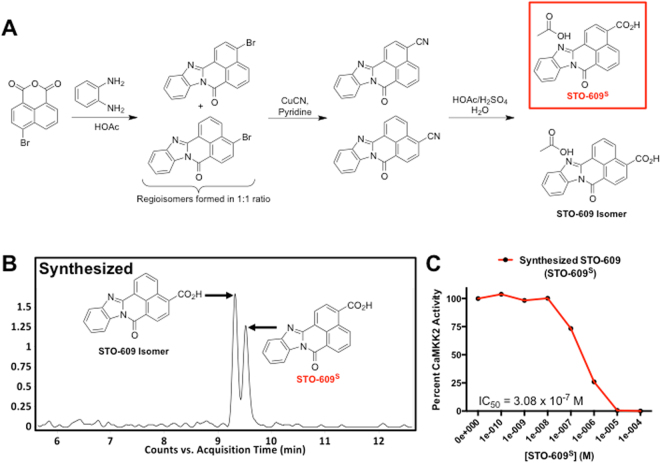
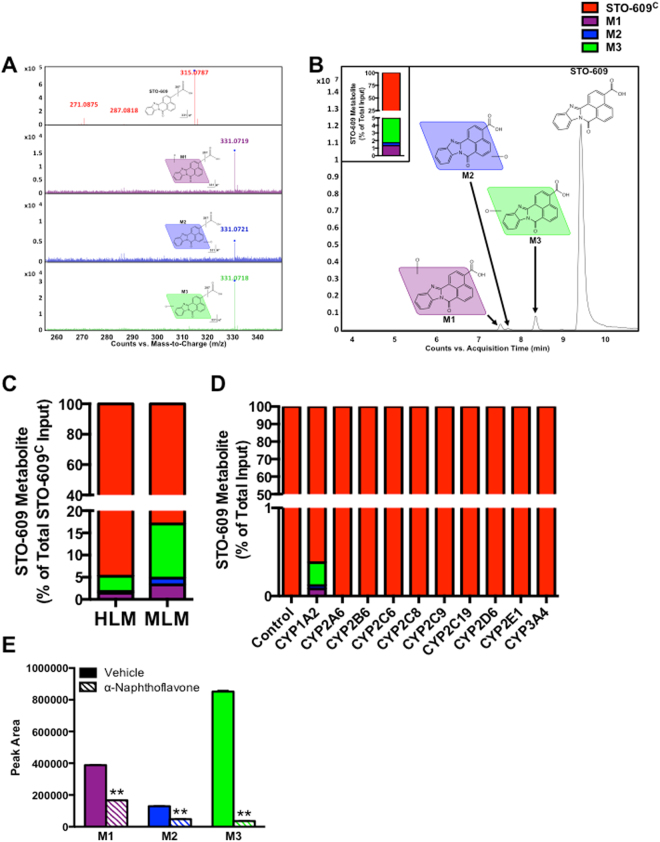
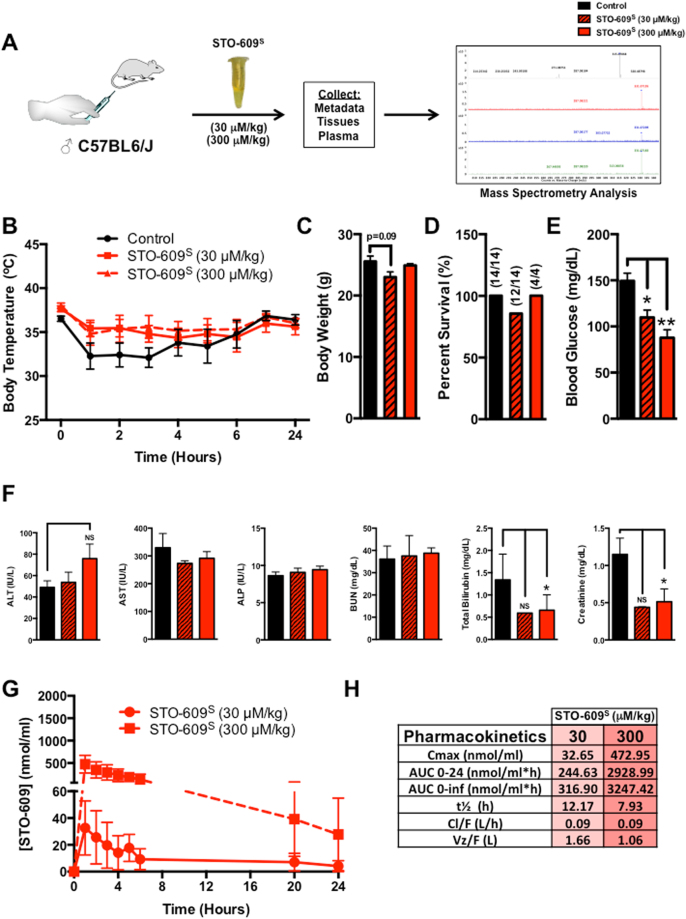
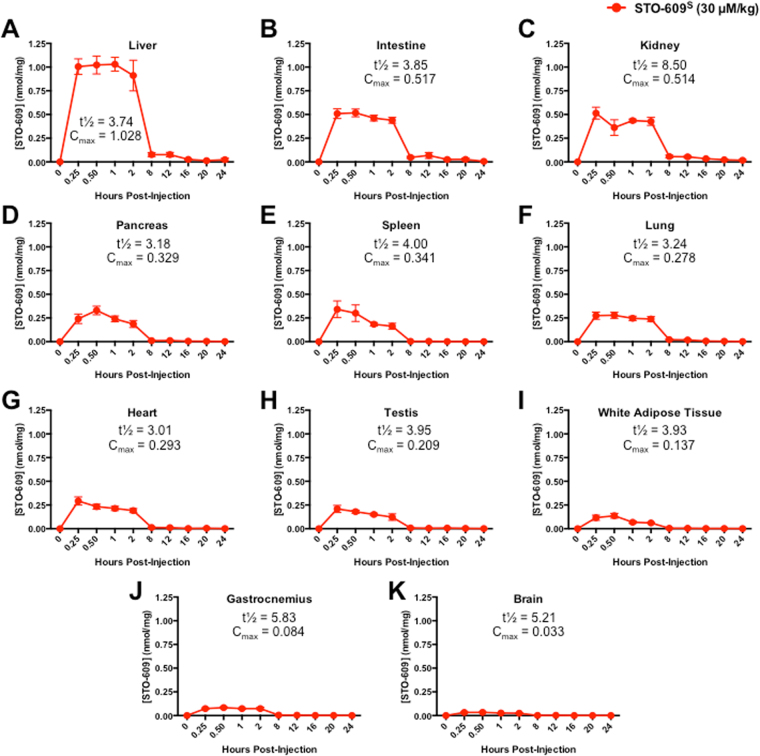
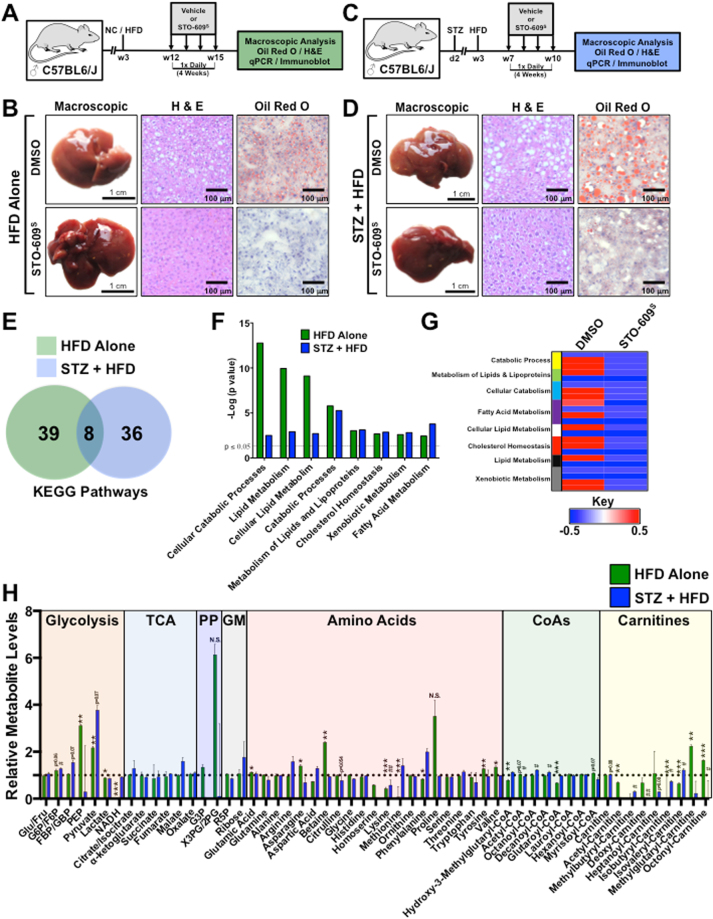
Binding of calcium to its intracellular receptor calmodulin (CaM) activates a family of Ca2+/CaM-dependent protein kinases. CaMKK2 (Ca2+/CaM-dependent protein kinase kinase 2) is a central member of this kinase family as it controls the actions of a CaMK cascade involving CaMKI, CaMKIV or AMPK. CaMKK2 controls insulin signaling, metabolic homeostasis, inflammation and cancer cell growth highlighting its potential as a therapeutic target for a variety of diseases. STO-609 is a selective, small molecule inhibitor of CaMKK2. Although STO-609 has been used extensively in vitro and in cells to characterize and define new mechanistic functions of CaMKK2, only a few studies have reported the in vivo use of STO-609. We synthesized functional STO-609 and assessed its pharmacological properties through in vitro (kinase assay), ex vivo (human liver microsomes) and in vivo (mouse) model systems. We describe the metabolic processing of STO-609, its toxicity, pharmacokinetics and bioavailability in a variety of mouse tissues. Utilizing these data, we show STO-609 treatment to inhibit CaMKK2 function confers protection against non-alcoholic fatty liver disease. These data provide a valuable resource by establishing criteria for use of STO-609 to inhibit the in vivo functions of CaMKK2 and demonstrate its utility for treating metabolically-related hepatic disease.


Conflict of interest statement

The authors declare that they have no competing interests.

Figures

Figure 1
Figure 1
Synthesis and In Vitro Characterization of STO-609. (A) Schematic representation of the organic synthesis of STO-609. The chemical structure of synthesized STO-609 (STO-609S) is highlighted in the red box. (B) Chromatograms of STO-609S showing identification of a unique chemical species with a m/z = 315 ([M + H]+. (C) Quantification of the efficacy STO-609S for inhibition of CaMKK2 activity in a two-step kinase assay. Data are represented as percent CaMKK2 activity in the presence of increasing log doses of STO-609S. The accompanying inset lists the calculated IC50 value for STO-609S. Chemical structures were drawn using ChemBioDraw.
Figure 2
Figure 2
Metabolic Analysis of STO-609 in Human Liver Microsomes. (A) Representative MS/MS spectra of commercial STO-609 (STO-609C) metabolites M1 (purple), M2 (blue) and M3 (green) compared to that of STO-609C (black). (B) Chromatograms of STO-609C (red) and its metabolites (M1 (purple), M2 (blue) and M3 (green)) following incubation with human liver microsomes (HLM). Triplicate incubations were conducted in 1X PBS (pH 7.4) containing STO-609C (30 µM), HLM (1.0 mg/ml) with or without NADPH (1.0 mM). The metabolites were quantified by UHPLC-QTOFMS. The accompanying inset shows the representative amount of each STO-609 metabolite calculated as a percent of total STO-609C. (C) Comparison of STO-609C metabolism in human (HLM) versus mouse liver microsomes (MLM). The metabolites were quantified by UHPLC-QTOFMS. Data are graphed as the representative amount of each STO-609 metabolite calculated as a percent of total STO-609C. (D) cDNA-expressed P450s (CYP1A2, CYP2A6, CYP2B6, CYP2C8, CYP2C9, CYP2C19, CYP2D6, CYP2E1 and CYP3A4) were used to determine the role of individual CYP450 enzymes in the formation of STO-609 metabolites. All samples were analyzed by UHPLC-QTOFMS. Each STO-609 metabolite is represented as a percent of total STO-609C: M1 (purple), M2 (blue) and M3 (green). Conditions where no metabolites of STO-609 were identified are denoted as 100% of unmetabolized STO-609C (red). (E) Validation of CYP1A2 in the formation of M1, M2 and M3 metabolites of STO-609C. Incubations were conducted in 1X PBS (pH 7.4) containing STO-609C (30 µM), α-naphthoflavone (CYP1A2 inhibitor, 6.0 µM), HLM (1.0 mg/ml) and NADPH (1.0 mM). Metabolites were identified by UHPLC-QTOFMS. The peak area of the M1, M2 and M3 metabolites generated from the incubation of STO-609C with HLM in the absence of α-naphthoflavone was set as 100%. All data are expressed as mean ± s.e.m. (n = 3). **P < 0.01. Chemical structures were drawn using ChemBioDraw.
Figure 3
Figure 3
In Vivo Analysis of STO-609 Toxicity and Pharmacokinetics. (A) Schematic overview of the experimental approach for in vivo analysis of STO-609S toxicity and pharmacokinetic properties. Adult male C57BL/6 J mice were i.p. injected with a single dose of STO-609S (30 or 300 μM/kg). (B) Measurement of body temperature at various time points following i.p. injection with a single dose of STO-609S (30 or 300 μM/kg). (C) Body weight measurements for cohorts of C57BL/6 J mice i.p. injected with a single dose of STO-609S (30 and 300 μM/kg). (D) Survival plots for cohorts of C57BL/6 J mice i.p. injected with a single dose of STO-609S (30 and 300 μM/kg). (E) Measurement of blood glucose levels in C57BL/6 J mice (N = 4 per dose) i.p. injected with a single dose of STO-609S (30 and 300 μM/kg). (F) Measurement of plasma alanine aminotransferase (ALT), aspartate aminotransferase (AST), alkaline phosphatase (ALP), blood urea nitrogen (BUN), total bilirubin and creatinine levels in mice (N = 4 per cohort) injected with a single dose of STO-609S (30 or 300 μM/kg). (G) STO-609S plasma concentrations as determined by MS analysis in mice injected with a single dose of STO-609S (30 or 300 μM/kg). Data are represented as the mean STO-609S concentration for each time point ± s.e.m. (H) Pharmacokinetic parameters of STO-609S in plasma. The parameters were calculated using PKSolver®. Definitions: Cmax, maximum (peak) plasma STO-609S concentration; AUC0–24, area under the plasma STO-609S concentration time curve between 0 and 24 h; AUC0-INF, area under the plasma STO-609 concentration time curve between 0 and infinity; t½, elimination half-life of STO-609S; Cl/F, apparent total clearance of STO-609S from plasma; VZ/F, apparent volume of distribution of STO-609S during the terminal phase after non-intravenous administration. Components of Fig. 3 were drawn using ChemBioDraw.
Figure 4
Figure 4
Tissue Distribution of STO-609. (A) STO-609S concentrations in (A) liver, (B) intestine, (C) kidney, (D) pancreas, (E) spleen, (F) lung, (G) heart, (H) testis, (I) white adipose tissue, (J) gastrocnemius and (K) brain as determined by MS analysis in male C57BL6/J mice injected with a single dose of STO-609S (30 μM/kg). Data are represented as the mean STO-609S concentration for each time point ± s.e.m. Calculation of tissue specific t½ and Cmax for STO-609S accompanies each graph.
Figure 5
Figure 5
STO-609 treatment attenuates hallmarks of NAFLD. (A) Schematic overview of the experimental approach for in vivo assessment of STO-609S on hepatic steatosis. Adult male C57BL/6 J mice were maintained on HFD containing 60% calories from fat immediately after weaning for the duration of experiment. After a 12-week exposure to HFD, mice were i.p. injected with either DMSO (vehicle) or STO-609S (30 μM/kg) once per day for 4 weeks. Following the treatment period, mice were sacrificed and livers were isolated for downstream phenotypic and molecular analyses. (B) Representative macroscopic and histological analyses (H&E and Oil Red O staining) of C57BL/6 J mice maintained on HFD following a 4-week regimen of either DMSO (vehicle) or STO-609S (30 μM/kg) treatment. (C) Schematic overview of the experimental approach for in vivo assessment of STO-609S on a second model of hepatic steatosis. Male C57BL/6 J mice were subcutaneously injected at post-natal day 2 with low dose of streptozotocin (STZ) (200 μg) followed by high fat diet feeding containing 60% calories from fat immediately after weaning for the duration of experiment. After a 7-week exposure to HFD, mice were i.p. injected with either DMSO (vehicle) or STO-609S (30 μM/kg) once per day for 4 weeks. Following the treatment period, mice were sacrificed and livers were isolated for downstream phenotypic and molecular analyses. (D) Representative macroscopic and histological analyses (H&E and Oil Red O staining) of STZ + HFD treated C57BL/6 J mice following a 4-week regimen of either DMSO (vehicle) or STO-609S (30 μM/kg) treatment. (E) Targeted metabolomics were run on livers isolated from mice on either HFD alone or STZ + HFD models following the 4-week treatment with DMSO (vehicle) or STO-609S (30 μM/kg). The resulting metabolomics data were used to generate gene association networks, which were subjected to KEGG pathway analysis. Both unique and overlapping KEGG pathways from HFD alone or STZ + HFD models are represented in Venn diagram format. (F) Shared KEGG gene ontology pathways between HFD alone and STZ + HFD models from (E) graphed as the –log (p value). (G) Heatmap representation of metabolites from shared ontological categories in HFD alone mice treated with DMSO (vehicle) or STO-609S (30 μM/kg). (H) Quantitative metabolites representing glycolytic, TCA, pentose phosphate (PP) pathway, glycogen metabolism (GM), amino acid, acyl-CoAs and acyl-carnitines from HFD alone or STZ + HFD models. Metabolite levels for the DMSO treated groups were set to 1 and STO-609S treated groups are shown relative to DMSO. Data are graphed as the mean ± s.e.m. For HFD alone: *P < 0.05; **P < 0.01; ***P < 0.001. For STZ + HFD: #P < 0.05; #P < 0.01. N.S. = not significant. Components of Fig. 5 were drawn using ChemBioDraw.

Similar articles

Cited by

References

    1. Means AR, Dedman JR. Calmodulin–an intracellular calcium receptor. Nature. 1980;285:73–77. doi: 10.1038/285073a0. - DOI - PubMed
    1. Carafoli, E. A. K., C. B. Calcium as a cellular regulator. Vol. xiii 642 (Oxford University Press, 1999).
    1. Heitman J, Movva NR, Hiestand PC, Hall MN. FK 506-binding protein proline rotamase is a target for the immunosuppressive agent FK 506 in Saccharomyces cerevisiae. Proc Natl Acad Sci USA. 1991;88:1948–1952. doi: 10.1073/pnas.88.5.1948. - DOI - PMC - PubMed
    1. Aramburu J, Rao A, Klee CB. Calcineurin: from structure to function. Current topics in cellular regulation. 2000;36:237–295. doi: 10.1016/S0070-2137(01)80011-X. - DOI - PubMed
    1. Marcelo KL, Means AR, York B. The Ca(2+)/Calmodulin/CaMKK2 Axis: Nature’s Metabolic CaMshaft. Trends in endocrinology and metabolism: TEM. 2016;27:706–718. doi: 10.1016/j.tem.2016.06.001. - DOI - PMC - PubMed

Publication types

MeSH terms