. 2018 Mar;32(3):645-653.
doi: 10.1038/leu.2017.291. Epub 2017 Sep 19.

Clinical impact of the subclonal architecture and mutational complexity in chronic lymphocytic leukemia

Affiliations

Clinical impact of the subclonal architecture and mutational complexity in chronic lymphocytic leukemia

F Nadeu et al. Leukemia. 2018 Mar.

Abstract

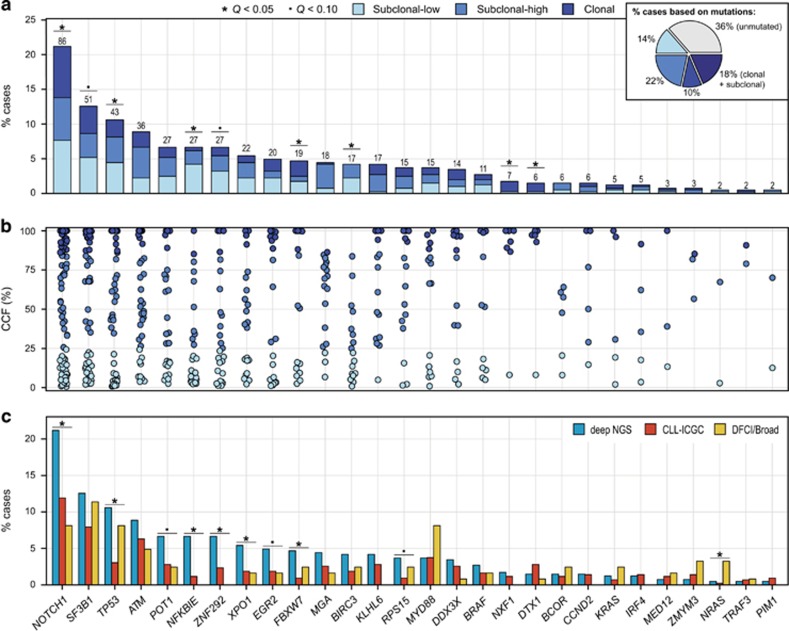
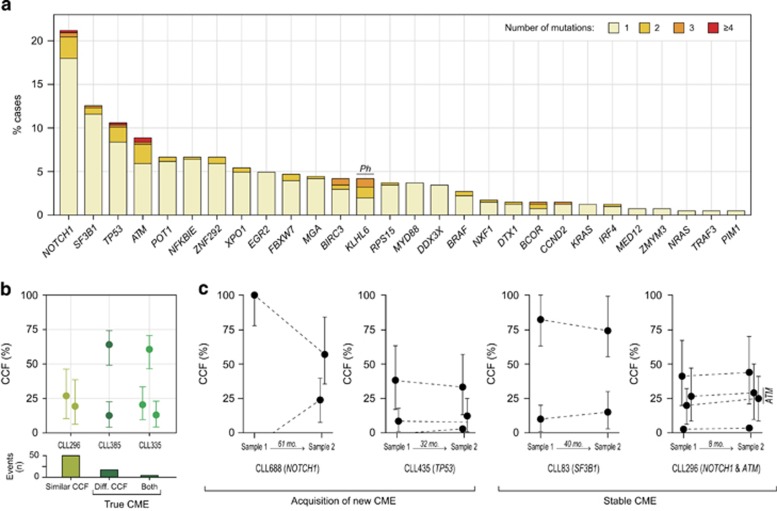
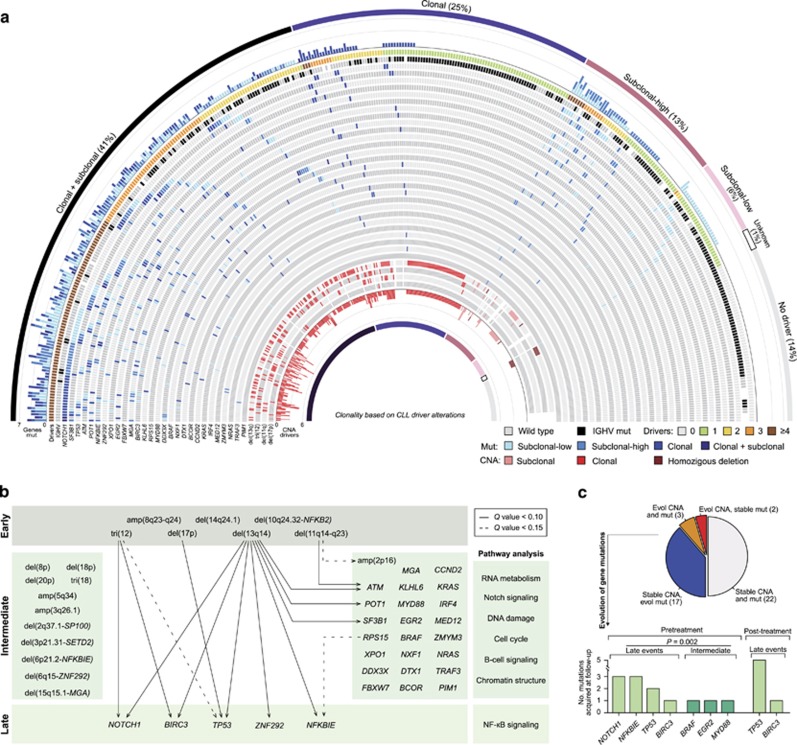
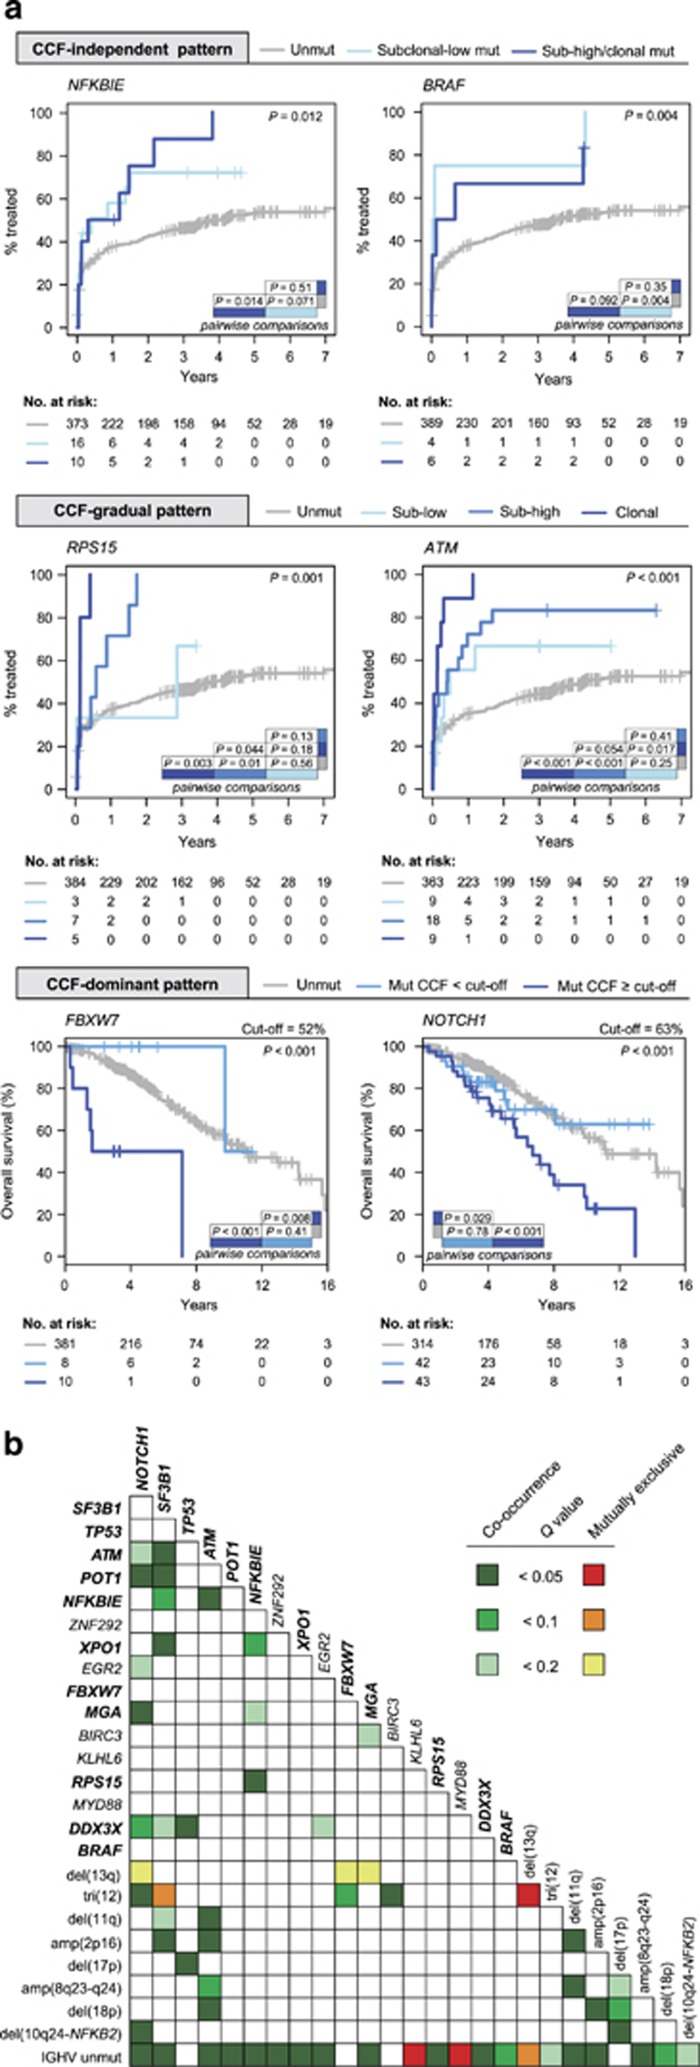
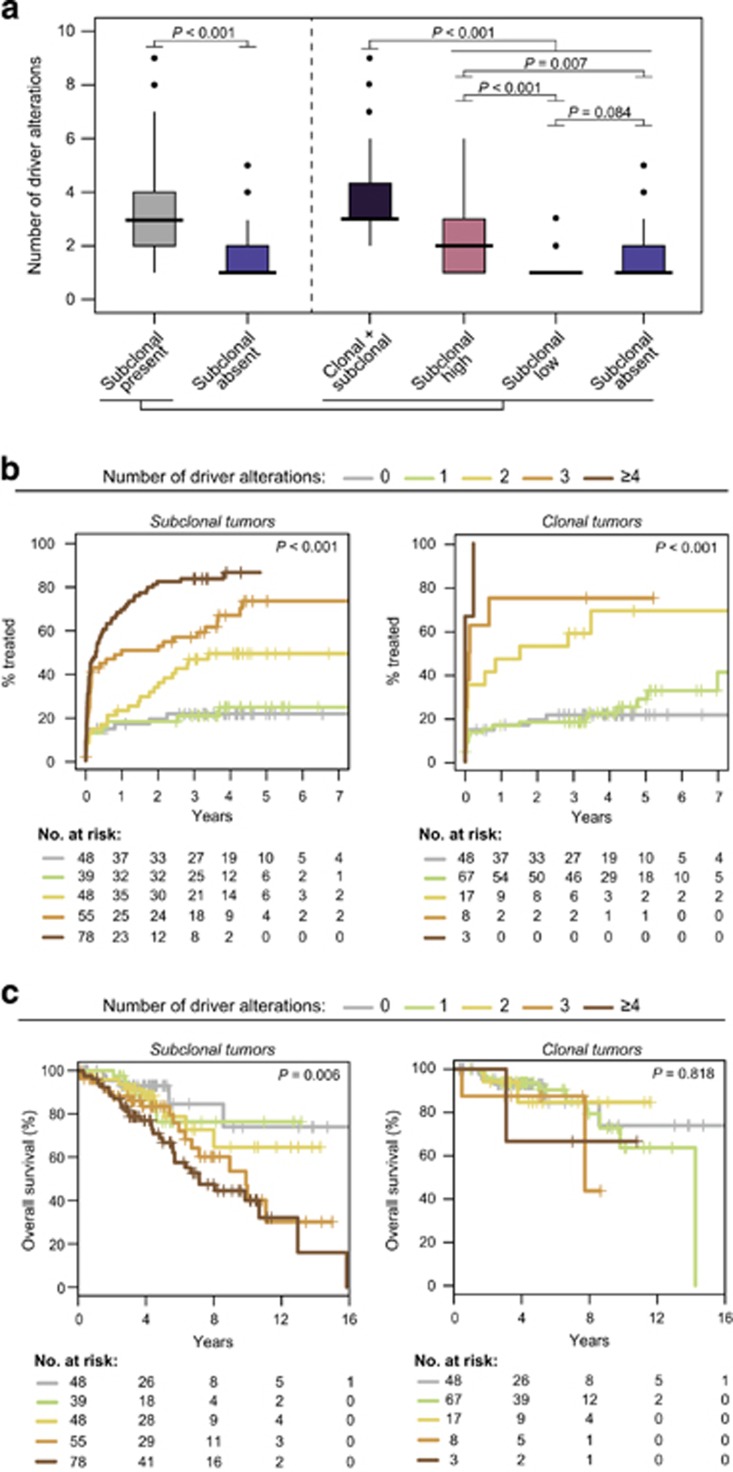
Genome studies of chronic lymphocytic leukemia (CLL) have revealed the remarkable subclonal heterogeneity of the tumors, but the clinical implications of this phenomenon are not well known. We assessed the mutational status of 28 CLL driver genes by deep-targeted next-generation sequencing and copy number alterations (CNA) in 406 previously untreated patients and 48 sequential samples. We detected small subclonal mutations (0.6-25% of cells) in nearly all genes (26/28), and they were the sole alteration in 22% of the mutated cases. CNA tended to be acquired early in the evolution of the disease and remained stable, whereas the mutational heterogeneity increased in a subset of tumors. The prognostic impact of different genes was related to the size of the mutated clone. Combining mutations and CNA, we observed that the accumulation of driver alterations (mutational complexity) gradually shortened the time to first treatment independently of the clonal architecture, IGHV status and Binet stage. Conversely, the overall survival was associated with the increasing subclonal diversity of the tumors but it was related to the age of patients, IGHV and TP53 status of the tumors. In conclusion, our study reveals that both the mutational complexity and subclonal diversity influence the evolution of CLL.


Conflict of interest statement

The authors declare no conflict of interest.

Figures

Figure 1
Figure 1
Deep characterization of the mutational architecture of 28 CLL driver genes. (a) Pie chart of the proportion of cases grouped according to their mutational clonality in the entire cohort of 406 patients (top-right corner). Percentage of cases carrying subclonal-low, subclonal-high and clonal mutations in each gene. Only the mutation present at a higher CCF is represented in patients with multiple mutations affecting the same gene. Genes with a Q-value <0.1 in the Kolmogorov–Smirnov test applied to test for uniform distribution of the mutated CCFs are indicated. (b) Distribution of the CCF where each dot corresponds to the mutation of one patient. (c) Comparison of the mutational frequency of each gene identified in this study (deep NGS, blue) with the previously published data from the CLL-ICGC project (only CLL cases considered (n=428), orange), and DFCI/Broad series (only 123 pretreatment cases considered, yellow). Genes in which the mutational frequency observed in the different studies statistically differs are indicated.
Figure 2
Figure 2
Convergent mutational evolution (CME) in CLL driver genes. (a) Bar plots of the percentage of mutated cases carrying one or more mutations in each gene. The Ph on the KLHL6 bar denotes that multiple mutations in this gene are mainly identified in the same allele (that is, phased events). (b) Graphical representation of ATM (CLL296) and BCOR (CLL385 and CLL335) mutations identified in three different patients. The CCF of each mutation is represented as a dot and the intervals show the sequencing variability. Histogram (bottom) shows the number of CME events with mutations at similar CCFs, different CCFs or both. (c) Patterns of CME in the longitudinal analysis. Representation of two cases in which mutations conferring CME for NOTCH1 and TP53, respectively, are acquired at different time points (left), and two cases with stable CME (that is, similar CCF of the mutations in the two samples analyzed) for SF3B1, and NOTCH1 and ATM, respectively (right).
Figure 3
Figure 3
CLL architecture and temporal acquisition of driver alterations. (a) Graphical representation of the mutational and CNA status of the 406 untreated CLL cases studied. Cases are sorted based of their clonality as shown by the outer and innermost layers. The outer bar plot represents the number of genes mutated with clonal and subclonal, only clonal, subclonal-high and subclonal-low mutations for each case. The following inner layer represents the total number of driver alterations per case and the IGHV mutations. In the innermost layers, the basic genetic alterations and the total number of driver CNA are shown. (b) Representation of CLL driver alterations according to their classification as early, late or intermediate events. Temporal relationships between specific pairs of alterations are represented by arrows. (c) Evolutionary patterns observed in the longitudinal analysis regarding the driver CNA and gene mutations. Evol, evolution; mut, mutations (top). Mutations acquired during the course of the disease before or after treatment (bottom). The P-value of the Wilcox test applied to compare the number of mutations acquired in genes predicted as late events vs intermediate is shown.
Figure 4
Figure 4
CCF-based patterns with prognostic impact. (a) Time to first treatment (TTFT) or overall survival (OS) curves of some representative mutated genes that follow a CCF-independent (top), CCF-gradual (middle) or CCF-dominant pattern (bottom) with impact on the outcome of the patients. The cutoff obtained by maxstat is shown on the top of the curves included in the CCF-dominant pattern. P-values for all pairwise comparisons are shown inside the plot areas. P, P-values by Gray’s test (TTFT) or log-rank test (OS). (b) Heat map of the co-occurrence of the driver alterations identified in ⩾10 cases and IGHV mutational status by representing the adjusted P-value (Q-value) of the Fisher’s exact test. Mutated genes with clinical impact in the univariate analysis are depicted in bold.
Figure 5
Figure 5
Role of the subclonal architecture and mutational complexity in CLL evolution. (a) Boxplots of the number of driver alterations in patients with or without a subclonal driver alteration (left). Boxplots dividing the group of patients with a subclonal driver present in three groups regarding their clonality: cases with clonal and subclonal, subclonal-high and only subclonal-low alterations (right). (b) Comparison of TTFT between patients carrying 0, 1, 2, 3 or ⩾4 driver alterations in the subgroup of patients with subclonal (left) or clonal tumors (right). (c) Survival curves according to the number of driver alterations in the subgroup of patients carrying subclonal (left) or clonal tumors (right).

References

    1. Puente XS, Pinyol M, Quesada V, Conde L, Ordóñez GR, Villamor N et al. Whole-genome sequencing identifies recurrent mutations in chronic lymphocytic leukaemia. Nature 2011; 475: 101–105. - PMC - PubMed
    1. Quesada V, Conde L, Villamor N, Ordóñez GR, Jares P, Bassaganyas L et al. Exome sequencing identifies recurrent mutations of the splicing factor SF3B1 gene in chronic lymphocytic leukemia. Nat Genet 2011; 44: 47–52. - PubMed
    1. Wang L, Lawrence MS, Wan Y, Stojanov P, Sougnez C, Stevenson K et al. SF3B1 and other novel cancer genes in chronic lymphocytic leukemia. N Engl J Med 2011; 365: 2497–2506. - PMC - PubMed
    1. Landau DA, Carter SL, Stojanov P, McKenna A, Stevenson K, Lawrence MS et al. Evolution and impact of subclonal mutations in chronic lymphocytic leukemia. Cell 2013; 152: 714–726. - PMC - PubMed
    1. Puente XS, Beà S, Valdés-Mas R, Villamor N, Gutiérrez-Abril J, Martín-Subero JI et al. Non-coding recurrent mutations in chronic lymphocytic leukaemia. Nature 2015; 526: 519–524. - PubMed

Publication types

MeSH terms

Substances