. 2017 Sep 18;7(1):11795.
doi: 10.1038/s41598-017-12102-2.

Refinement of ectopic protein expression through the GAL4/UAS system in Bombyx mori: application to behavioral and developmental studies

Affiliations

Refinement of ectopic protein expression through the GAL4/UAS system in Bombyx mori: application to behavioral and developmental studies

Chiho Hara et al. Sci Rep. .

Abstract

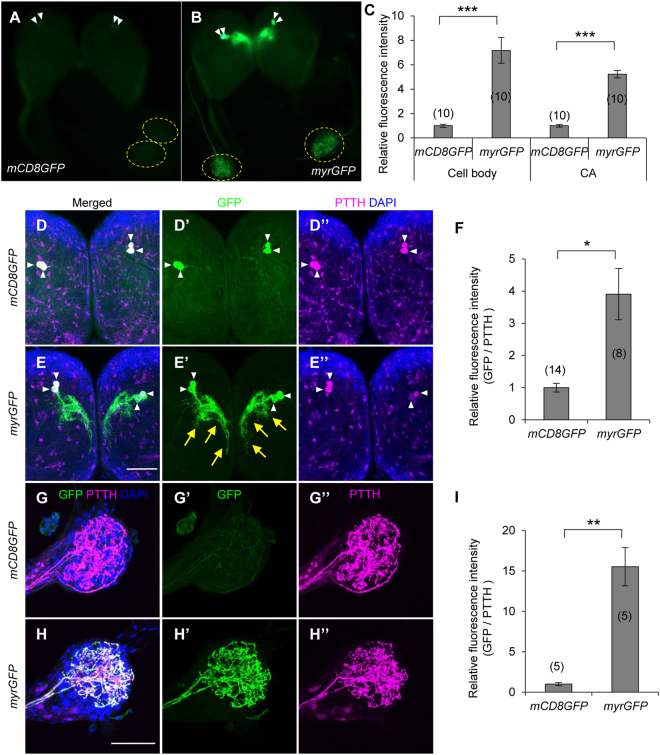
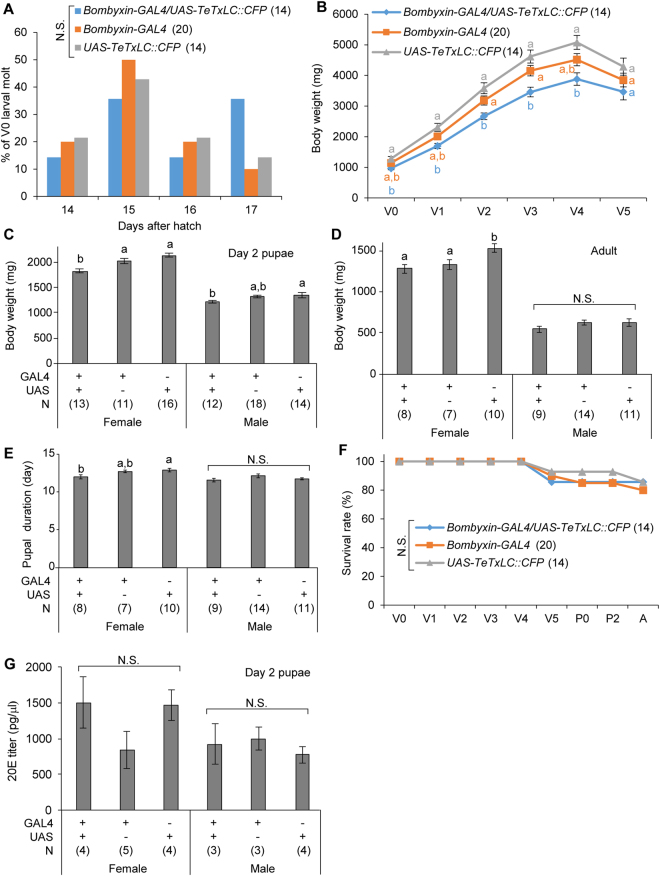
Silkmoth, Bombyx mori, is one of the important model insects in which transgenic techniques and the GAL4/UAS system are applicable. However, due to cytotoxicity and low transactivation activity of GAL4, effectiveness of the GAL4/UAS system and its application in B. mori are still limited. In the present study, we refined the previously reported UAS vector by exploiting transcriptional and translational enhancers, and achieved 200-fold enhancement of reporter GFP fluorescence in the GAL4/UAS system. Enhanced protein expression of membrane-targeted GFP and calcium indicator protein (GCaMP5G) drastically improved visualization of fine neurite structures and neural activity, respectively. Also, with the refined system, we generated a transgenic strain that expresses tetanus toxin light chain (TeTxLC), which blocks synaptic transmission, under the control of GAL4. Ectopic TeTxLC expression in the sex pheromone receptor neurons inhibited male courtship behavior, proving effectiveness of TeTxLC on loss-of-function analyses of neural circuits. In addition, suppression of prothoracicotropic hormone (PTTH) or insulin-like peptide (bombyxin) secretion impaired developmental timing and growth rate, respectively. Furthermore, we revealed that larval growth is sex-differentially regulated by these peptide hormones. The present study provides important technical underpinnings of transgenic approaches in silkmoths and insights into mechanisms of postembryonic development in insects.


Conflict of interest statement

The authors declare that they have no competing interests.

Figures

Figure 1
Figure 1
Enhancement of protein expression by refinement of UAS vector. (A) Structure of UAS vectors used for GFP expression in the present study. Upper panel indicates conventional UAS vector used to generate UAS-mCD8GFP strain previously. Lower panel indicates improved vector for UAS-myrGFP strain, which has increased copies of the GAL4 binding sites (20xUAS), an intervening sequence derived from myosin heavy chain gene of Drosophila melanogaster (IVS), synthetic translational enhancer (Syn21), and 3′UTR of AcNPV p10 gene (p10T). mCD8 (mouse CD8) and myr (N-myristoylation) sequences are membrane targeting signals. (B) Relative expression levels of GFP mRNA in the male antennae determined by qRT-PCR. UAS-mCD8GFP and UAS-myrGFP strains were crossed to BmOR1-GAL4 driver, which expresses GAL4 in the major sex pheromone receptor (BmOR1)-expressing cells. (C) Bright field and fluorescent images of dissected male brains under an epifluorescent microscope. Bright GFP signal was observed in the antennal nerves and antennal lobes of the myrGFP-expressed moth, whereas GFP fluorescence was barely observed in those of the mCD8GFP-expressed moth. (D) Quantification of GFP fluorescence intensities in the antennal lobes. (E) Confocal images of immunostained antennal lobes. Images of upper panels were taken with the same laser power. GFP signal could be observed with a higher laser power in the mCD8GFP-expressed sample (lower panel). (F) Relative fluorescent intensities of GFP in toroid, where BmOR1-expressing cells input. (G) Western blot analyses of GFP and α-tubulin of the brains (BR) and antennae (AN). Expected sizes of mCD8GFP and myrGFP are 51 and 36 kDa, respectively. Under the same exposure time, signal was detected only in the myrGFP-expressed samples. *P < 0.0001, **P < 0.00001, t-test. Number of samples are indicated in the parentheses. Bars, 500 μm (C) and 100 μm (E).
Figure 2
Figure 2
Improved visualization of projection pattern of PTTH neurons. (A,B) Fluorescent images of wandering larval brains under an epifluorescent microscope. mCD8GFP (A) or myrGFP (B) were expressed by PTTH-GAL4 strain. White arrowheads and yellow dotted circles indicate cell bodies and corpora allata (CA), respectively. (C) Quantification of GFP fluorescence intensities in the cell bodies and CA. (D,E,G,H) Confocal images of immunostained brains (D,E) and CA (G,H). White arrowheads and yellow arrows indicate cell bodies and neurites, respectively. Magenta signals outside PTTH neurons are background DsRed expression driven by selection marker (3xP3-DsRed). (F,I) Relative fluorescence intensities of GFP in the cell bodies (F) and CA (I). *P < 0.01, **P < 0.005, ***P < 0.0002, t-test. Bars, 500 μm (A) and 100 μm (E,H). Number of samples are indicated in the parentheses.
Figure 3
Figure 3
Improved GFP expression in bombyxin neurons. (A,B) Fluorescent images of final instar larval brains under an epifluorescent microscope. mCD8GFP (A) or myrGFP (B) were driven by bombyxin-GAL4. White arrowheads and yellow dotted circles indicate cell body clusters and CA, respectively. (C) Quantification of GFP fluorescence intensities in the cell bodies and CA. (D,E,G,H) Confocal images of immunostained brains (D,E) and CA (G,H). White arrowheads and yellow arrows indicate cell bodies and neurites, respectively. Only two to three cells are visible, since pictures of one optical section of confocal observation are shown (D,E). (F,I) Relative fluorescence intensities of GFP in the cell bodies (F) and CA (I). *P < 0.002, **P < 0.0001, t-test. Bars, 500 μm (A) and 100 μm (E,H). Number of samples are indicated in the parentheses.
Figure 4
Figure 4
Visualization of neural activity by enhanced GCaMP5G expression. (A) Confocal image of the immunostained antennal lobe of male moth (BmOR1 > GCaMP5G). (B) Time course of GCaMP fluorescence change in response to 10 μg bombykol stimulation. (C) Normalized dose-response relationship between fluorescence change and amount of bombykol used for stimulation. Bar, 100 μm. N = 10.
Figure 5
Figure 5
Blockade of neural transmission in BmOR1-expressing cells by TeTxLC. (A) RT-PCR analysis of TeTxLC expression in the male antennae. RT, reverse transcription. No genomic contamination was confirmed by RT- experiments. (B) Expression level of TeTxLC was significantly higher than that of endogenous sex pheromone receptor (BmOR1) revealed by qRT-PCR. *P < 0.05, U-test. (C) Confocal image of immunostained antennal lobe. TeTxLC expression did not disturb proper axon targeting. Bar, 100 μm. (D) Dose-response relationship of courtship duration and amount of bombykol used for stimulation. Wing-flapping time during 10 min observation period was measured. *P < 0.05, **P < 0.01, ***P < 0.005, Tukey-Kramer’s HSD test after ANOVA. (E) Cumulative copulation rate against observation time. ***P < 0.0001, log-rank test. (F) Still images of behavior movies. Number of samples are indicated in the parentheses.
Figure 6
Figure 6
Blockade of PTTH neural transmission delays developmental timing. (A) Timing of V0 larval molting. *P < 0.00005, Chi-square test. (B) Developmental change in larval body weights. W indicates the day when majority of the larvae started wandering. (C) Confocal image of immunostaining in CA. (D,E) Body weights in day 2 pupae (D) and adult moths (E). (F) Pupal duration. (G) Survival rate during larva-to-pupa development. (HJ) 20E titer determined by ELISA in female larvae (H), male larvae (I), and pupae (J). Statistically different groups are shown in different characters (P < 0.05, Tukey-Kramer’s HSD test after ANOVA). N.S., not significant (P > 0.05). Bar, 100 μm. Number of samples are indicated in the parentheses.
Figure 7
Figure 7
Blockade of bombyxin neural transmission decreases larval growth rate. (A) Timing of V0 larval molting. (B) Developmental change in larval body weights. (C,D) Body weights of day 2 pupae (C) and adult moths (D). (E) Pupal duration. (F) Survival rate during larva-to-pupa development. (G) 20E titer in day 2 pupae. Statistically different groups are shown in different characters (P < 0.05, Tukey-Kramer’s HSD test after ANOVA). N.S., not significant (P > 0.05). Number of samples are indicated in the parentheses.
Figure 8
Figure 8
Sex differential actions of PTTH and bombyxin signaling on larval development. (A,B) Developmental change of body weights in females (A) and males (B). (C,D) Survival rate during larva-to-pupa development in females (C) and males (D). (E,F) Timing of wandering (E) and pupation (F) onset. Days from start of fifth instar is shown. Statistically different groups are shown in different characters (P < 0.05, Tukey-Kramer’s HSD test after ANOVA). N.S., not significant (P > 0.05). Number of samples are indicated in the parentheses. (G) A model of sexually different regulation of body weight and developmental timing by PTTH and bombyxin in larvae.

Similar articles

Cited by

References

    1. Brand AH, Perrimon N. Targeted gene expression as a means of altering cell fates and generating dominant phenotypes. Development (Cambridge, England) 1993;118:401–415. - PubMed
    1. Lee T, Luo L. Mosaic analysis with a repressible cell marker for studies of gene function in neuronal morphogenesis. Neuron. 1999;22:451–461. doi: 10.1016/S0896-6273(00)80701-1. - DOI - PubMed
    1. Tamura T, et al. Germline transformation of the silkworm Bombyx mori L. using a piggyBac transposon-derived vector. Nature biotechnology. 2000;18:81–84. doi: 10.1038/71978. - DOI - PubMed
    1. Imamura M, et al. Targeted gene expression using the GAL4/UAS system in the silkworm Bombyx mori. Genetics. 2003;165:1329–1340. - PMC - PubMed
    1. Sakurai T, et al. A single sex pheromone receptor determines chemical response specificity of sexual behavior in the silkmoth Bombyx mori. PLoS genetics. 2011;7:e1002115. doi: 10.1371/journal.pgen.1002115. - DOI - PMC - PubMed

Publication types

LinkOut - more resources