. 2017 Jul;4(3):036001.
doi: 10.1117/1.JMI.4.3.036001. Epub 2017 Sep 13.

Ex vivo tissue imaging for radiology-pathology correlation: a pilot study with a small bore 7-T MRI in a rare pigmented ganglioglioma exhibiting complex MR signal characteristics associated with melanin and hemosiderin

Affiliations

Ex vivo tissue imaging for radiology-pathology correlation: a pilot study with a small bore 7-T MRI in a rare pigmented ganglioglioma exhibiting complex MR signal characteristics associated with melanin and hemosiderin

Kant M Matsuda et al. J Med Imaging (Bellingham). 2017 Jul.

Abstract

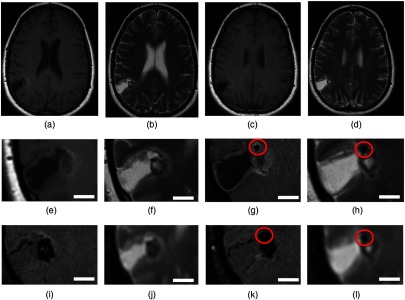
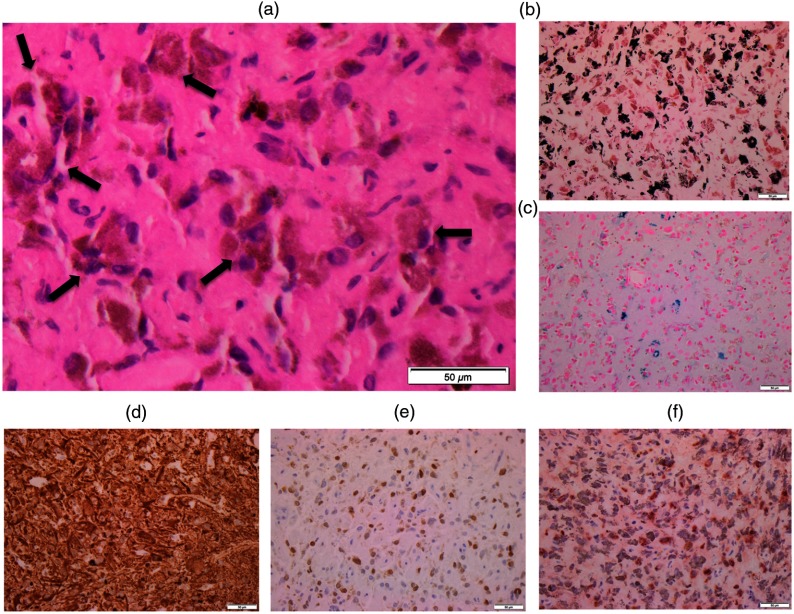
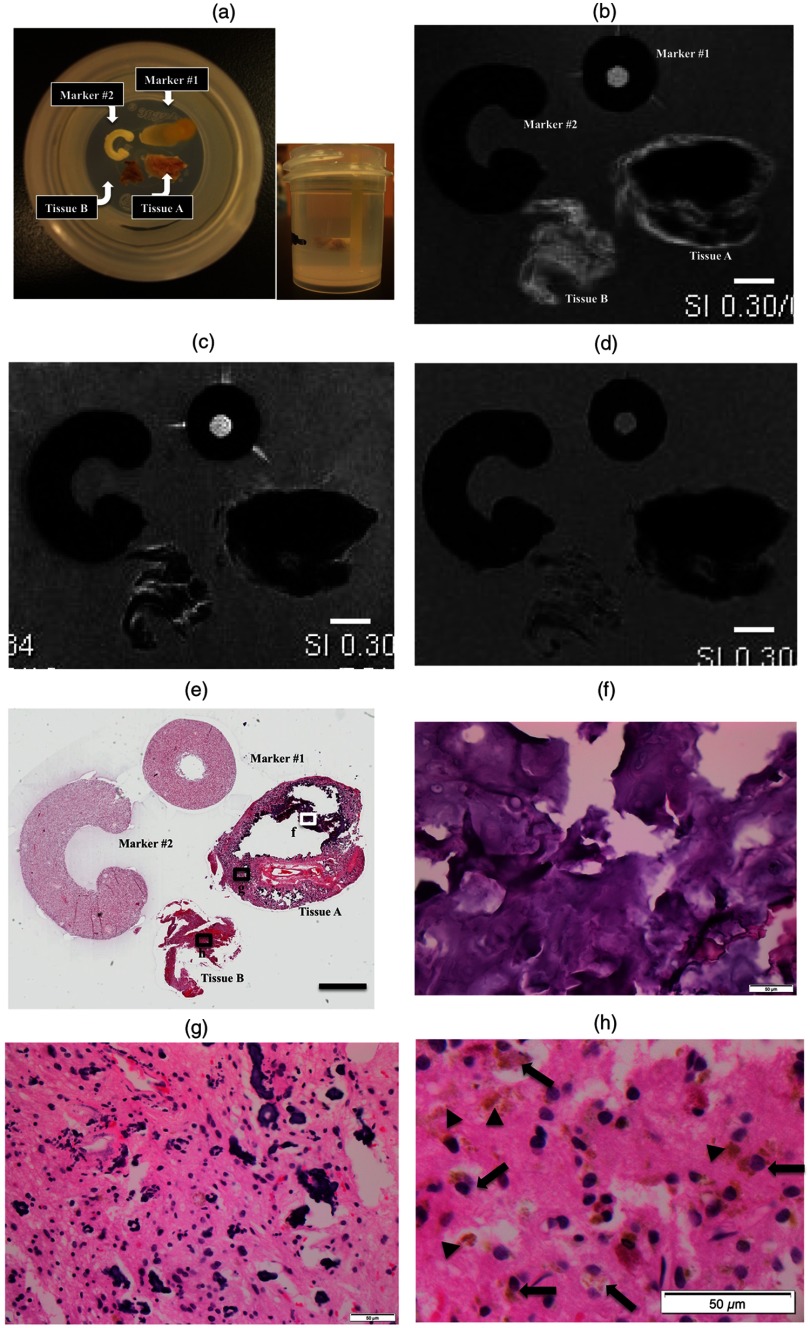
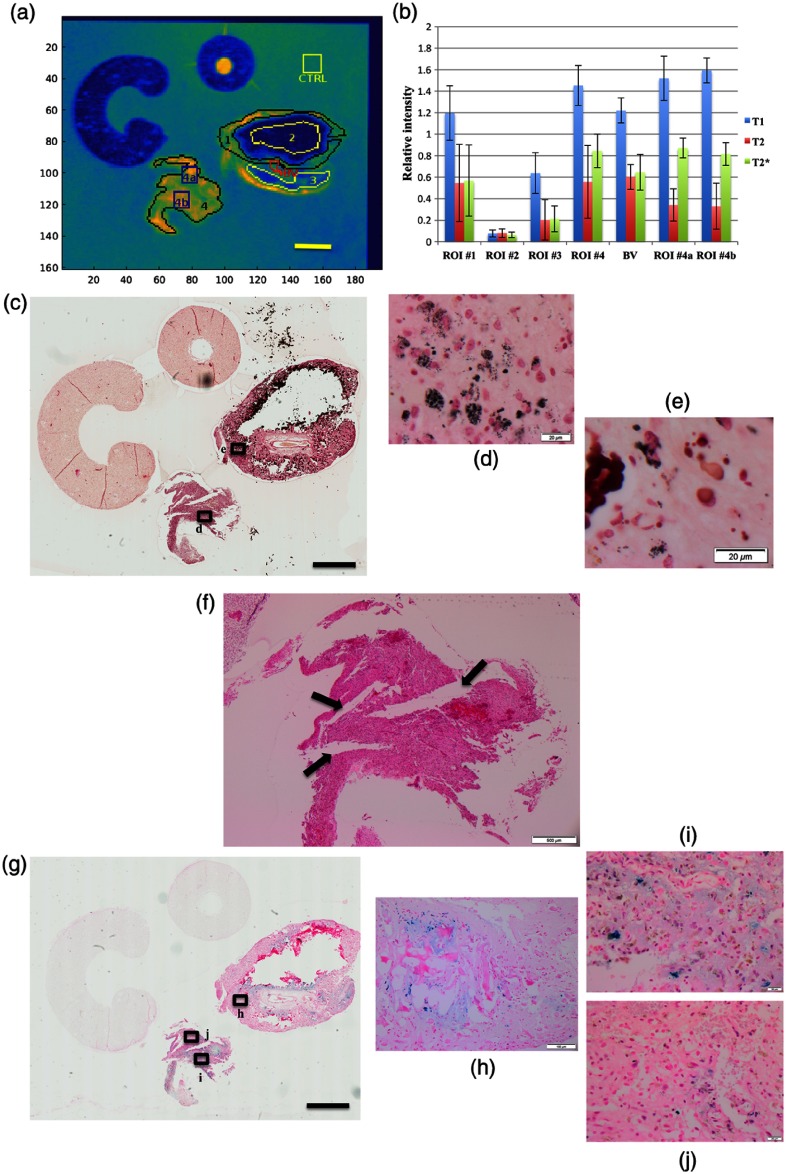
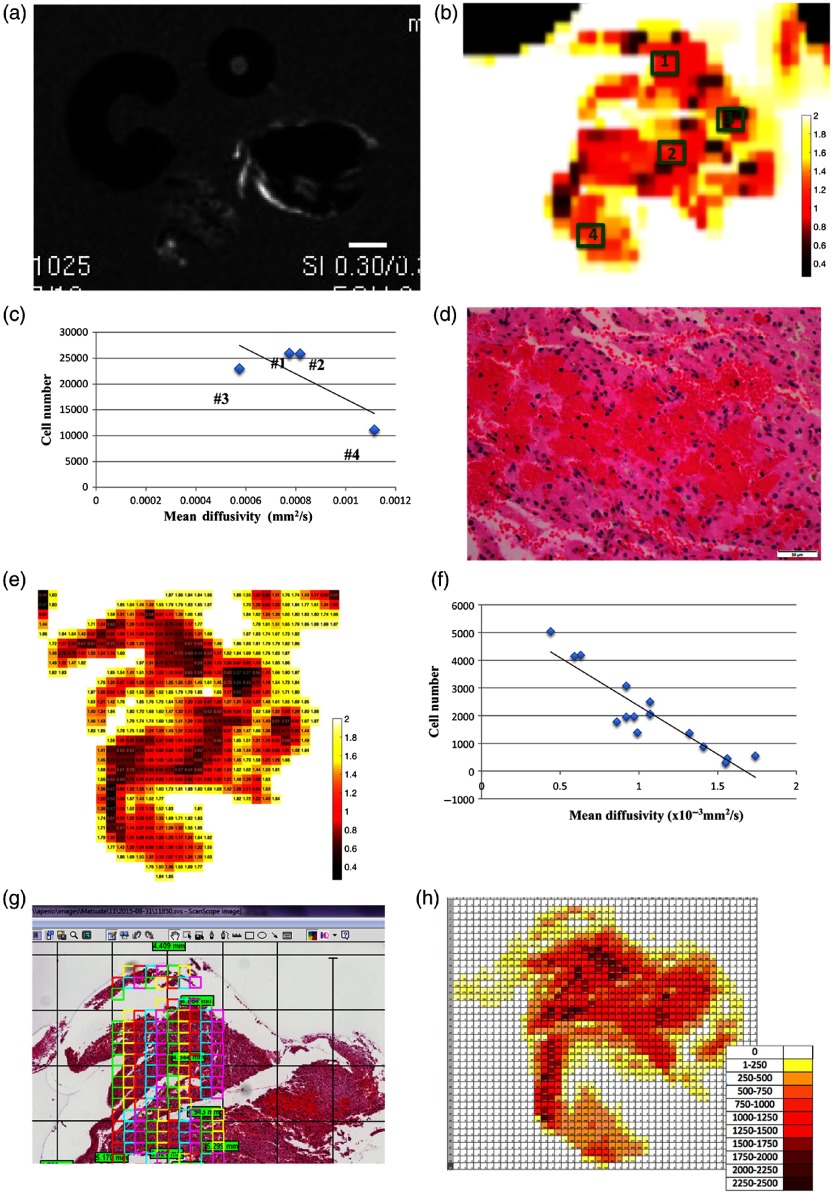
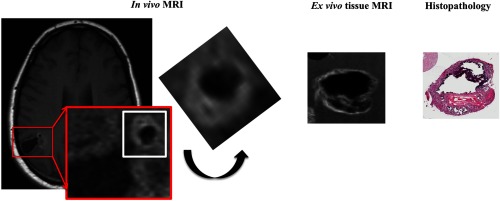
To advance magnetic resonance imaging (MRI) technologies further for in vivo tissue characterization with histopathologic validation, we investigated the feasibility of ex vivo tissue imaging of a surgically removed human brain tumor as a comprehensive approach for radiology-pathology correlation in histoanatomically identical fashion in a rare case of pigmented ganglioglioma with complex paramagnetic properties. Pieces of surgically removed ganglioglioma, containing melanin and hemosiderin pigments, were imaged with a small bore 7-T MRI scanner to obtain T1-, T2-, and T2*-weighted image and diffusion tensor imaging (DTI). Corresponding histopathological slides were prepared for routine hematoxylin and eosin stain and special stains for melanin and iron/hemosiderin to correlate with MRI signal characteristics. Furthermore, mean diffusivity (MD) maps were generated from DTI data and correlated with cellularity using image analysis. While the presence of melanin was difficult to interpret in in vivo MRI with certainty due to concomitant hemosiderin pigments and calcium depositions, ex vivo tissue imaging clearly demonstrated pieces of tissue exhibiting the characteristic MR signal pattern for melanin with pathologic confirmation in a histoanatomically identical location. There was also concordant correlation between MD and cellularity. Although it is still in an initial phase of development, ex vivo tissue imaging is a promising approach, which offers radiology-pathology correlation in a straightforward and comprehensive manner.

Keywords: ex vivo tissue imaging; melanin-associated magnetic resonance imaging signal; pigmented ganglioglioma; radiology–pathology correlation; small bore 7-T magnetic resonance imaging.


Figures

Fig. 1
Fig. 1
In vivo MRI findings. Representative images from two adjacent slices with the lesion on (a and c) T1-weighted image and (b and d) T2-weighted image in the upper panels. The magnified views of the lesion with each MRI sequence are shown in the lower panels: (e and g) T1-weighted image without contrast enhancement, (f and h) T2-weighted image, (i and k) SWI, and (j and l) ADC. The scale bar indicates 10 mm in actual length. (g, h, k, and l) A nodule with MRI signals characteristic for heavily calcification is indicated in red circles.
Fig. 2
Fig. 2
Histopathologic findings. (a) H&E stain with an enlarged image. Note many neoplastic cells with abundant brown pigments (allows). Special stains highlight melanin pigments in black (b) on MELN, and iron/hemosiderin pigments in blue (c) on PPB. IHC for (d) GFAP, (e) Neu-N, and (f) tyrosinase. At 400× magnification, the scale bar indicates 50  μm in actual length.
Fig. 3
Fig. 3
Ex vivo tissue imaging with histopathologic correlation. (a) Photographs of the specimen with markers in agarose gel. Representative slice (slice #7) from ex vivo tissue imaging with different MRI sequences: (b) T1-, (c) T2-, and (d) T2*-weighted images. The scale bar indicates 2 mm in actual length. (e) Corresponding histopathology: digital pathology with low-power view at 10× magnification. The areas from the tissue A (f) with dense calcification and (g) with admixed calcification and cellular component. (h) The tissue B with pigmented neoplastic cells without calcification with an enlarged image. At 400× magnification, the scale bar indicates 50  μm in actual length. The corresponding areas are highlighted in (e) with annotations: white rectangle with letter “f” for (f), black rectangles with “g” for (g) and “h” for (h). Note neoplastic cells with brown pigments (arrows) and pigmented depositions (arrowheads) in the tissue B (h).
Fig. 4
Fig. 4
Image analysis for T1-/T2-/T2*-intensities with histopathologic correlation. (a) ROIs on T1-weighted image in pseudocolor map to highlight contrast. ROI #1 indicates hyperintense rim in the tissue A. ROIs #2 and #3 indicate hypointense areas within the tissue A. ROI#4 represents the entire tissue B in its entirely. ROIs#4a and #4b indicate sub-ROIs within the tissue B. The scale bar indicates 2 mm in actual length. (b) Relative signal intensity in each ROI with T1-/T2-/T2*-intensities. (c) T1-intensity in blue bar, T2-intensity in orange bar, and T2*-intensity in green bar. Melanin stain (MELN) with low-power view at 10× magnification. The scale bar indicates 2 mm in actual length. Magnified images from (d) the ROI #4 and (e) the ROI #1. The corresponding areas are highlighted in (c) with annotations: black rectangles with letter “d” for (d) and “e” for (e). At 600× magnification, the scale bar indicates 20  μm in actual length. (f) The cleft-like formations (arrows) within the tissue B. At 40× magnification, the scale bar indicates 500  μm in actual length. (g) Iron stain (PPB) with low-power view at 10× magnification. The scale bar indicates 2 mm in actual length. (h) The area with iron/hemosiderin depositions associated with dense calcification; at 200× magnification, the scale bar indicates 100  μm in actual length. The ROI (i) #4b and (j) #4a with different amount of iron depositions. At 600× magnification, the scale bar indicates 20  μm in actual length. The corresponding areas are highlighted in (g) with annotations: black rectangles with letter “h” for (h), “i” for (i), and “j” for (j).
Fig. 5
Fig. 5
(a) MD map for correlation with cellularity. DWI in grayscale. (b) Pseudocolor-coded MD map from tissue B. The scale bar indicates 2 mm in actual length. Four ROIs with 500×500  μm are highlighted in green. (c) Correlation between cellularity and MD value in the ROIs #1 to 4. The estimated number of cells was calculated by the average from four different histology sections with different tissue levels, multiplied by the number of interval sections (35 sections). (d) Histopathology corresponding to the ROI #3 showed tight and dense clusters of RBCs. At 400× magnification, the scale bar indicates 50  μm in actual length. (e) The pseudocolor-coded MD map of tissue B after coregistration with histology. The MD values (mm2/s) were multiplied by 1000 times for demonstration purpose. (f) Correlation between the MD values from 15 selected pixels and cellularity from the corresponding ROIs with 200×200  μm. (g) Sequentially placed ROIs with 100×100  μm on the digital pathology slide. (h) Qualitative correlation between the MD map and the cellularity map generated from the smaller ROIs with 100×100  μm. The estimated number of cells was calculated as described previously.
Fig. 6
Fig. 6
Correlation among in vivo MRI-ex vivo MRI-histopathologic correlation targeting on the tissue A with heavy calcified nodular formation (rectangle in white). In the magnified view of the area with red rectangle, a nodule with MR signal characteristics for heavy calcification is demonstrated, which is most compatible with the tissue A in ex vivo MRI and histopathology. On in vivo MRI, the area highlighted in a white square is cropped and rotated in a position that provides a similar appearance with ex vivo MRI and histopathology. Correlation for the tissue B is difficult due to fragmented nature of the neurosurgical specimen, respectively.

Similar articles

Cited by

References

    1. Wu O., Dijkhuizen R. M., Sorensen A. G., “Multiparametric magnetic resonance imaging of brain disorders,” Top. Magn. Reson. Imaging 21, 129–138 (2010).10.1097/RMR.0b013e31821e56c2 - DOI - PMC - PubMed
    1. Matsuda K. M., et al. , “Microscopic resolution imaging and proteomics correlation at histogeographically identical location: point by point correlation between ex vivo tissue imaging with high field MRI and multiplex tissue immunoblotting for proteomics profiling,” Proc. SPIE 7626, 76262B (2010).10.1117/12.854966 - DOI
    1. D’Arceuil H. E., Westmoreland S., de Crespigny A. J., “An approach to high resolution diffusion tensor imaging in fixed primate brain,” NeuroImage 35, 553–565 (2007).NEIMEF10.1016/j.neuroimage.2006.12.028 - DOI - PubMed
    1. Yang L., et al. , “Ex-vivo characterization of bioimpedance spectroscopy of normal, ischemic and hemorrhagic rabbit brain tissue at frequencies from 10 Hz to 1 MHz,” Sensors (Basel) 16, 1942 (2016).SNSRES10.3390/s16111942 - DOI - PMC - PubMed
    1. Gimenez U., et al. , “Microscopic DTI accurately identifies early glioma cell migration: correlation with multimodal imaging in a new glioma stem cell model,” NMR Biomed. 29, 1553–1562 (2016).10.1002/nbm.3608 - DOI - PubMed