. 2017 Sep 13;3(9):e1700764.
doi: 10.1126/sciadv.1700764. eCollection 2017 Sep.

A versatile 3D tissue matrix scaffold system for tumor modeling and drug screening

Affiliations

A versatile 3D tissue matrix scaffold system for tumor modeling and drug screening

Girdhari Rijal et al. Sci Adv. .

Abstract

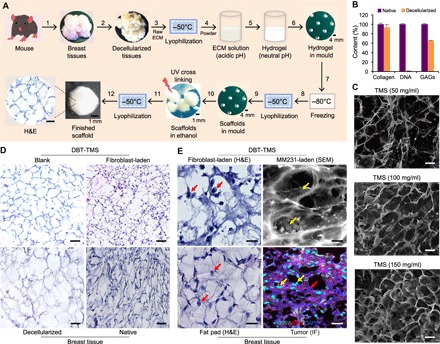
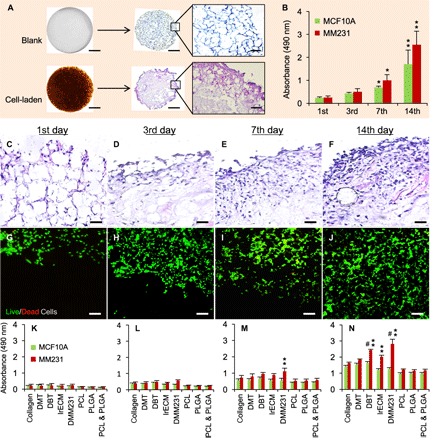
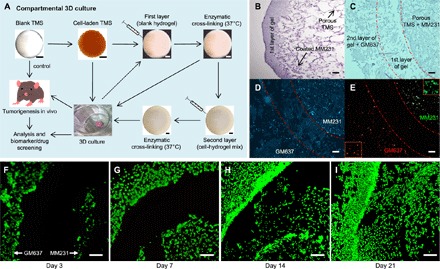
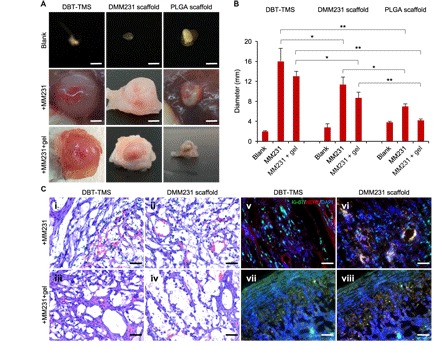
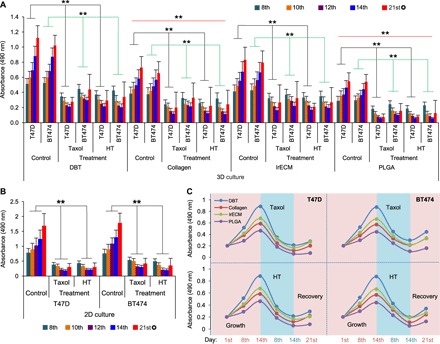
Most of the anticancer drug candidates entering preclinical trials fail to be approved for clinical applications. The following are among the main causes of these failures: studying molecular mechanisms of cancer development, identifying therapeutic targets, and testing drug candidates using inappropriate tissue culture models, which do not recapitulate the native microenvironment where the cancer cells originate. It has become clear that three-dimensional (3D) cell cultures are more biologically and clinically relevant than 2D models. The spatial and mechanical conditions of 3D cultures enable the cancer cells to display heterogeneous growth, assume diverse phenotypes, express distinct gene and protein products, and attain metastatic potential and resistance to drugs that are reminiscent of tumors in humans. However, the current 3D culture systems using synthetic polymers or selected components of the extracellular matrix (ECM) are defective (particularly the biophysical and biochemical properties of the native ECM) and remain distant to optimally support the signaling cue-oriented cell survival and growth. We introduce a reconstitutable tissue matrix scaffold (TMS) system fabricated using native tissue ECM, with tissue-like architecture and resilience. The structural and compositional properties of TMS favor robust cell survival, proliferation, migration, and invasion in culture and vascularized tumor formation in animals. The combination of porous and hydrogel TMS allows compartmental culture of cancerous and stromal cells, which are distinguishable by biomarkers. The response of the cancer cells grown on TMS to drugs well reflects animal and clinical observations. TMS enables more biologically relevant studies and is suitable for preclinical drug screening.


Figures

Fig. 1
Fig. 1. TMS fabrication and structural property characterization.
(A) The workflow of the porous TMS fabrication. (1) Collection of breast tissues from 8- to 12-week-old mice. (2) Decellularization of the native tissues to produce ECM. (3) Lyophilization of the ECM at −50°C. (4) Enzymatic digestion of the ground ECM in acidic solution. (5) Neutralization of the acidic ECM solution–generated hydrogel. (6) Loading the hydrogel into the spherical molds. (7) Formation of the pre-scaffolds in the molds at −80°C. (8) Lyophilization of the pre-scaffolds. (9) Formation of the porous scaffolds in the molds. (10) Treatment of the scaffolds with absolute ethanol and cross-linking the ECM proteins under UV light. (11) Lyophilization of the scaffolds to remove the ethanol. (12) Characterization of the finished TMS scaffolds. A microscopic view of the TMS cross sections after H&E staining is shown. Scale bars, 100 μm. (B) Comparison of the composition of the decellularized tissues with that of the native tissues at DNA and major ECM protein levels. Error bars represent the SD of the measurements of three independent batches of the ECM samples. (C) Characterization of the TMS porosity under SEM. Different amounts of the lyophilized ECM powder were used to generate TMSs at different pore sizes. (D) Histological comparison of the cross sections of the blank and the cell-laden DBT-TMS with the decellularized and the native mouse breast tissue. (E) Comparison of the occupancies of the cells grown inside the DBT-TMS with that of the native cells that lived in mouse breast tissues. Left: The closeup views of the H&E-stained cross sections of the fibroblast-laden TMS and the mammary fat pad tissues. Top right: An SEM image showing the occupancies of the MM231 cells on the surface and within the porous TMS. Bottom right: Distribution patterns of the MM231 cells and stromal cells immunostained with Ki-67 (green) and HER2 (red), respectively, on the cross sections of mouse breast tumors that originated from the MM231 cell–laden TMS. DAPI (4′,6-diamidino-2-phenylindole) was used to stain the nuclei of the cells. The red and the yellow arrows indicate stromal and MM231 cells, respectively. Scale bars, 100 μm (C to E).
Fig. 2
Fig. 2. Cell survival and proliferation in TMS.
(A) Macroscopic and microscopic views of the blank and cell-laden porous DBT-TMSs. Scale bars, 1 mm (for the macroscopic views and the microscopic views of the H&E-stained cross sections) and 200 μm (for the regional blowups of the H&E-stained cross sections). (B) Proliferation of MCF10A and MM231 cells grown on DBT-TMSs over a period of 14 days. Error bars represent the SD of the means of the values from three independent experiments. *P < 0.01; **P < 0.001, compared to the first-day culture. (C to F) The proliferation and distribution of the MM231 cells on the DBT-TMSs were examined on the cross sections of the scaffolds using H&E staining coupled with light microscopy. Scale bars, 100 μm. (G to J) Live/Dead Cell assays showing robust survival and proliferation of the MM231 cells on the DBT-TMSs over time. Scale bars, 100 μm. The images (C to J) are top (surface) to bottom (center) views of the cross sections of the scaffolds. (K to N) Comparison of MCF10A and MM231 cell proliferation profiles on different 3D scaffolds within the defined time frame. Error bars represent the SD of the means of three independent experiments. **P < 0.01, compared to the proliferation profiles on the PCL/PLGA scaffolds; #P < 0.05, compared to the proliferation profiles on the collagen scaffolds.
Fig. 3
Fig. 3. Compartmental 3D tissue culture using the TMS system.
(A) Generation of the multilayered/compartmentalized TMS culture system. MM231 cells were cultured on the porous DBT-TMS followed by either covering them with a layer of blank TMS hydrogel or directly placing them into culture for in vitro or in vivo experiments. Hydrogel premixed with another type of cells different from those coated on the porous TMS was applied outside the first layer and enzymatically cross-linked, forming a second gel layer. The multilayered TMS assembly was then subjected to culture and/or implantation into animals for further analysis or applications. (B) H&E staining of the cross sections of a TMS coated with MM231 cells and a layer of hydrogel. (C) H&E staining of the cross sections of a multilayered TMS containing the porous TMS core coated with MM231 cells and two hydrogel layers with the second gel layer containing the human GM637 fibroblasts. The middle region outlined by dotted lines was a blank hydrogel layer. (D) DAPI staining of the cross sections of the compartmentally cultured cells grown in the multilayered TMS after 3 days of culture, as shown in (C). (E) IF microscopic view of Ki-67 (green, MM231 cells) and HER2 (red, GM637 cells) staining on the cross sections of the compartmental TMS samples. Selected regional blowups of the Ki-67 and HER2 staining are shown as insets. (F to I) Live/Dead Cell staining of the cross sections of the compartmentally cultured MM231 cells (on the porous TMS, right side of the blank hydrogel layer) and the human GM637 fibroblasts (within the second hydrogel layer, left side of the blank hydrogel layer) at different time points of the cultures. Scale bars, 100 μm.
Fig. 4
Fig. 4. Characterization of TMS support of tumor formation in animals.
(A) Evaluation of the biodegradability of the scaffolds and their supports on the MM231 cell–originated tumor development (dissection microscopy images). Scale bars, 4 mm. (B) Quantification of the sizes of the tumors formed from the different MM231 cell–laden scaffolds. The plotted values reflect the ex vivo measurements of the tumors. The error bars represent the SD of the sizes of three individual tumors of the same implantation background. *P < 0.05; **P < 0.01, significance of the comparison between the indicated sample groups. (C) (i to iv) H&E staining of the cross sections of the tumors that originated from the MM231 cell–laden DBT-TMS and DMM231 scaffolds with or without hydrogel coverage. The tumor ECM structure, cell distribution, and capillaries (containing the stained red blood cells) are demonstrated. (v to viii) IF staining of Ki-67 (green) and HER2 (red) on the tumor cross sections. The cell nuclei were stained with DAPI (blue). Scale bars, 100 μm (C, i to viii).
Fig. 5
Fig. 5. Comparison of the sensitivities of the cancer cells grown on the different scaffolds to anticancer drugs.
(A) The impact of the anticancer drugs on cell growth and proliferation supported by the DBT-TMS, collagen, lrECM, and PLGA scaffolds was analyzed and compared. The drug administration pattern and cell proliferation measurements are detailed in Materials and Methods. The error bars represent the SD of three independent experiments. The black and green lines within the plot area indicate the comparison of the average T47D or BT474 cell proliferation (day 8 to day 14) between the drug-treated groups and the nontreated control groups. The red lines indicate the comparison of the average cell proliferation between the collagen or PLGA scaffold groups and the DBT-TMS groups. **P < 0.01; ✪ , posttreatment recovery measurement. (B) Evaluation of the cell proliferation in response to Taxol or HT treatment in 2D cultures. Error bars represent the SD of the means of three independent experiments. **P < 0.01, comparison of the average cell proliferation (day 8 to day 14) between the drug-treated groups and the nontreated control groups. ✪ , posttreatment recovery measurement. (C) Proliferation/inhibition curve plots. The means (from three independent experiments) of the cell proliferation status on the different scaffolds on day 1 (the start date of cell proliferation), day 8 (1 day after the first treatment), day 14 (1 day after the last treatment), and day 21 (the end of recovery) as shown in (A) were plotted.

Similar articles

Cited by

References

    1. Rijal G., Li W., 3D scaffolds in breast cancer research. Biomaterials 81, 135–156 (2016). - PubMed
    1. Debnath J., Brugge J. S., Modelling glandular epithelial cancers in three-dimensional cultures. Nat. Rev. Cancer 5, 675–688 (2005). - PubMed
    1. Vargo-Gogola T., Rosen J. M., Modelling breast cancer: One size does not fit all. Nat. Rev. Cancer 7, 659–672 (2007). - PubMed
    1. Hakanson M., Textor M., Charnley M., Engineered 3D environments to elucidate the effect of environmental parameters on drug response in cancer. Integr. Biol. 3, 31–38 (2011). - PubMed
    1. Deiss F., Mazzeo A., Hong E., Ingber D. E., Derda R., Whitesides G. M., Platform for high-throughput testing of the effect of soluble compounds on 3D cell cultures. Anal. Chem. 85, 8085–8094 (2013). - PMC - PubMed

Publication types