

Comparative studies of cellular viability levels on 2D and 3D in vitro culture matrices
- PMID: 28924965
- PMCID: PMC5809656
- DOI: 10.1007/s10616-017-0139-7
Comparative studies of cellular viability levels on 2D and 3D in vitro culture matrices
Abstract
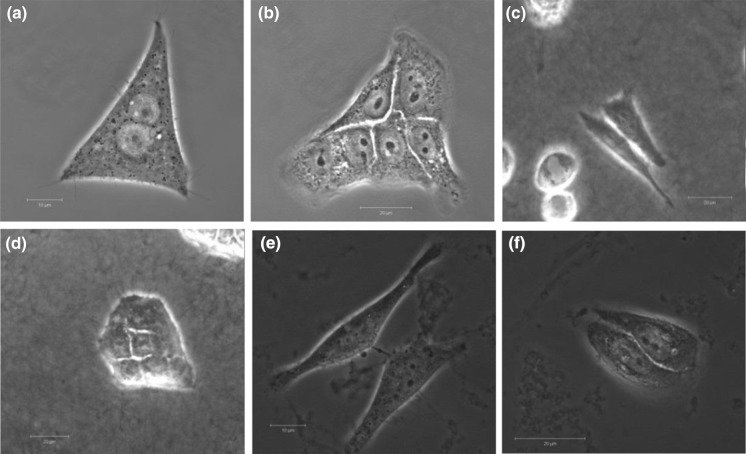
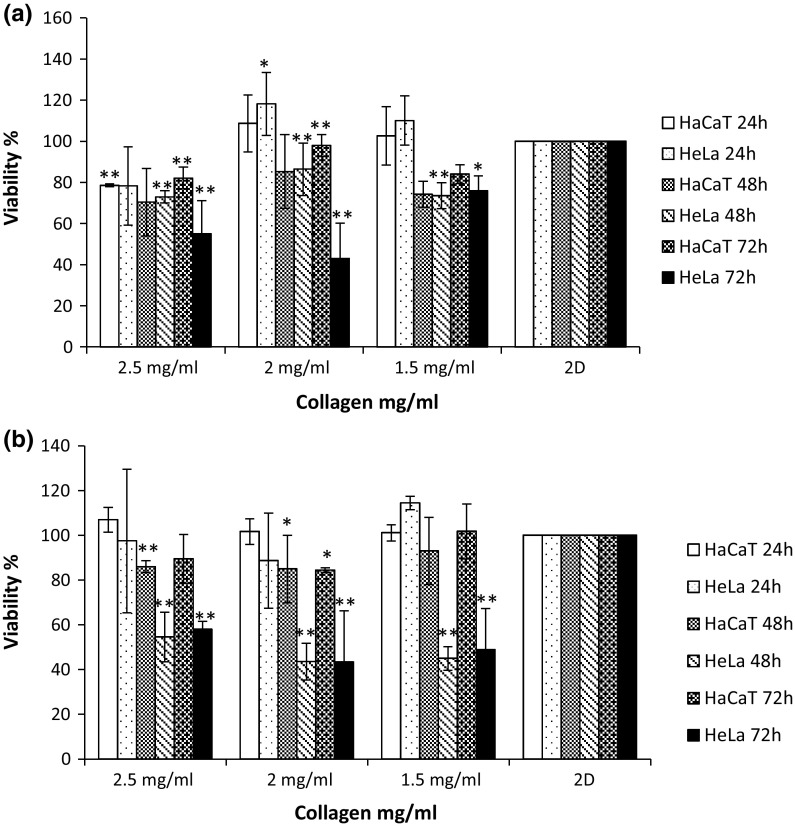
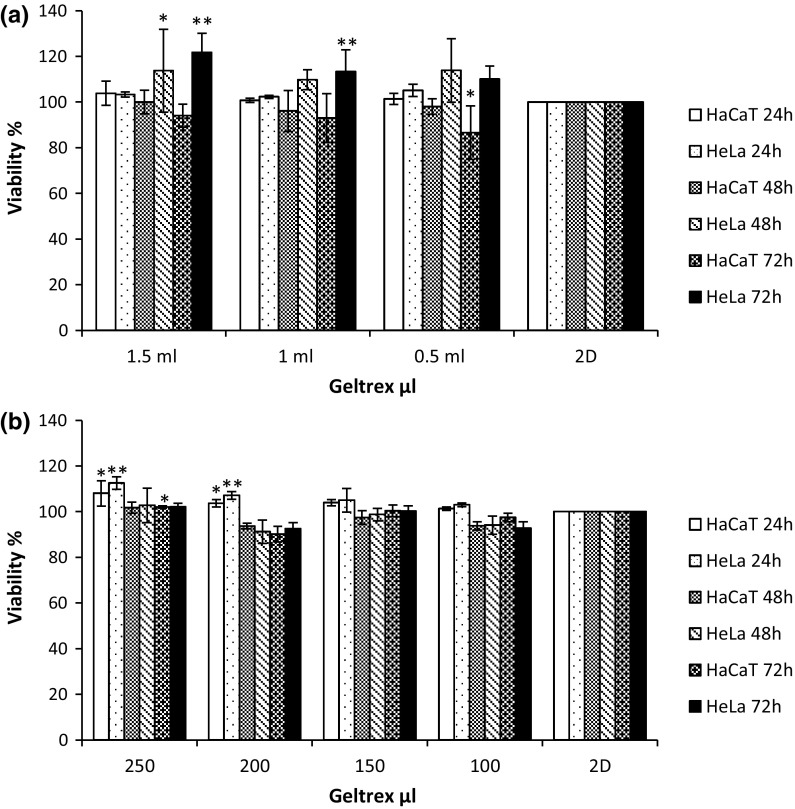
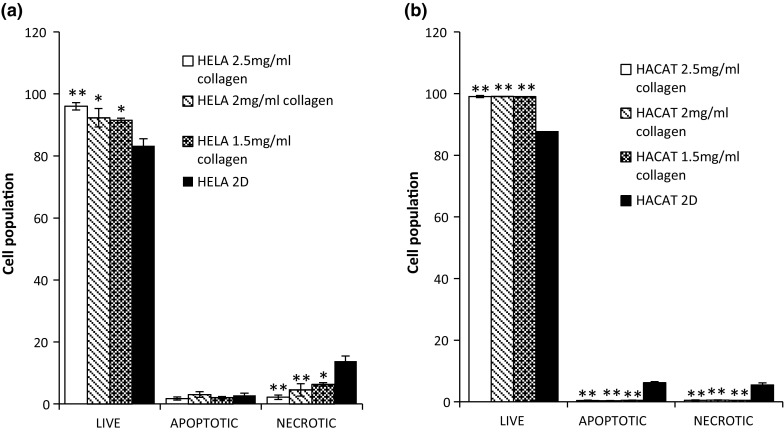
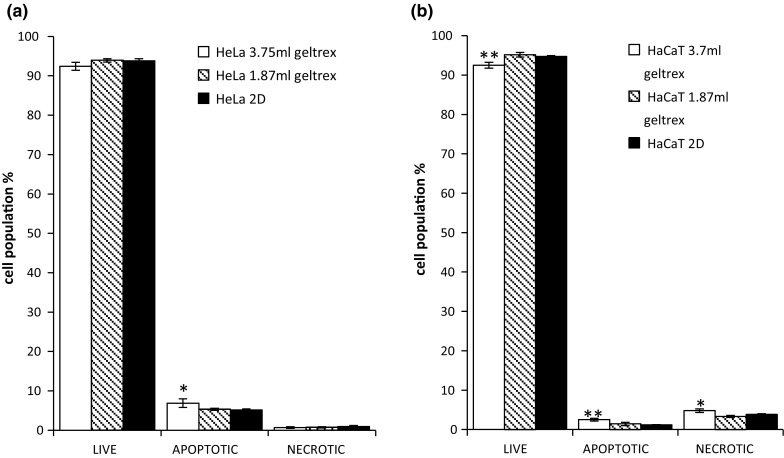
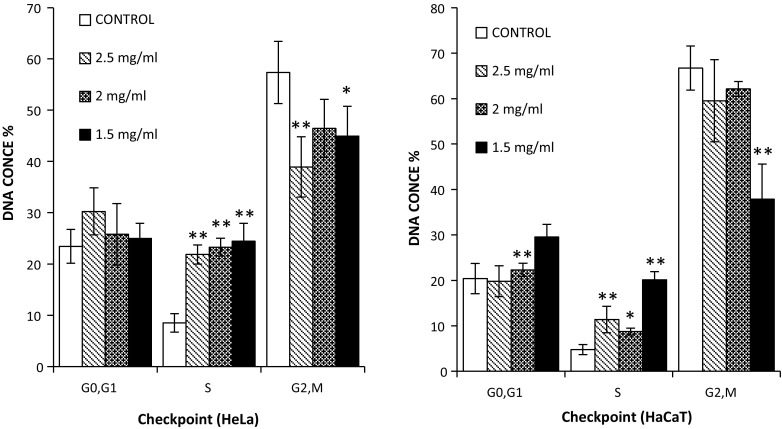
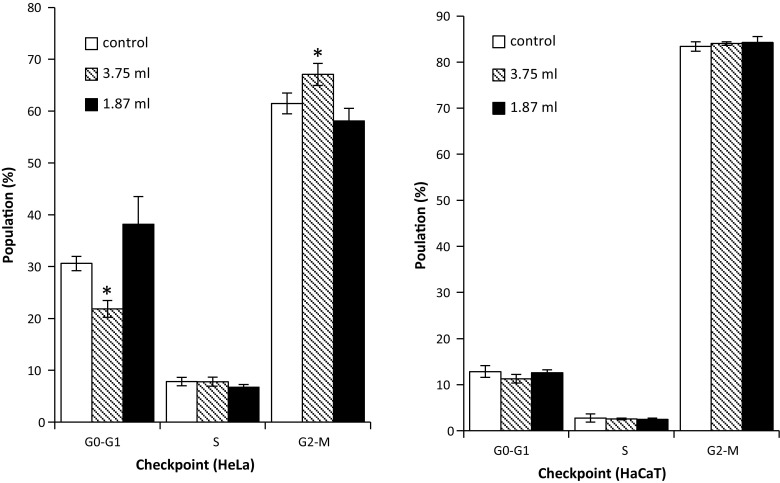
In this study, the cellular viability and function of immortalized human cervical and dermal cells are monitored and compared in conventional 2D and two commercial 3D membranes, Collagen and Geltrex, of varying working concentration and volume. Viability was monitored with the aid of the Alamar Blue assay, cellular morphology was monitored with confocal microscopy, and cell cycle studies and cell death mechanism studies were performed with flow cytometry. The viability studies showed apparent differences between the 2D and 3D culture systems, the differences attributed in part to the physical transition from 2D to 3D environment causing alterations to effective resazurin concentration, uptake and conversion rates, which was dependent on exposure time, but also due to the effect of the membrane itself on cellular function. These effects were verified by flow cytometry, in which no significant differences in viable cell numbers between 2D and 3D systems were observed after 24 h culture. The results showed the observed effect was different after shorter exposure periods, was also dependent on working concentration of the 3D system and could be mediated by altering the culture vessel size. Cell cycle analysis revealed cellular function could be altered by growth on the 3D substrates and the alterations were noted to be dependent on 3D membrane concentration. The use of 3D culture matrices has been widely interpreted to result in "improved viability levels" or "reduced" toxicity or cellular "resistance" compared to cells cultured on traditional 2D systems. The results of this study show that cellular health and viability levels are not altered by culture in 3D environments, but their normal cycle can be altered as indicated in the cell cycle studies performed and such variations must be accounted for in studies employing 3D membranes for in vitro cellular screening.
Keywords: 3D matrices; Collagen I; Confocal microscopy; Geltrex®; In vitro screening.
Figures
Similar articles
-
Chemotherapeutic efficiency of drugs in vitro: Comparison of doxorubicin exposure in 3D and 2D culture matrices.Toxicol In Vitro. 2016 Jun;33:99-104. doi: 10.1016/j.tiv.2016.02.022. Epub 2016 Feb 27. Toxicol In Vitro. 2016. PMID: 26930252
-
Cell viability assessment using the Alamar blue assay: a comparison of 2D and 3D cell culture models.Toxicol In Vitro. 2015 Feb;29(1):124-31. doi: 10.1016/j.tiv.2014.09.014. Epub 2014 Oct 6. Toxicol In Vitro. 2015. PMID: 25300790
-
Raman spectroscopy detects biochemical changes due to different cell culture environments in live cells in vitro.Anal Bioanal Chem. 2018 Nov;410(28):7537-7550. doi: 10.1007/s00216-018-1371-5. Epub 2018 Sep 25. Anal Bioanal Chem. 2018. PMID: 30255323
-
The relevance of using 3D cell cultures, in addition to 2D monolayer cultures, when evaluating breast cancer drug sensitivity and resistance.Oncotarget. 2016 Jul 19;7(29):45745-45756. doi: 10.18632/oncotarget.9935. Oncotarget. 2016. PMID: 27304190 Free PMC article.
-
Engineering Cellular Microenvironments with Photo- and Enzymatically Responsive Hydrogels: Toward Biomimetic 3D Cell Culture Models.Acc Chem Res. 2017 Apr 18;50(4):703-713. doi: 10.1021/acs.accounts.6b00543. Epub 2017 Mar 27. Acc Chem Res. 2017. PMID: 28345876
Cited by
-
Myrtenol Attenuates MRSA Biofilm and Virulence by Suppressing sarA Expression Dynamism.Front Microbiol. 2019 Sep 4;10:2027. doi: 10.3389/fmicb.2019.02027. eCollection 2019. Front Microbiol. 2019. PMID: 31551964 Free PMC article.
-
Antibiofilm and staphyloxanthin inhibitory potential of terbinafine against Staphylococcus aureus: in vitro and in vivo studies.Ann Clin Microbiol Antimicrob. 2022 May 30;21(1):21. doi: 10.1186/s12941-022-00513-7. Ann Clin Microbiol Antimicrob. 2022. PMID: 35637481 Free PMC article.
-
Three-dimensional, PEG-based hydrogels induce spheroid formation and enhance viability of A2058 melanoma cells.FEBS Open Bio. 2023 Dec;13(12):2356-2366. doi: 10.1002/2211-5463.13719. Epub 2023 Oct 30. FEBS Open Bio. 2023. PMID: 37863640 Free PMC article.
-
Synergistic Benefits: Exploring the Anti-Virulence Effects of Metformin/Vildagliptin Antidiabetic Combination against Pseudomonas aeruginosa via Controlling Quorum Sensing Systems.Biomedicines. 2023 May 14;11(5):1442. doi: 10.3390/biomedicines11051442. Biomedicines. 2023. PMID: 37239113 Free PMC article.
-
Human Plasma-Derived 3D Cultures Model Breast Cancer Treatment Responses and Predict Clinically Effective Drug Treatment Concentrations.Cancers (Basel). 2020 Jun 29;12(7):1722. doi: 10.3390/cancers12071722. Cancers (Basel). 2020. PMID: 32610529 Free PMC article.
References
LinkOut - more resources
Full Text Sources
Other Literature Sources
