. 2018 Jan 11;37(2):231-240.
doi: 10.1038/onc.2017.320. Epub 2017 Sep 18.

Small molecules targeted to the microtubule-Hec1 interaction inhibit cancer cell growth through microtubule stabilization

Affiliations

Small molecules targeted to the microtubule-Hec1 interaction inhibit cancer cell growth through microtubule stabilization

M Ferrara et al. Oncogene. .

Abstract

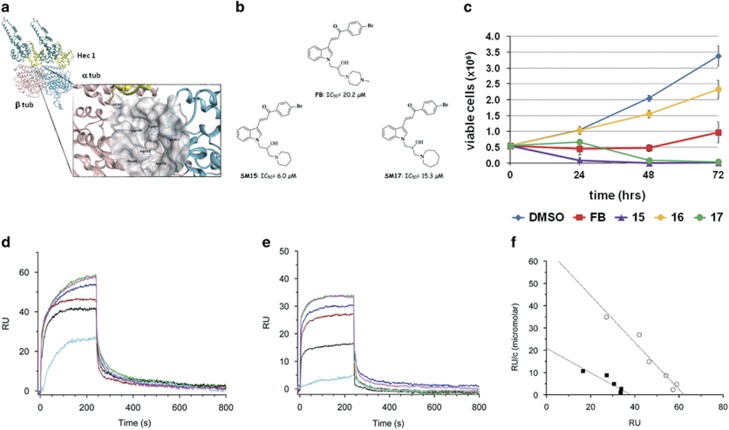
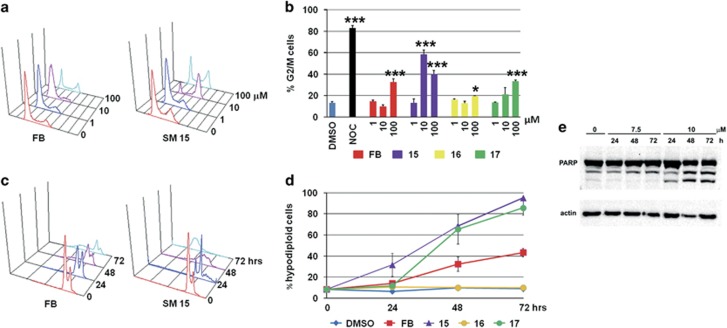
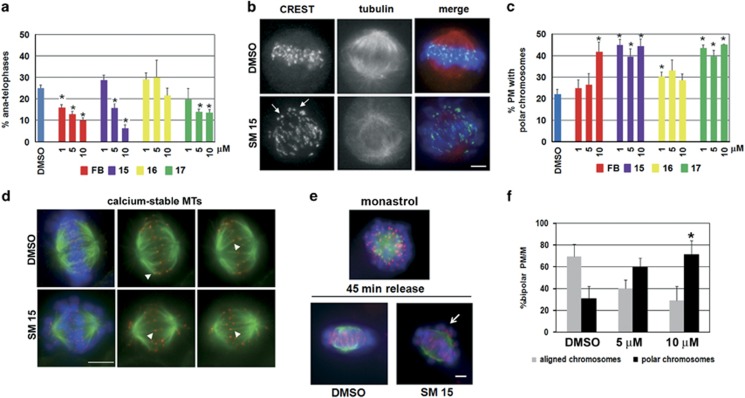
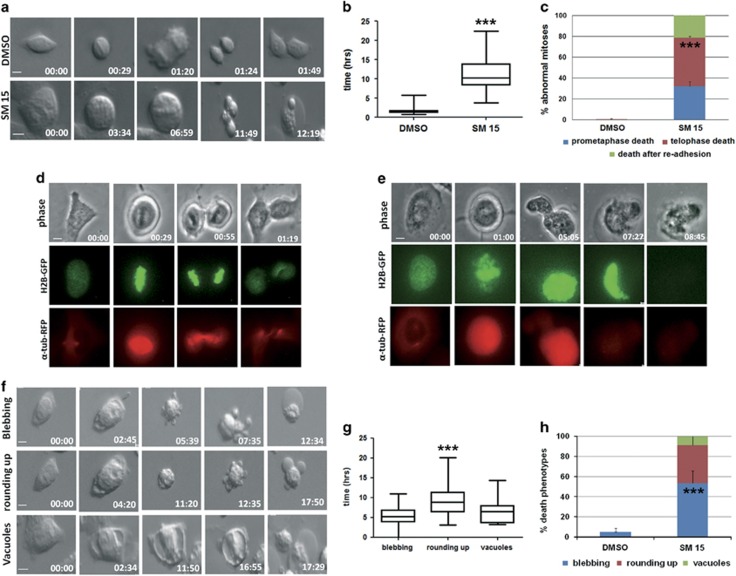
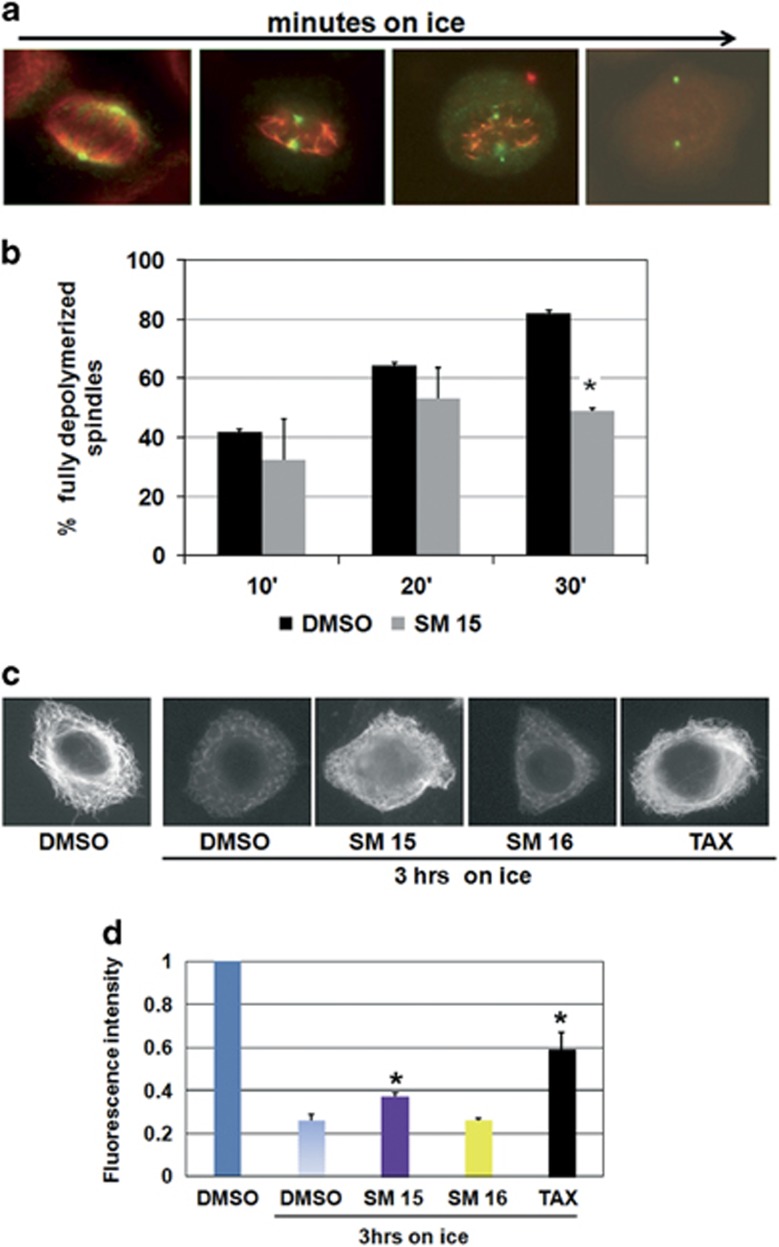
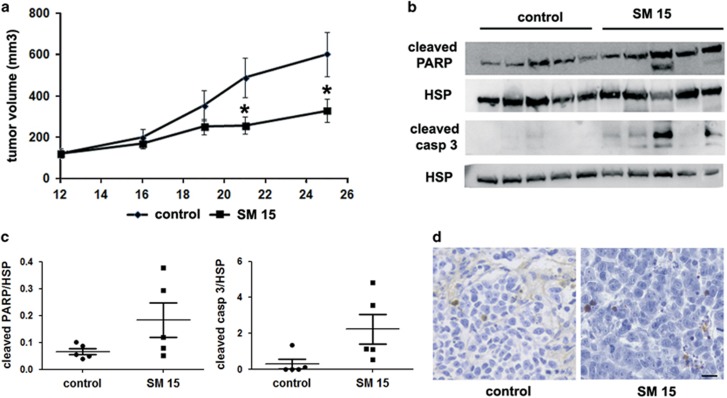
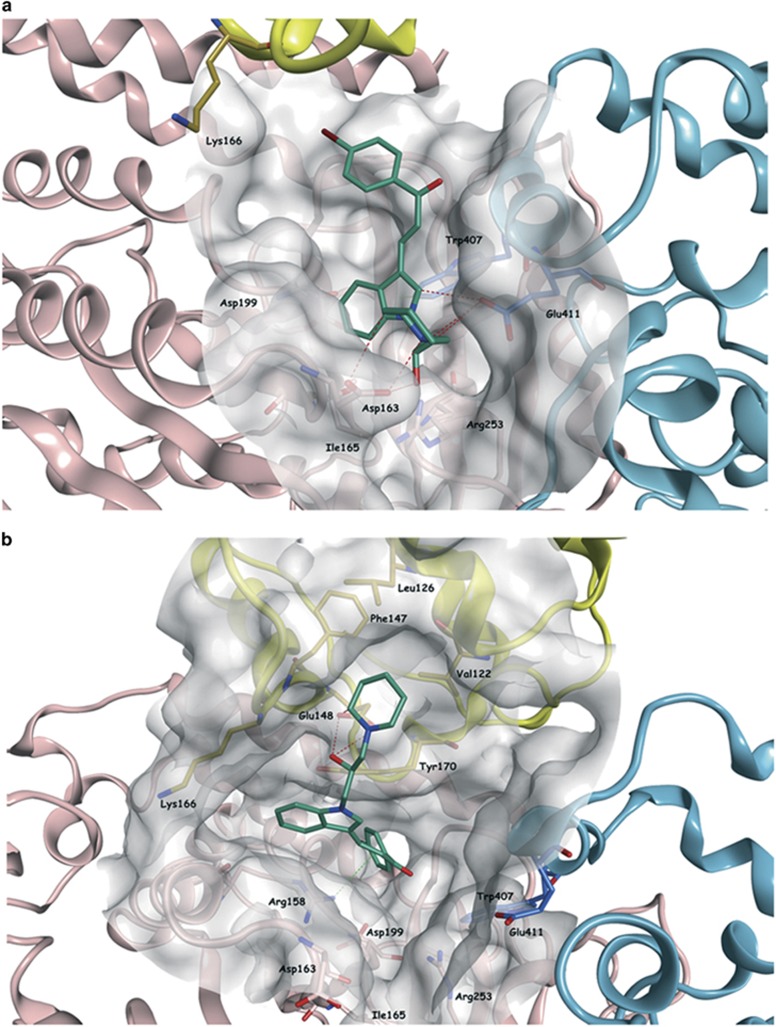
Highly expressed in cancer protein 1 (Hec1) is a subunit of the kinetochore (KT)-associated Ndc80 complex, which ensures proper segregation of sister chromatids at mitosis by mediating the interaction between KTs and microtubules (MTs). HEC1 mRNA and protein are highly expressed in many malignancies as part of a signature of chromosome instability. These properties render Hec1 a promising molecular target for developing therapeutic drugs that exert their anticancer activities by producing massive chromosome aneuploidy. A virtual screening study aimed at identifying small molecules able to bind at the Hec1-MT interaction domain identified one positive hit compound and two analogs of the hit with high cytotoxic, pro-apoptotic and anti-mitotic activities. The most cytotoxic analog (SM15) was shown to produce chromosome segregation defects in cancer cells by inhibiting the correction of erroneous KT-MT interactions. Live cell imaging of treated cells demonstrated that mitotic arrest and segregation abnormalities lead to cell death through mitotic catastrophe and that cell death occurred also from interphase. Importantly, SM15 was shown to be more effective in inducing apoptotic cell death in cancer cells as compared to normal ones and effectively reduced tumor growth in a mouse xenograft model. Mechanistically, cold-induced MT depolymerization experiments demonstrated a hyper-stabilization of both mitotic and interphase MTs. Molecular dynamics simulations corroborate this finding by showing that SM15 can bind the MT surface independently from Hec1 and acts as a stabilizer of both MTs and KT-MT interactions. Overall, our studies represent a clear proof of principle that MT-Hec1-interacting compounds may represent novel powerful anticancer agents.


Conflict of interest statement

The authors declare no conflict of interest.

Figures

Figure 1
Figure 1
A virtual screening targeted to the MT–Hec1 interaction identifies highly cytotoxic compounds. (a) Crystal structure of the α (sky blue) and β (pink) tubulin dimer in association with the Ndc80-SPC25 chimera protein (teal). The ‘toe’ region of Hec1 is in yellow. The zoom highlights the pocket (represented as gray molecular surface) at the interface between the two tubulin monomers where the virtual screening study has been performed. Important amino acid residues from α-tubulin chain and β-tubulin chain are reported. Hec1 Lys166 is in proximity of the selected pocket. The protein backbone is shown as ribbon. (b) Chemical structure of FB and its derivatives SM15 and SM17. (c) Time course viability assay for selected compounds (FB, SM15, SM16, SM17). Data are means±s.e.m. of 2–4 independent experiments. (d) Sensorgrams showing the interaction between MTs, immobilized on a COOH5 chip, and SM15 at different concentrations. (e) Sensorgrams showing the interaction between tubulin, immobilized on a COOH5 chip, and SM15 at different concentrations. Concentrations of SM15 were: 0.78 μM: cyan; 1.56 μM: black; 3.12 μM: red; 6.25 μM: blue; 12.5 μM: green; 25 μM: magenta. The increase in RU relative to baseline indicates complex formation; the plateau region represents the steady-state phase of the interaction, whereas the decrease in RU represents dissociation of SM15 from immobilized ligands after injection of running buffer. (f) Scatchard plots of SPR experiments showing the interaction (that is, RU values at equilibrium) of SM15 at different concentrations with MTs (circles) and tubulin (squares). Upon linear fitting, KD values of 0.94±0.13 μM and 1.8±0.4 μM were calculated for the SM15 interaction with MTs and tubulin, respectively.
Figure 2
Figure 2
MT-Hec1-interacting SMs lead to a G2/M phase accumulation and induce apoptosis in HeLa cells. (a) Representative flow cytometric histograms of cell cycle distribution following 24 h exposure to different concentrations of FB and SM15. X axis=DNA content (linear scale), Y axis=number of events. (b) Quantitative analysis of the percentage of cells in G2/M phases of the cell cycle after 24 h exposure to FB, SM15, SM16 and SM17. Data are means±s.e.m. of 2–4 independent experiments. 1 μM nocodazole (NOC) was used as positive control. ***P < 0.001. (c) Representative flow cytometric histograms of the hypodiploid peak following different exposure times to 10 μM FB or SM15. X axis=DNA content (log scale), Y axis=number of events. (d) Quantitative analysis of the percentage of hypodiploid cells following different exposure times to 10 μM FB, SM15, SM16 and SM17. Data are means±s.e.m. of 2–4 independent experiments. (e) Western blotting analysis of PARP cleavage after different exposure times to 7.5 and 10 μM SM15. Actin is shown as loading control.
Figure 3
Figure 3
MT-Hec1-interacting SMs disrupt mitotic division in HeLa cells. (a) Quantitative analysis of anaphase percentage after 3 h treatment with FB, SM15, SM16 and SM17. Data are means±s.e.m. obtained by scoring 240 mitoses per condition in three independent experiments. (b) Representative images of untreated cells showing chromosomes aligned to the metaphase plate and SM15-treated cells with chromosomes remaining at the spindle poles, as identified by KT signals at spindle poles (arrows). Mitotic spindles (red) and KTs (green) are visualized by α-tubulin and CREST antibodies. Chromosomes are identified by DAPI staining (blue). (c) Quantitative analysis of prometaphases (PM) showing polar chromosomes following 3 h exposure to FB, SM15, SM16 and SM17. Data are means±s.e.m. obtained by scoring 240 PM per condition in three independent experiments. (d) Representative images of calcium-resistant MTs in HeLa cells treated with DMSO or 10 μM SM15 for 3 h. MTs (green) and KTs (red) are visualized by immunostaining α-tubulin and Hec1. Chromosomes are identified by DAPI staining (blue). Images in the first column are maximum intensity projections of a Z series of optical sections at 0.5 μm interval. In the second and third column single optical sections of MTs and KTs are presented to better visualize KT–MT attachments (arrowheads). (e) Representative images of MON-induced monopolar spindles (monastrol), fully aligned bipolar spindles in control cells (DMSO) or bipolar spindles with polar chromosomes in SM15-treated cells (SM15) at the end of the recovery time from MON arrest (45 min release). Cells were incubated with 100 μM MON for 4 h and then released in 10 μM MG-132-containing medium with or without 10 μM SM15. (f) Quantitative analysis of prometaphases/metaphases (PM/M) showing aligned chromosomes or polar chromosomes after 45 min recovery time from MON arrest in DMSO-treated and SM15-treated cells. Data are means±s.e.m. obtained by scoring ⩾100 PM/M per condition in two independent experiments. *P<0.05. Bars=5 μm.
Figure 4
Figure 4
Apoptotic cell death intervenes from mitosis and interphase after treatment with MT-Hec1-interacting SM15. (a) Still images of an untreated HeLa cell (DMSO) or a SM15- treated HeLa cell (SM15) recorded by time-lapse microscopy under differential interference contrast (DIC). Time is given in h:min. Cells enter mitosis at time 00.00. (b) Box-plots with whiskers showing minimum and maximum values of the time spent in mitosis. (c) Quantitative analysis of cell death phenotypes of mitotic HeLa cells recorded as in a. Data are means±s.e.m. of two experiments. DMSO N=50; SM15 N=28. *** P<0.001 comparing the mean value for death in telophase in control vs SM15-treated samples. (d) An untreated H2B-GFP and α-tubulin-RFP expressing U2OS cell recorded by time-lapse microscopy under fluorescence and phase contrast. Chromosome congression and spindle formation are visualized by H2B-GFP and α-tubulin-RFP. (e) An H2B-GFP and α-tubulin-RFP expressing U2OS cell treated with SM15 and recorded as in d. Chromosomes persist scattered at the poles (01:00) and then collapse (05:05) until DNA diffuses from the cell when the death process is completed (08:45). (f) Still images of interphase HeLa cells recorded as in (a) undergoing apoptotic cell death after treatment with SM15. Cells round up and partially detach from the substrate at time 00.00. (g) Box-plots with whiskers showing minimum and maximum values of the time spent to complete the death process in HeLa cells. ***P<0.001 comparing mean time in rounding up vs blebbing samples. (h) Quantitative analysis of cell death phenotypes in interphase HeLa cells. DMSO N=12; SM15 N=93. ***P<0.001 comparing the mean value for blebbing in control vs SM15-treated samples. Bars=5 μm.
Figure 5
Figure 5
Mitotic and interphase MTs are stabilized by SM15 treatment. (a) Representative images of MT depolymerization during incubation on ice. After short incubation times on ice, non-KT MTs depolymerize leaving behind only K-fibers, that is, the bundle of MTs attached to KTs; for longer times on ice also K-fibers depolymerize leading to fully depolymerized spindles (third and forth image in the row). MTs (red) and spindle poles (green) are visualized by α-tubulin and γ-tubulin immunostaining. (b) Quantitative analysis of the percentage of fully depolymerized spindles in cells exposed to DMSO or 10 μM SM15 for 3 h prior and during 10, 20 or 30 min incubation on ice. The graph shows means±s.e.m. by scoring 240 mitoses per condition in three independent experiments. (c) Representative images of the interphase MT network in the different treatment conditions as visualized by α-tubulin immunostaining. (d) Quantitative analysis of interphase MT depolymerization in cells exposed to 1% DMSO, SM15, SM16 (10 μM) or 0.1 μM taxol (TAX) for 3 h prior and during 3 h of incubation on ice. The graph shows means of α-tubulin fluorescence intensity±s.e.m. (in arbitrary units) by measuring 20 cells per condition from two independent experiments. α-tubulin fluorescence intensity in untreated cells is set as 1. *P<0.05.
Figure 6
Figure 6
MT-Hec1-interacting SM15 inhibits HeLa tumor growth in vivo. (a) Tumor growth curves in mice with or without intraperitoneal injection of SM15 (10 mg/kg) for five consecutive days for three weeks starting from tumor palpability. (b) Western blotting analysis of cleaved PARP and cleaved caspase 3 in protein lysates from tumors excided at sacrifice. HSP is shown as loading control. (c) Cleaved PARP/HSP ratio and cleaved caspase 3/HSP ratio from the densitometric analysis of western blots in b. Each scatter plot presents individual values of control and SM15-treated animals. (d) Representative images of TUNEL staining in histological sections from tumors excided at sacrifice. Bar=20 μm. *P<0.05 by non-parametric Mann–Whitney test.
Figure 7
Figure 7
SM15 binding conformation after MD simulation. (a) Predicted binding mode of SM15 (carbon atoms in emerald) in the selected binding area between the two tubulin subunits. The molecule is interacting with the surrounding residues (for example Asp163, Trp407 and Glu411) placing the indole-bromophenyl–propenone group deep in the pocket. (b) After 100 ns MD simulation, the piperidine ring of SM15 moved toward Hec1 inserting itself in a small hydrophobic pocket within the calponin homology domain formed by Val122, Leu126, Phe147 and Tyr170 (carbon atoms in gold). The rest of the molecule, especially the bromophenyl–propenone part, remained between the two tubulin subunits. Interactions of SM15 with Hec1 and β-tubulin are represented as dashed red and green lines, respectively.

References

    1. Weaver BA, Silk AD, Montagna C, Verdier-Pinard P, Cleveland DW. Aneuploidy acts both oncogenically and as a tumor suppressor. Cancer Cell 2007; 11: 25–36. - PubMed
    1. Janssen A, Medema RH. Genetic instability: tipping the balance. Oncogene 2013; 32: 4459–4470. - PubMed
    1. Janssen A, Kops GJ, Medema RH. Elevating the frequency of chromosome mis- segregation as a strategy to kill tumor cells. Proc Natl Acad Sci USA 2009; 106: 19108–19113. - PMC - PubMed
    1. Galimberti F, Thompson SL, Liu X, Li H, Memoli V, Green SR et al. Targeting the cyclin E-Cdk-2 complex represses lung cancer growth by triggering anaphase catastrophe. Clin Cancer Res 2010; 16: 109–120. - PMC - PubMed
    1. Bakhoum SF, Compton DA. Chromosomal instability and cancer: a complex relationship with therapeutic potential. J Clin Invest 2012; 122: 1138–1143. - PMC - PubMed

Publication types

MeSH terms