Randomized Controlled Trial
. 2018 Feb;42(2):129-138.
doi: 10.1038/ijo.2017.206. Epub 2017 Aug 17.

Intermittent energy restriction improves weight loss efficiency in obese men: the MATADOR study

Affiliations
Randomized Controlled Trial

Intermittent energy restriction improves weight loss efficiency in obese men: the MATADOR study

N M Byrne et al. Int J Obes (Lond). 2018 Feb.

Abstract

Background/objectives: The MATADOR (Minimising Adaptive Thermogenesis And Deactivating Obesity Rebound) study examined whether intermittent energy restriction (ER) improved weight loss efficiency compared with continuous ER and, if so, whether intermittent ER attenuated compensatory responses associated with ER.

Subjects/methods: Fifty-one men with obesity were randomised to 16 weeks of either: (1) continuous (CON), or (2) intermittent (INT) ER completed as 8 × 2-week blocks of ER alternating with 7 × 2-week blocks of energy balance (30 weeks total). Forty-seven participants completed a 4-week baseline phase and commenced the intervention (CON: N=23, 39.4±6.8 years, 111.1±9.1 kg, 34.3±3.0 kg m-2; INT: N=24, 39.8±9.5 years, 110.2±13.8 kg, 34.1±4.0 kg m-2). During ER, energy intake was equivalent to 67% of weight maintenance requirements in both groups. Body weight, fat mass (FM), fat-free mass (FFM) and resting energy expenditure (REE) were measured throughout the study.

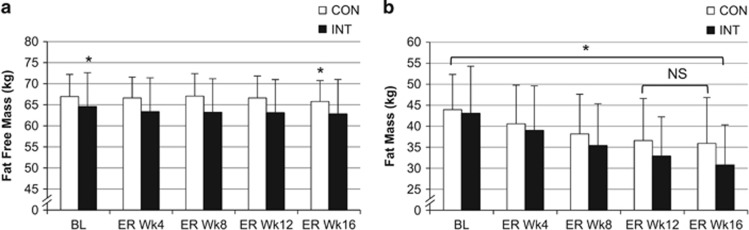
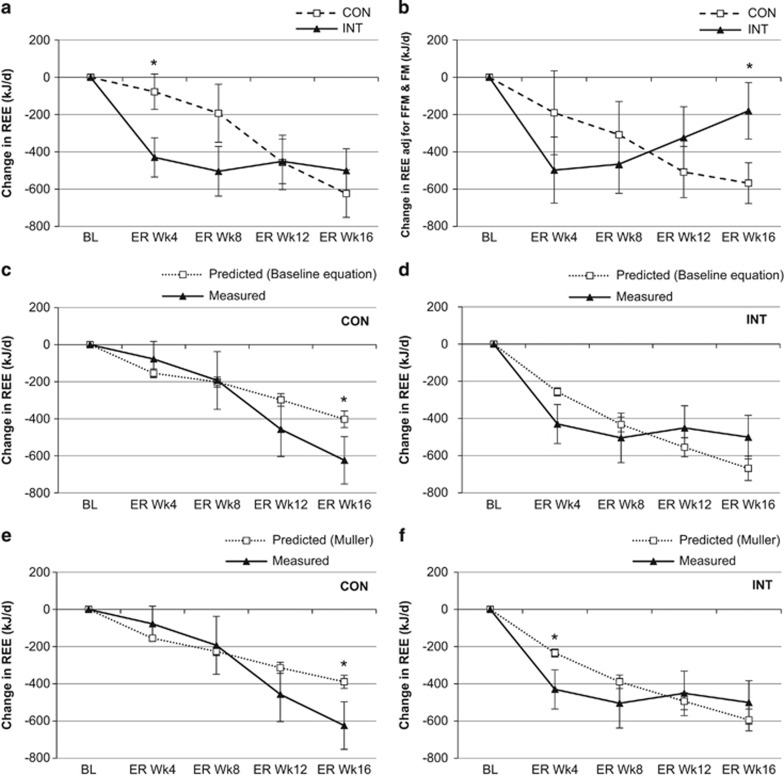
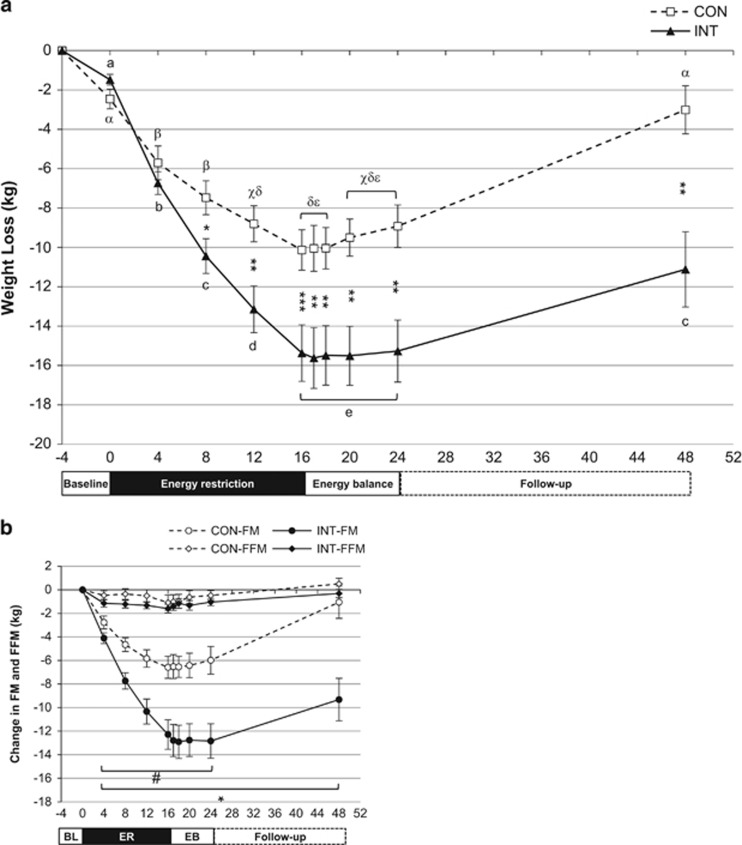
Results: For the N=19 CON and N=17 INT who completed the intervention per protocol, weight loss was greater for INT (14.1±5.6 vs 9.1±2.9 kg; P<0.001). INT had greater FM loss (12.3±4.8 vs 8.0±4.2 kg; P<0.01), but FFM loss was similar (INT: 1.8±1.6 vs CON: 1.2±2.5 kg; P=0.4). Mean weight change during the 7 × 2-week INT energy balance blocks was minimal (0.0±0.3 kg). While reduction in absolute REE did not differ between groups (INT: -502±481 vs CON: -624±557 kJ d-1; P=0.5), after adjusting for changes in body composition, it was significantly lower in INT (INT: -360±502 vs CON: -749±498 kJ d-1; P<0.05).

Conclusions: Greater weight and fat loss was achieved with intermittent ER. Interrupting ER with energy balance 'rest periods' may reduce compensatory metabolic responses and, in turn, improve weight loss efficiency.


Conflict of interest statement

Amanda Sainsbury has received payment from Eli Lilly, the Pharmacy Guild of Australia, Novo Nordisk, the Dietitians Association of Australia, Shoalhaven Family Medical Centres, and the Pharmaceutical Society of Australia for seminar presentation at conferences, and has served on the Nestlé Health Science OptifastVLCD Advisory Board since 2016. She is also the author of The Don’t go Hungry Diet (Bantam, Australia and New Zealand, 2007) and Don’t go Hungry for Life (Bantam, Australia and New Zealand, 2011). The remaining authors declare no conflict of interest.

Figures

Figure 1
Figure 1
Changes in body weight (kg; mean±s.e.m.) during baseline and 16 weeks of energy restriction (ER) in the continuous (CON; N=19) and intermittent (INT; N=17) groups. (a) Cumulative weight change (kg) over baseline (−4, −2, 0 weeks) and after 4, 8, 12 and 16 weeks of ER for the CON and INT groups. *Significant difference between groups; P<0.05. #Significant difference from baseline within-group; P<0.01. (b) Weight change (kg; mean±s.e.m.) in the intermittent energy restriction (INT) group during each of the 8 × 2-week energy restriction (ER) and 7 × 2-week energy balance (EB) blocks that comprised the 30-week intervention. Data are from participant-reported weights measured at home (N=20 except N=19 for ER5, EB5, EB6, ER7 and EB7, and N=17 for ER8). Weight change is calculated as the difference in weight measured from Day 1 of one block (for example, ER1) to Day 1 of the subsequent block (for example, EB1). Participants were instructed to record weight daily throughout the study. The majority (80% or 256/312) of measurements were taken on Day 1 of the block (as instructed), and 93% (299/312) of measurements were taken within ±1 day of Day 1.
Figure 2
Figure 2
Fat-free mass (FFM) and fat mass (FM) at baseline and during 16 weeks of energy restriction (ER) for the continuous (CON; N=19) and intermittent (INT; N=17) groups. (a) Fat-free mass (kg; mean±s.d.). * Differs significantly (P<0.05) from all other time points for the same intervention group. (b) Fat mass (kg; mean±s.d.). *All time points differ significantly (P<0.001) from each other within the same intervention group except those indicated (NS) in CON; these time points do not differ significantly (P>0.05).
Figure 3
Figure 3
Change from baseline in resting energy expenditure (REE; kJ d−1) for the continuous (CON; N=19) and intermittent (INT; N=17) groups. Data are mean±s.e.m. (a) Change in absolute (unadjusted) REE after each 4 weeks of ER for the CON and INT groups. *Significant difference between groups; P<0.05. (b) Change in REE adjusted for FFM and FM after each 4 weeks of ER in CON and INT groups. *Significant difference between groups; P<0.05. (c) Change in predicted REE (from baseline regression equation) and measured REE at 4, 8, 12 and 16 weeks of ER for the CON group. *Significant difference between predicted and measured; P<0.05. (d) Change in predicted REE (from baseline regression equation) and measured REE at 4, 8, 12 and 16 weeks of ER for the INT group. *Significant difference between predicted and measured; P<0.05. (e) Change in predicted REE (from Muller et al. equation) and measured REE at 4, 8, 12 and 16 weeks of ER for the CON group. *Significant difference between predicted and measured; P<0.05. (f) Change in predicted REE (from Muller et al. equation) and measured REE at 4, 8, 12 and 16 weeks of ER for the INT group. *Significant difference between predicted and measured; P<0.05.
Figure 4
Figure 4
Weight and body composition in the subsample (CON: N=13, INT: N=15) of participants with data at all the following time points: baseline, during and end of energy restriction (ER), during and after 8 weeks of energy balance immediately post-ER-intervention, and follow-up 6 months later. (a) Weight loss (kg; mean±s.e.m.). Significant difference between groups * P<0.05, ** P<0.01, *** P<0.001. Different letters indicate significant differences between time points within each group (P<0.05; CON: α,β,χ,δ,ε INT: a,b,c,d,e). (b) Changes in FFM and FM (kg; mean±s.e.m.). # FM significantly different from baseline in CON; * FM significantly different from baseline in INT (P<0.05). Note: N=13 for CON, except N=12 for Wk1 and Wk2 of EB (Weeks 17 and 18) and N=15 for INT, except N=14 for Wk1, 2, 4 and 8 of EB (Weeks 17, 18, 20 and 24).

References

    1. Byrne NM, Hills AP. Biology or behavior: which is the strongest contributor to weight gain? Curr Obes Rep 2013; 2: 65–76.
    1. King NA, Horner K, Hills AP, Byrne NM, Wood RE, Bryant E et al. Exercise, appetite and weight management: understanding the compensatory responses in eating behaviour and how they contribute to variability in exercise-induced weight loss. Brit J Sport Med 2012; 46: 315. - PubMed
    1. Ahima RS, Prabakaran D, Mantzoros C, Qu D, Lowell B, Maratos-Flier E et al. Role of leptin in the neuroendocrine response to fasting. Nature 1996; 382: 250–225. - PubMed
    1. Erickson JC, Ahima RS, Hollopeter G, Flier JS, Palmiter RD. Endocrine function of neuropeptide Y knockout mice. Regul Pept 1997; 70: 199–202. - PubMed
    1. Friedl KE, Moore RJ, Hoyt RW, Marchitelli LJ, Martinez-Lopez LE, Askew EW. Endocrine markers of semistarvation in healthy lean men in a multistressor environment. J Appl Physiol 2000; 88: 1820–1830. - PubMed

Publication types