. 2017 Sep 16;9(9):1027.
doi: 10.3390/nu9091027.

Broad and Inconsistent Muscle Food Classification Is Problematic for Dietary Guidance in the U.S

Affiliations

Broad and Inconsistent Muscle Food Classification Is Problematic for Dietary Guidance in the U.S

Cody L Gifford et al. Nutrients. .

Abstract

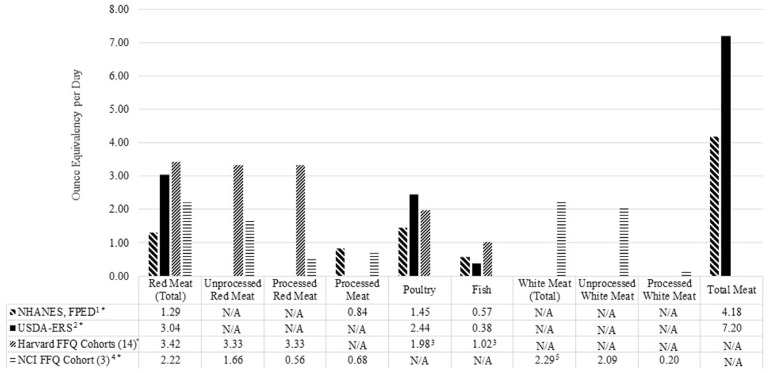
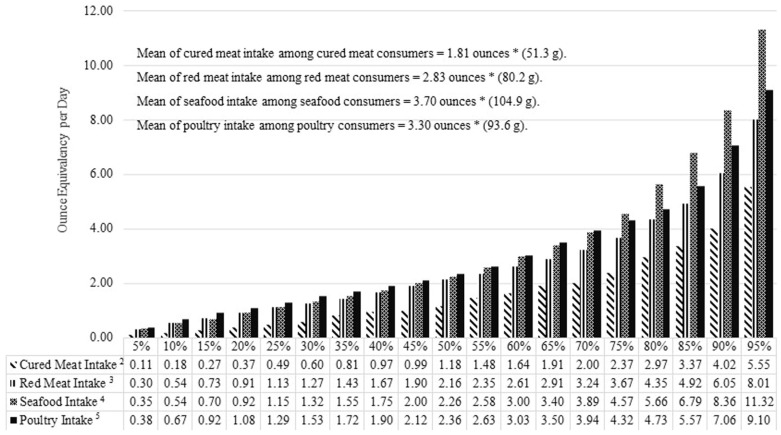
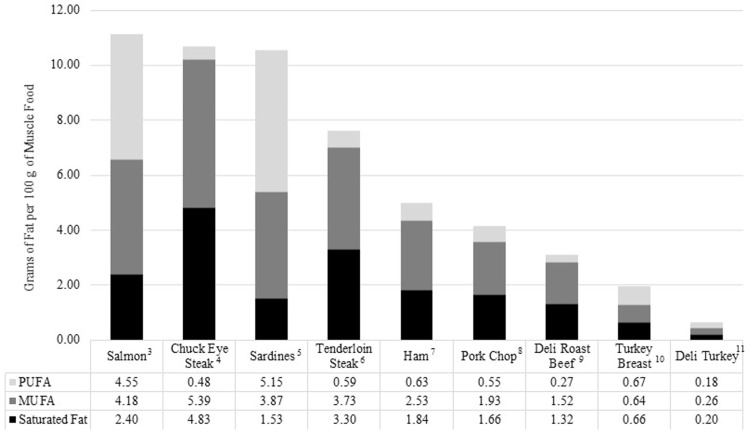
Dietary recommendations regarding consumption of muscle foods, such as red meat, processed meat, poultry or fish, largely rely on current dietary intake assessment methods. This narrative review summarizes how U.S. intake values for various types of muscle foods are grouped and estimated via methods that include: (1) food frequency questionnaires; (2) food disappearance data from the U.S. Department of Agriculture Economic Research Service; and (3) dietary recall information from the National Health and Nutrition Examination Survey data. These reported methods inconsistently classify muscle foods into groups, such as those previously listed, which creates discrepancies in estimated intakes. Researchers who classify muscle foods into these groups do not consistently considered nutrient content, in turn leading to implications of scientific conclusions and dietary recommendations. Consequentially, these factors demonstrate a need for a more universal muscle food classification system. Further specification to this system would improve accuracy and precision in which researchers can classify muscle foods in nutrition research. Future multidisciplinary collaboration is needed to develop a new classification system via systematic review protocol of current literature.

Keywords: assessment methods; classification; dietary recommendations; muscle foods; nutrient content; specification.


Conflict of interest statement

During the time this manuscript was being developed and written, W.W.C. received research support for other projects from American Egg Board–Egg Nutrition Center, Beef Checkoff, National Dairy Council, Pork Checkoff, and National Institutes of Health and USDA; received travel reimbursement from Barilla Co., National Dairy Council and Beef Checkoff to attend scientific consulting meetings. D.R.W. and K.E.B. have received research support for other projects from The Beef Checkoff and American Lamb Board. The other authors declare no conflict of interest.

Figures

Figure 1
Figure 1
Comparison of muscle food groupings and estimated intakes (ounces *) from food frequency questionnaires (FFQ), food disappearance data, and dietary recalls. 1 Adapted from United States Department of Agriculture, Agricultural Research Service, National Health and Nutrition Examination Survey, What We Eat in America, Food Pattern Equivalency Database 2013–2014 dataset available at [12] 2 Adapted from United States Department of Agriculture, Economic Research Service, Food Availability (Per Capita) Data System, Loss-Adjusted Food Availability, Meat, poultry, fish, eggs, and nuts, and fish. USDA-ERS per capita availability reflects supply at the consumer level adjusted for loss from primary, retail and consumer sources of loss or waste. More information about adjusting for loss can be found at [9]. 3 Weighted means were calculated for the median quartile of intake based on a three-ounce serving. 4 Baseline pooled median quartile intake was reported as g/1000 kcal from the National Institute of Health American Association of Retired Persons (NIH-AARP) cohort that used the National Cancer Institute Diet History Questionnaire II (NCI FFQ); intake levels presented in this figure are calculated ounce equivalents converted from g/2000 kcal. 5 White meat in the NIH-AARP cohort is inclusive of poultry and fish. N/A = Data not available. * 1 ounce ≈ 28 g.
Figure 2
Figure 2
Intake distribution of red meat, cured meat, seafood and poultry, among U.S. respondents from the National Health and Nutrition Examination Survey Food Pattern Equivalency Database (NHANES, FPED) 2013–2014 Datasets 1. 1 Adapted from United States Department of Agriculture, Agricultural Research Service, NHANES, WWEIA, FPED 2013–2014 available at [12]. 2 Intake of red meat from red meat consumers in this dataset. 3 Intake of processed meat from processed meat consumers in this dataset. 4 Intake of seafood from seafood consumers in this dataset. 5 Intake of poultry from poultry consumers in this dataset. * 1 ounce ≈ 28 g.
Figure 3
Figure 3
Fatty acid profiles (g of fat per 100 g 1) of selected cooked unprocessed and processed muscle foods 2. 1 9 CFR 317.362 USDA: Lean classifications per 100 g include and are defined as (1) Lean: <10 g total fat, <5 g saturated fat, <95 mg cholesterol; available at [20]. 2 Adapted from United States Department of Agriculture, Agricultural Research Service, Food Composition Database available at [18]. 3 USDA-ARS Food Composition Database number 15237: Fish, salmon, Atlantic, farmed, cooked, dry heat. 4 USDA-ARS Food Composition Database number 23077: Beef, chuck eye steak, boneless, separable lean only, trimmed to 0’ fat, all grades, cooked, grilled. 5 USDA-ARS Food Composition Database number 15237: Fish, sardine, Atlantic, canned in oil, drained solids with bone. 6 USDA-ARS Food Composition Database number 13442: Beef, loin, tenderloin steak, boneless, separable lean only, trimmed to 0’ fat, all grades, cooked, grilled. 7 USDA-ARS Food Composition Database number 10067, Pork, fresh, loin, top loin (chops), boneless, separable lean only, cooked, braised. 8 USDA-ARS Food Composition Database number 10153: Pork, cured, ham, whole, separable lean only, roasted. 9 USDA-ARS Food Composition Database number 07043: Roast beef, deli style, prepackaged, sliced. 10 USDA-ARS Food Composition Database number 05711, Turkey, retail parts, breast, meat only, cooked, roasted. 11 USDA-ARS Food Composition Database number 07046: Turkey breast, low salt, prepackaged or deli, luncheon meat.

References

    1. World Cancer Research Fund International Animal Foods. [(accessed on 3 June 2017)]; Available online: http://www.wcrf.org/int/research-we-fund/cancer-prevention-recommendatio....
    1. U.S. Department of Health and Human Services and U.S. Department of Agriculture 2015–2020 Dietary Guidelines for Americans, 8th Edition, December 2015. [(accessed on 3 June 2017)]; Available online: http://health.gov/dietaryguidelines/2015/guidelines/
    1. Etemadi A., Sinha R., Ward M.H., Graubard B.I., Inoue-Choi M., Dawsey S.M., Abnet C.C. Mortality from different causes associated with meat, heme iron, nitrates, and nitrites in the NIH-AARP Diet and Health Study: Population based cohort study. BMJ. 2017;357:j1957. doi: 10.1136/bmj.j1957. - DOI - PMC - PubMed
    1. Missmer S.A., Smith-Warner S.A., Spiegelman D., Yaun S.-S., Adami H.-O., Beeson W.L., Van Den Brandt P.A., Fraser G.E., Freudenheim J.L., Goldbohm R.A. Meat and dairy food consumption and breast cancer: A pooled analysis of cohort studies. Int. J. Epidemiol. 2002;31:78–85. doi: 10.1093/ije/31.1.78. - DOI - PubMed
    1. Norat T., Lukanova A., Ferrari P., Riboli E. Meat consumption and colorectal cancer risk: Dose-response meta-analysis of epidemiological studies. Int. J. Cancer. 2002;98:241–256. doi: 10.1002/ijc.10126. - DOI - PubMed

Publication types

LinkOut - more resources