

The Impact of Non-Lethal Single-Dose Radiation on Tumor Invasion and Cytoskeletal Properties
- PMID: 28926987
- PMCID: PMC5618650
- DOI: 10.3390/ijms18092001
The Impact of Non-Lethal Single-Dose Radiation on Tumor Invasion and Cytoskeletal Properties
Abstract
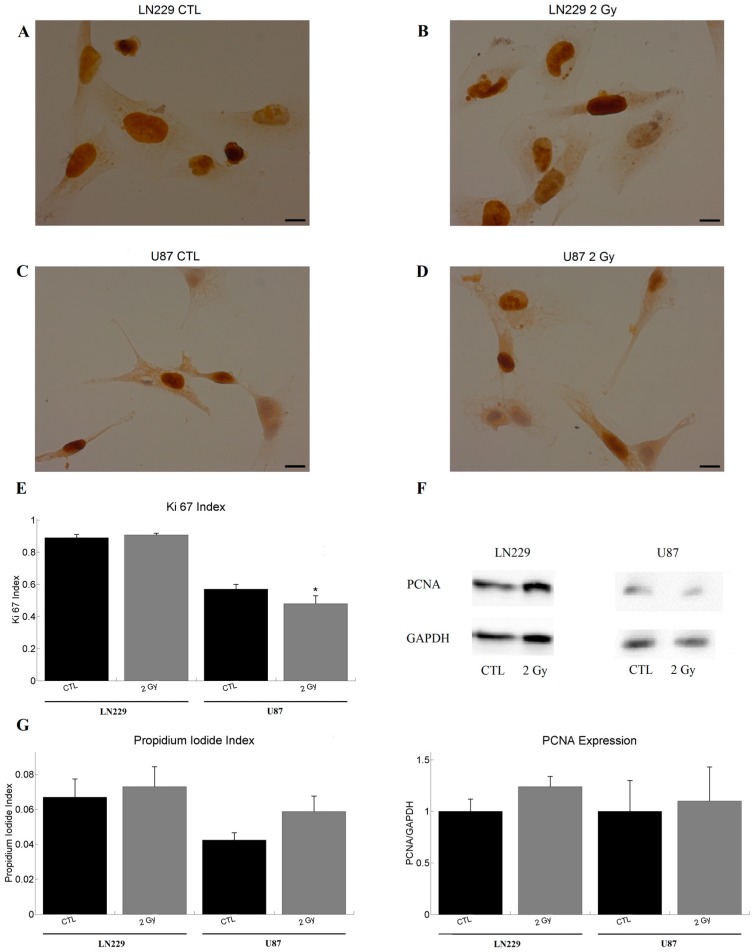
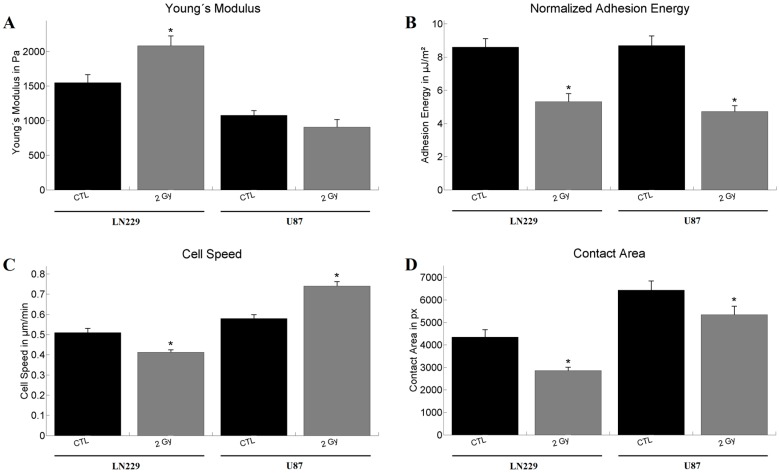
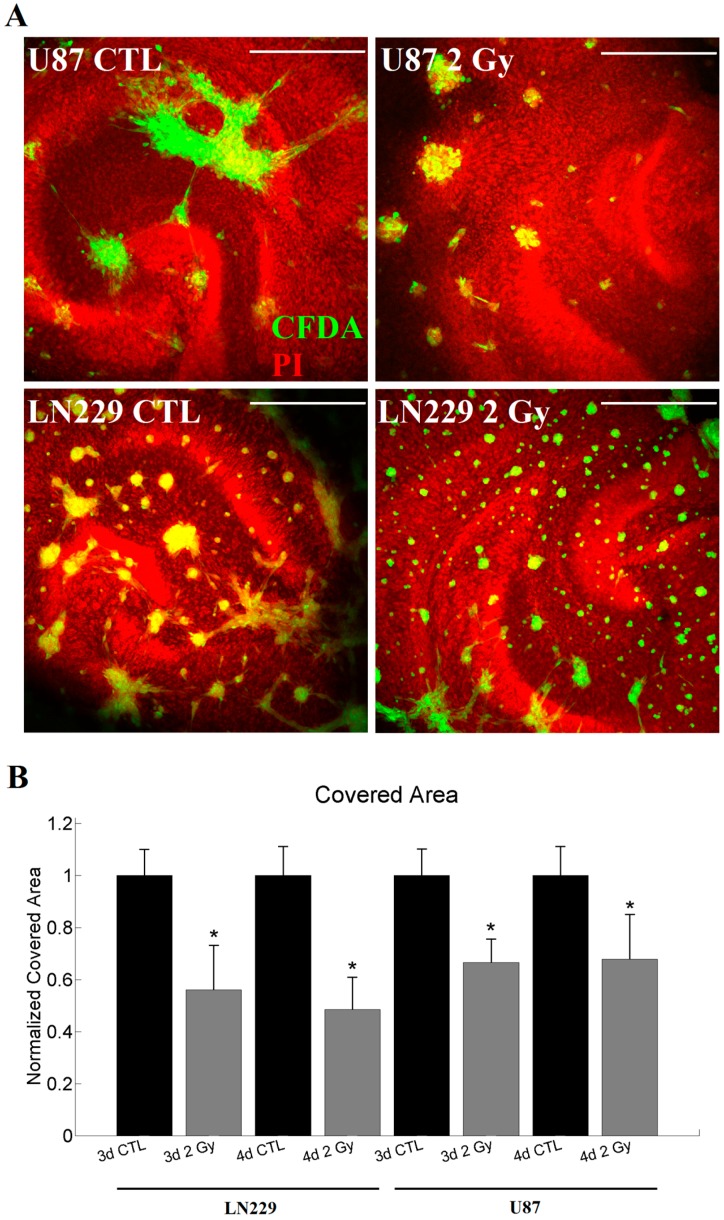
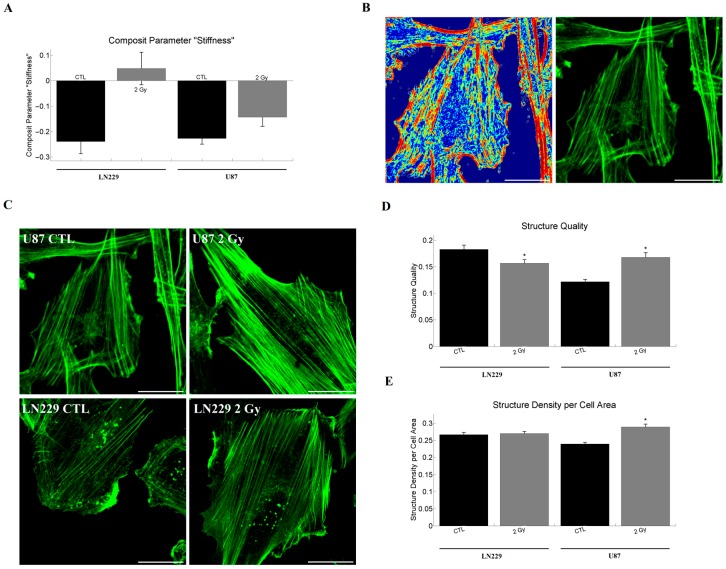
Irradiation is the standard therapy for glioblastoma multiforme. Glioblastoma are highly resistant to radiotherapy and the underlying mechanisms remain unclear. To better understand the biological effects of irradiation on glioblastoma cells, we tested whether nonlethal irradiation influences the invasiveness, cell stiffness, and actin cytoskeleton properties. Two different glioblastoma cell lines were irradiated with 2 Gy and changes in mechanical and migratory properties and alterations in the actin structure were measured. The invasiveness of cell lines was determined using a co-culture model with organotypic hippocampal slice cultures. Irradiation led to changes in motility and a less invasive phenotype in both investigated cell lines that were associated with an increase in a "generalized stiffness" and changes in the actin structure. In this study we demonstrate that irradiation can induce changes in the actin cytoskeleton and motility, which probably results in reduced invasiveness of glioblastoma cell lines. Furthermore, "generalized stiffness" was shown to be a profound marker of the invasiveness of a tumor cell population in our model.
Keywords: actin; cell mechanics; cytoskeleton; glioblastoma; phalloidin; radiation; slice cultures.
Conflict of interest statement
The authors declare no conflict of interest.
Figures
Similar articles
-
On the influence of cannabinoids on cell morphology and motility of glioblastoma cells.PLoS One. 2019 Feb 12;14(2):e0212037. doi: 10.1371/journal.pone.0212037. eCollection 2019. PLoS One. 2019. PMID: 30753211 Free PMC article.
-
Migration pattern, actin cytoskeleton organization and response to PI3K-, mTOR-, and Hsp90-inhibition of glioblastoma cells with different invasive capacities.Oncotarget. 2017 Jul 11;8(28):45298-45310. doi: 10.18632/oncotarget.16847. Oncotarget. 2017. PMID: 28424411 Free PMC article.
-
Arginine deprivation affects glioblastoma cell adhesion, invasiveness and actin cytoskeleton organization by impairment of β-actin arginylation.Amino Acids. 2015 Jan;47(1):199-212. doi: 10.1007/s00726-014-1857-1. Epub 2014 Nov 2. Amino Acids. 2015. PMID: 25362567 Free PMC article.
-
X-ray radiation promotes the metastatic potential of tongue squamous cell carcinoma cells via modulation of biomechanical and cytoskeletal properties.Hum Exp Toxicol. 2015 Sep;34(9):894-903. doi: 10.1177/0960327114561664. Epub 2015 Jan 13. Hum Exp Toxicol. 2015. PMID: 25586002
-
CRN2 enhances the invasiveness of glioblastoma cells.Neuro Oncol. 2013 May;15(5):548-61. doi: 10.1093/neuonc/nos388. Epub 2013 Feb 14. Neuro Oncol. 2013. PMID: 23410663 Free PMC article.
Cited by
-
Evaluation of machine learning models for automatic detection of DNA double strand breaks after irradiation using a γH2AX foci assay.PLoS One. 2020 Feb 26;15(2):e0229620. doi: 10.1371/journal.pone.0229620. eCollection 2020. PLoS One. 2020. PMID: 32101565 Free PMC article.
-
Exploring the heterogeneity in glioblastoma cellular mechanics using in-vitro assays and atomic force microscopy.Sci Rep. 2025 Jun 2;15(1):19302. doi: 10.1038/s41598-025-04841-4. Sci Rep. 2025. PMID: 40456830 Free PMC article.
-
Cytoskeleton Response to Ionizing Radiation: A Brief Review on Adhesion and Migration Effects.Biomedicines. 2021 Aug 28;9(9):1102. doi: 10.3390/biomedicines9091102. Biomedicines. 2021. PMID: 34572287 Free PMC article. Review.
-
Role of the mechanical microenvironment on CD-44 expression of breast adenocarcinoma in response to radiotherapy.Sci Rep. 2024 Jan 3;14(1):391. doi: 10.1038/s41598-023-50473-x. Sci Rep. 2024. PMID: 38172135 Free PMC article.
-
On the influence of cannabinoids on cell morphology and motility of glioblastoma cells.PLoS One. 2019 Feb 12;14(2):e0212037. doi: 10.1371/journal.pone.0212037. eCollection 2019. PLoS One. 2019. PMID: 30753211 Free PMC article.
References
-
- Walker M.D., Green S.B., Byar D.P., Alexander E., Batzdorf U., Brooks W.H., Hunt W.E., MacCarty C.S., Mahaley M.S., Mealey J., et al. Randomized Comparisons of Radiotherapy and Nitrosoureas for the Treatment of Malignant Glioma after Surgery. N. Engl. J. Med. 1980;303:1323–1329. doi: 10.1056/NEJM198012043032303. - DOI - PubMed
-
- Walker M.D., Alexander E., Hunt W.E., MacCarty C.S., Mahaley M.S., Mealey J., Norrell H.A., Owens G., Ransohoff J., Wilson C.B., et al. Evaluation of BCNU and/or radiotherapy in the treatment of anaplastic gliomas: A cooperative clinical trial. J. Neurosurg. 1978;49:333–343. doi: 10.3171/jns.1978.49.3.0333. - DOI - PubMed
-
- Davis F.G., McCarthy B.J., Freels S., Kupelian V., Bondy M.L. The conditional probability of survival of patients with primary malignant brain tumors: Surveillance, epidemiology, and end results (SEER) data. Cancer. 1999;85:485–491. doi: 10.1002/(SICI)1097-0142(19990115)85:2<485::AID-CNCR29>3.0.CO;2-L. - DOI - PubMed
MeSH terms
Substances
LinkOut - more resources
Full Text Sources
Other Literature Sources
Medical
