. 2017 Sep 19;15(1):86.
doi: 10.1186/s12915-017-0419-x.

Genome sequencing of the staple food crop white Guinea yam enables the development of a molecular marker for sex determination

Affiliations

Genome sequencing of the staple food crop white Guinea yam enables the development of a molecular marker for sex determination

Muluneh Tamiru et al. BMC Biol. .

Abstract

Background: Root and tuber crops are a major food source in tropical Africa. Among these crops are several species in the monocotyledonous genus Dioscorea collectively known as yam, a staple tuber crop that contributes enormously to the subsistence and socio-cultural lives of millions of people, principally in West and Central Africa. Yam cultivation is constrained by several factors, and yam can be considered a neglected "orphan" crop that would benefit from crop improvement efforts. However, the lack of genetic and genomic tools has impeded the improvement of this staple crop.

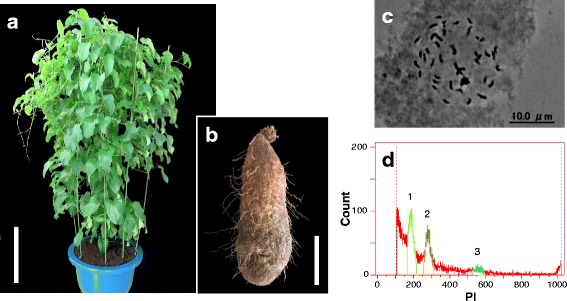
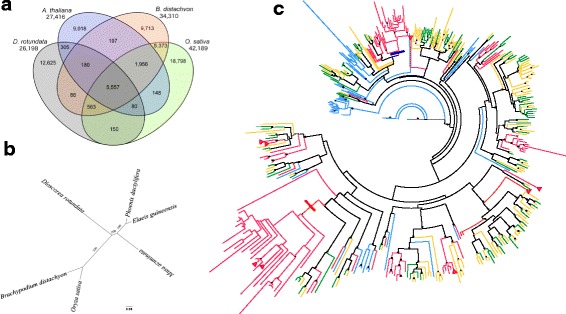
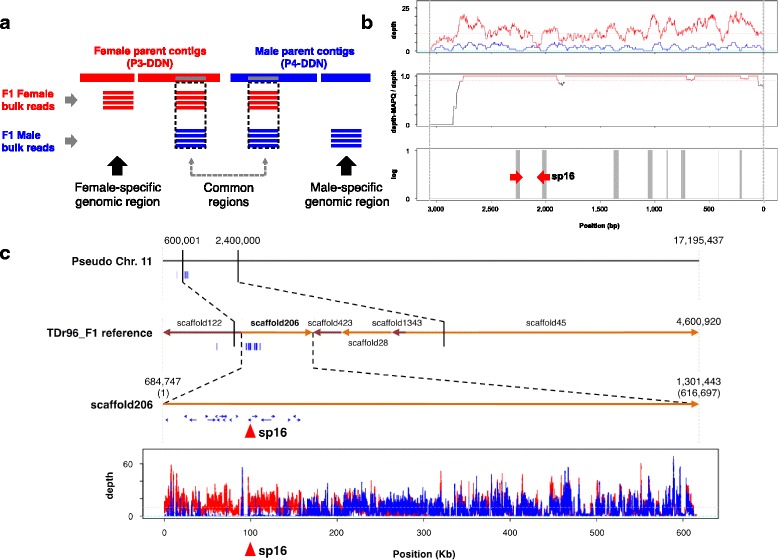
Results: To accelerate marker-assisted breeding of yam, we performed genome analysis of white Guinea yam (Dioscorea rotundata) and assembled a 594-Mb genome, 76.4% of which was distributed among 21 linkage groups. In total, we predicted 26,198 genes. Phylogenetic analyses with 2381 conserved genes revealed that Dioscorea is a unique lineage of monocotyledons distinct from the Poales (rice), Arecales (palm), and Zingiberales (banana). The entire Dioscorea genus is characterized by the occurrence of separate male and female plants (dioecy), a feature that has limited efficient yam breeding. To infer the genetics of sex determination, we performed whole-genome resequencing of bulked segregants (quantitative trait locus sequencing [QTL-seq]) in F1 progeny segregating for male and female plants and identified a genomic region associated with female heterogametic (male = ZZ, female = ZW) sex determination. We further delineated the W locus and used it to develop a molecular marker for sex identification of Guinea yam plants at the seedling stage.

Conclusions: Guinea yam belongs to a unique and highly differentiated clade of monocotyledons. The genome analyses and sex-linked marker development performed in this study should greatly accelerate marker-assisted breeding of Guinea yam. In addition, our QTL-seq approach can be utilized in genetic studies of other outcrossing crops and organisms with highly heterozygous genomes. Genomic analysis of orphan crops such as yam promotes efforts to improve food security and the sustainability of tropical agriculture.

Keywords: Dioecy; Dioscorea; Sex determination; Whole-genome sequence; Yam.


Conflict of interest statement

Ethics approval and consent to participate

Not applicable.

Consent for publication

Not applicable.

Competing interests

The authors declare that they have no competing interests.

Publisher’s Note

Springer Nature remains neutral with regard to jurisdictional claims in published maps and institutional affiliations.

Figures

Fig. 1
Fig. 1
Determination of ploidy level and genome size in Dioscorea rotundata plant TDr96_F1. a TDr96_F1 plant grown in a greenhouse at Iwate Biotechnology Research Center (IBRC), Japan. Bar = 50 cm. b TDr96_F1 tuber. Bar = 10 cm. c Diploid somatic chromosomes at metaphase stage obtained from TDr96_F1 root tips (2n = 2× = 40). d FCM histogram of propidium iodide (PI)-stained nuclei from D. rotundata (TDr96_F1) and rice (Oryza sativa L.). Rice (genome size = 380 Mb) served as an internal reference standard. 1 = G1 (O. sativa), 2 = G1 (D. rotundata), and 3 = G2 (D. rotundata), where G1 and G2 represent the Gap 1 and Gap 2 phases of the cell cycle, respectively
Fig. 2
Fig. 2
Integrated genetic and physical map of D. rotundata. Approximately 76.4% of D. rotundata scaffold sequences were anchored using a RAD-based genetic map generated with 150 F1 individuals obtained from a cross between TDr97/00917 (P1, female) and TDr99/02627 (P2, male). The 21 chromosome-scale pseudo-molecules are numbered from 1 to 21. Markers are located according to genetic distance (cM). Black lines represent the 21 P1 and P2 linkage groups (LGs), and scaffolds anchored to P1 and P2 LGs are shown in red and blue, respectively. Scaffolds shared between the P1 and P2 LGs are shown in green. Numbers and arrows indicate scaffolds and their orientation, respectively
Fig. 3
Fig. 3
Comparative genomics of Dioscorea rotundata and other angiosperm species. a Venn diagram showing conserved and unique genes at 1:1 correspondence among D. rotundata, Arabidopsis thaliana, Brachypodium distachyon, and Oryza sativa. Total gene counts in each genome are given below the species name. b Maximum likelihood tree of D. rotundata, B. distachyon, O. sativa, Elaeis guineensis, Musa acuminata, and Phoenix dactylifera based on 2381 orthologous protein-coding genes. The bootstrap values across 1000 resamplings are shown. The scale bar represents the mean number of substitutions per site. c Phylogenetic analysis of the relationships of mannose-specific bulb-type lectin proteins in D. rotundata (red), A. thaliana (blue), B. distachyon (green), and O. sativa (orange). Arrowheads represent bulb-type lectins observed to have enriched expression in tubers. High confidence bootstrap values (1000 replicates) are represented at the nodes of the tree as dots. Thick red and blue lines show two root branches of D. rotundata-specific expanded genes
Fig. 4
Fig. 4
QTL-seq-based analysis of sex determination in D. rotundata. a Male and female inflorescences of D. rotundata. Bars = 10 mm. b SNP-index and ∆SNP-index plots generated for pseudo-chromosome 11 (see Fig. 2). DNA samples from 50 male and 50 female F1 individuals were pooled to prepare the male and female bulks, respectively. Green, yellow, and blue dots represent SNP-index values at all SNP positions, and red lines denote the sliding window average SNP-index values at 1-Mb intervals with 50-kb increments. Horizontal brown lines in the ∆SNP-index plot represent the 95% confidence limit. The candidate genomic region presumably associated with sex determination is indicated by a pink background. c Schematic diagram showing the possible genotypes of female (P3, TDr97/00917) and male (P4, TDr97/00777) parents as well as their F1 progeny segregating for female and male. Genotypes of sex-determination locus are indicated as ZW or ZZ. The position of the cleaved amplified polymorphic sequence (CAPS) marker, sp1, is indicated by a dashed line. Sister chromatids are indicated by numbers
Fig. 5
Fig. 5
A CAPS marker developed on pseudo-chromosome 11 co-segregates with sex in F1 progeny derived from a cross between female (P3) and male (P4) parents. a Agarose gel electrophoresis of the CAPS marker, sp1, for the parents and F1 progeny segregating for male and female phenotypes. This marker segregates for a non-cleaved band (854 bp) indicated as (A) and cleaved bands (425 bp + 428 bp) indicated as (B). b Frequency of the sp1 genotypes (A/B or A/A) among the F1 progeny segregating for male (50 plants) and female (50 plants). There is a statistically significant association between A/B sp1 genotype and male and between A/A sp1 genotype and female (Fisher’s exact test: P = 1.913e-14)
Fig. 6
Fig. 6
Identification of female-specific putative W-linked genomic region. a Schematic diagram of the method used to identify the female-specific putative W-linked genomic region. De novo assembled genome sequences of female (P3-DDN) and male (P4-DDN) parents were combined to serve as a reference sequence. Short reads of bulked DNA from F1 female and F1 male progeny were separately mapped onto this combined reference sequence. The majority of reads mapped to two duplicated homologous locations in the reference genome (indicated as “common regions”), which gave low MAPQ scores (<60) in the BWA alignment. Female parental contigs that were mapped only with reads belonging to the F1 female bulk corresponded to female-specific genomic regions. Sequence reads mapped to such positions were identified by their high MAPQ scores (=60). b An example of a female-specific contig (contig Female917_flattened_line_87512_3057). Alignment depths of F1 female bulk (red) and F1 male bulk (blue) are shown (top). Frequency of reads mapped with MAPQ score = 60. The red line corresponds to genomic regions that were covered by short reads, > 90% of which had a MAPQ score of 60 (middle). A genomic region that is covered only by female reads (not by male reads) and > 90% of mapped reads had MAPQ score = 60 (indicated by gray bars) (bottom). Red arrowheads indicate the positions of PCR primers for the DNA marker sp16. c Location of the female-specific genomic region. Thick gray horizontal line denotes pseudo-chromosome 11 (top), scaffolds on chromosome 11 (middle), and scaffold206 (bottom). The thin blue lines shown under the first, second, and third horizontal lines indicate the positions of female contigs (P3-DDN) specifically mapped by F1 female bulk reads. The square box at the bottom indicates alignment depth of reads of F1 female bulk (red) and F1 bulk of progeny in which sp16 amplification was not observed (sp16-minus) (blue) to scaffold206. Red triangles indicate the position of DNA marker sp16
Fig. 7
Fig. 7
DNA marker sp16 is located in a W-linked region. a Results of agarose gel electrophoresis of PCR products amplified by DNA marker sp16 (sp16). Actin from D. rotundata (Dr-Actin) served as a control to show that template DNA was present for all samples. NF non-flowering. b Bar graphs showing the correspondence of sp16 genotypes (sp16 PCR product Amplified or Not amplified) with the sex of F1 progeny derived from a cross between P3 and P4 and phenotyped over 2 years (2014 and 2015). Color codes indicate sex manifestation of the plants during the 2-year period, disregarding the yearly order (i.e., plants showing sex changes from male [2014] to female [2015] and female [2014] to male [2015] were combined and are indicated by ♀/♂). Monoecy is indicated by (♀/♂). NF non-flowering. c The same as b but for F1 progeny obtained from a separate cross involving TDr04-219 and P4
Fig. 8
Fig. 8
Test of correspondence between sp16 genotypes and sex in 24 D. rotundata breeding accessions. Results of agarose gel electrophoresis of PCR products amplified using sp16 DNA markers are shown. Dr-Actin is a control indicating the presence of template DNA for all lines. NF non-flowering

References

    1. Wilkin P, Scholsb P, Chasea MW, Chayamaritc K, Furnessa CA, Huysmansb S, Rakotonasolod F, et al. A plastid gene phylogeny of the yam genus, Dioscorea: roots, fruits and Madagascar. Syst Bot. 2005;30:736–49. doi: 10.1600/036364405775097879. - DOI
    1. Renner SS. The relative and absolute frequencies of angiosperm sexual systems: dioecy, monoecy, gynodioecy, and an updated online database. Am J Bot. 2014;101:1588–96. doi: 10.3732/ajb.1400196. - DOI - PubMed
    1. Maurin O, Muasya M, Catalan P, Shongwe EZ, Viruel J, Wilkin P, van der Bank M. Diversification into novel habitats in the Africa clade of Dioscorea (Dioscoreaceae): erect habit and elephant’s foot tubers. BMC Evol Biol. 2016;16:238. doi: 10.1186/s12862-016-0812-z. - DOI - PMC - PubMed
    1. Lebot V. Tropical root and tuber crops: cassava, sweet potato, yams and aroids (Crop Production Science in Horticulture Series 17) Wallingford: CABI Publishing; 2009. p. 405.
    1. Coursey DG. The civilizations of the yam: interrelationships of man and yams in Africa and the Indo-Pacific region. Archeol Phys Anthropol Oceania. 1972;7:215–33.

Publication types