. 2017 Sep 19;8(1):196.
doi: 10.1186/s13287-017-0645-8.

Generation of special autosomal dominant polycystic kidney disease iPSCs with the capability of functional kidney-like cell differentiation

Affiliations

Generation of special autosomal dominant polycystic kidney disease iPSCs with the capability of functional kidney-like cell differentiation

Jiahui Huang et al. Stem Cell Res Ther. .

Abstract

Background: Human induced pluripotent stem cells (iPSCs) have been verified as a powerful cell model for the study of pathogenesis in hereditary disease. Autosomal dominant polycystic kidney disease (ADPKD) is caused by mutations of PKD or non-PKD genes. The pathogenesis of ADPKD remains unexplored because of the lack of a true human cell model.

Methods: Six ADPKD patients and four healthy individuals were recruited as donors of somatic cells from a Chinese ADPKD family without mutations of the PKD genes but carrying SAMSN1 gene deletion. The ADPKD-iPSCs were generated from somatic cells and were induced into kidney-like cells (KLCs) by a novel three-step method involving cytokines and renal epithelium growth medium. Furthermore, we analyzed functional properties of these KLCs by water transportation and albumin absorption assays.

Results: We successfully generated iPSCs from ADPKD patients and differentiated them into KLCs that showed morphological and functional characteristics of human kidney cells. Further, we also found that ADPKD-iPSC-KLCs had a significantly higher rate of apoptosis and a significantly lower capacity for water transportation and albumin absorption compared to healthy sibling-derived differentiated KLCs. Furthermore, knockdown of SAMSN1 in control iPSCs may attenuate differentiation and/or function of KLCs.

Conclusions: These data show that we have created the first iPSCs established from ADPKD patients without mutations in the PKD genes, and suggest that the deletion mutation of SAMSN1 might be involved in the differentiation and/or function of KLCs. ADPKD-iPSC-KLCs can be used as a versatile model system for the study of kidney disease.

Keywords: Autosomal-dominant polycystic kidney disease; Differentiation; Induced pluripotent stem cells; Kidney cells; SAMSN1.


Conflict of interest statement

Ethics approval and consent to participate

All procedures of experiments were approved by the Ethics Committee of Nanchang University Affiliated first Hospital (Additional file 4: Ethical approval). Written informed consent was obtained from all donors.

Consent for publication

Not applicable.

Competing interests

The authors declare that they have no competing interests.

Publisher’s Note

Springer Nature remains neutral with regard to jurisdictional claims in published maps and institutional affiliations.

Figures

Fig. 1
Fig. 1
Genotyping of the special ADPKD family in this study. (a) Family pedigree. *Members with a missense mutation c.17G > A, p. Arg6His in PKD2. (b) Diagnostic ultrasonogram of the representative affected person (TSB) and normal person (TSG). (c) Upstream deletions of the ASTN1 and SAMSN1 genes identified in patient TSB by comparative genomic hybridization microarray technology. (d) List of all 11 CNVs in the genomes of TSB cells compared to TSG cells. (e) qPCR analysis of the ASTN1 gene expression in ADPKD patients and healthy persons. Data presented as mean ± standard deviation from three independent sets of experiments. (f) qPCR analysis of SAMSN1 expression in ADPKD patients and healthy persons. Data presented as mean ± standard deviation from three independent sets of experiments. *P < 0.05. ADPKD autosomal dominant polycystic kidney disease, TTB, TSB, THB, TLL, TII, TXM, TSG, TLY, LTP, TDS names of family members (Color figure online)
Fig. 2
Fig. 2
Generation and characterization of ADPKD-iPSCs. (a) Immunofluorescence staining and FCM analysis of ADPKD-iPSC colonies. Expression of iPSC specific proteins (OCT4, SSEA4, TRA-1-60 and TRA-1-81) (first column) with corresponding DAPI-stained nuclei (second column) and merged images (third column). These cells were also analyzed by FCM and positive rates were tested. Bar = 50 μm. (b) Semi-quantitative PCR results showing that expressions of exogenous genes were overregulated in iPSCs after day 6 during programming. (c) qPCR showing that expressions of exogenous genes in iPSCs were silent after day 19 during programming. Data presented as mean ± standard deviation from three independent sets of experiments. **P < 0.01. (d) qPCR results showing upregulated expression of endogenous iPSC specific genes in healthy or ADPKD-iPSCs. Human embryonic stem cells (H1 ESCs) acted as a positive control. Data presented as mean ± standard deviation from three independent sets of experiments. **P < 0.01. (e) ADPKD specific iPSC colonies showing a normal 46XY karyotype. (f) Methylation status of eight CpGs analyzed (one per row) in the promoter region of both OCT4 and NANOG genes from twelve or eight randomly sequenced clones represented as 8 × 12 and 8 × 8 matrices, respectively, for both iPSCs and human fibroblast cells (HFCs). Open circles indicate the unmethylated state and dark, filled circles indicate the methylated state, which overall indicated that the loci tested are highly methylated in HFCs, while they have been reprogrammed to the unmethylated state in the iPSC colonies. (g) Genomic fingerprint analysis of TSG and TSB in both iPSCs and their corresponding HFCs. ADPKD autosomal dominant polycystic kidney disease, ESC embryonic stem cell, iPSC induced pluripotent stem cell, TSB, TSG names of family members (Color figure online)
Fig. 3
Fig. 3
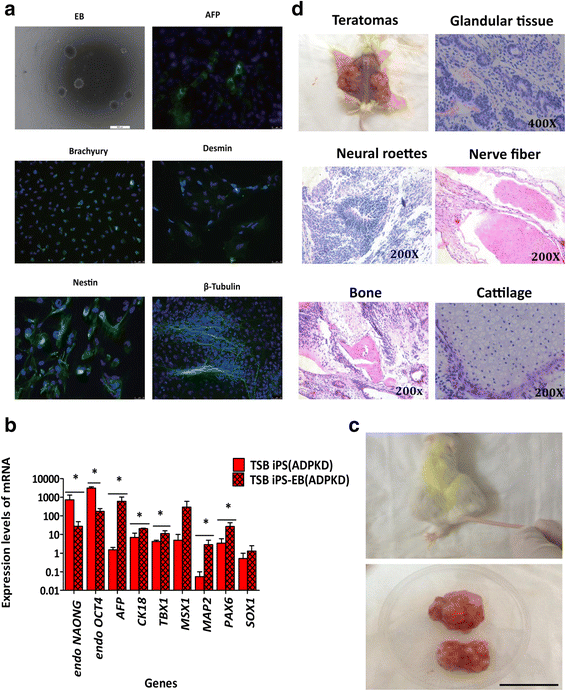
In-vitro and in-vivo differentiation of ADPKD-iPSCs. (a) Embryoid body (EB) formation by ADPKD-specific iPSCs in suspension culture. Differentiated EBs expressed markers from all three germ layers, including α-fetoprotein (AFP; endoderm, bar = 25 μm), Nestin and Desmin (mesoderm), Brachyury: BRY and βIII-tubulin (ectoderm). Bar = 50 μm. (b) qPCR analysis showing differences in gene expression patterns between undifferentiated iPSCs and differentiated EBs. Undifferentiated iPSCs expressed high levels of endogenous OCT4 and NANOG genes while EBs expressed high levels of marker genes of all three layers. Data presented as mean ± standard deviation from three independent sets of experiments. *P < 0.05. (c) Teratomas evident following the injection of undifferentiated ADPKD-specific iPSCs into immunodeficient mice. Bar = 1 cm. (d) Hematoxylin and eosin staining of tissues from all three germ layers. Bar = 1 cm. ADPKD autosomal dominant polycystic kidney disease, iPS induced pluripotent stem cell, TSB name of family member (Color figure online)
Fig. 4
Fig. 4
Direct differentiation of ADPKD-iPSCs into kidney-like cells (KLCs). (a) Scheme showing the stepwise protocol used for producing KLCs from ADPKD-iPSCs and the time needed. (b) Morphology of induced ADPKD-iPSCs is similar to podocytes and human kidney (HK2) cells. Bar = 100 μm. (c) Upregulation of marker genes of each stage during differentiation from iPSCs into functional KLCs. Values (mean of three replicates) are referred to the undifferentiated iPSCs. Data presented as mean ± standard deviation from three independent sets of experiments, *P < 0.05, **P < 0.01. (b) Pluripotency of iPSCs decreased during induction to KLCs. Data are averages and standard deviations of three independent experiments. Values (mean of three replicates) are referred to the undifferentiated iPSCs. **P < 0.01. (e) Immunofluorescence and FCM results of marker genes of each step of induction. BRY is a marker of mesoderm cells; PAX2 a marker for intermesoderm cells; and synaptopodin, AQP1, and E-cadherin (E-CAD) are markers for KLCs. Bar = 50 μm. iPSC induced pluripotent stem cell, RA retinoic acid, REGM renal epithelium growth medium, ABVF Activin-A, BMP7, hVEGF and bFGF
Fig. 5
Fig. 5
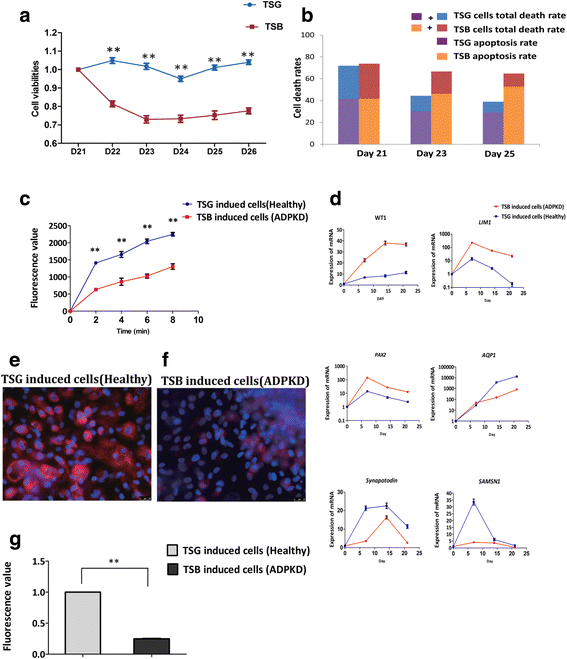
Differentiated iPSCs from an ADPKD patient and a healthy individual express different phenotypes. (a) Cell viabilities of TSG and TSB iPSCs tested by CCK-8 assays over the period from day 21 to day 28. Data presented as mean ± standard deviation from three independent sets of experiments, **P < 0.01. (b) Apoptosis rates of TSG and TSB iPSCs tested by Annexin V-FITC/PI staining over the period from day 21 to day 25. Data are averages of three independent experiments. (c) Water transportation assays carried out using induced TSG and TSB iPSCs. Data presented as mean ± standard deviation from three independent sets of experiments, **P < 0.01. (d) Marker genes of TSG and TSB iPSCs during the entire process of differentiating iPSCs to functional KLCs. Data presented as mean ± standard deviation from three independent sets of experiments. (eg) BSA absorption assays of TSG and TSB KLCs derived from iPSCs. Bar = 25 μm. Data presented as mean ± standard deviation from three independent sets of experiments, **P < 0.01. ADPKD autosomal dominant polycystic kidney disease, TSB, TSG names of family members (Color figure online)
Fig. 6
Fig. 6
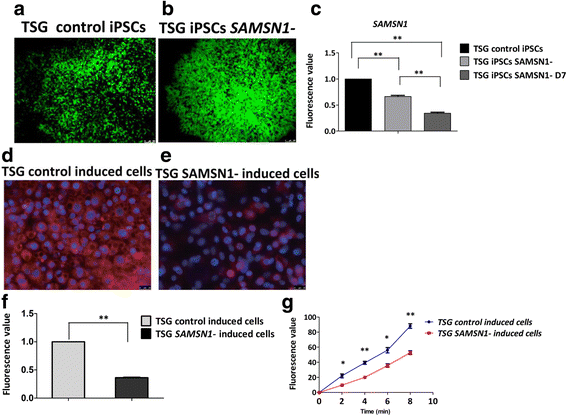
Knockdown of SAMSN1 may attenuate differentiation and/or function of KLCs in ADPKD. (ac) Morphology of TSG control induced cells and TSG SAMSN1-induced iPSCs and the relative expression rates of SAMSN1 in TSG SAMSN1-induced iPSCs compared to those in TSG control-induced cells. Bar = 100 μm. Data presented as mean ± standard deviation from three independent sets of experiments, **P < 0.01. (df) BSA absorption assays of TSG control-induced cells and TSG SAMSN1-induced iPSCs. Bar = 25 μm. Data presented as mean ± standard deviation from three independent sets of experiments, **P < 0.01. (g) Results of water transportation assays of TSG control-induced cells and TSG SAMSN1-induced iPSCs. Data presented as mean ± standard deviation from three independent sets of experiments, *P < 0.05, **P < 0.01. ADPKD autosomal dominant polycystic kidney disease, iPSC induced pluripotent stem cell, TSG name of family member (Color figure online)

Similar articles

Cited by

References

    1. Takahashi K, Yamanaka S. Induction of pluripotent stem cells from mouse embryonic and adult fibroblast cultures by defined factors. Cell. 2006;126(4):663–76. doi: 10.1016/j.cell.2006.07.024. - DOI - PubMed
    1. Takahashi K, Tanabe K, Ohnuki M, Narita M, Ichisaka T, Tomoda K, et al. Induction of pluripotent stem cells from adult human fibroblasts by defined factors. Cell. 2007;131(5):861–72. doi: 10.1016/j.cell.2007.11.019. - DOI - PubMed
    1. Yu J, Vodyanik MA, Smuga-Otto K, Antosiewicz-Bourget J, Frane JL, Tian S, et al. Induced pluripotent stem cell lines derived from human somatic cells. Science. 2007;318(5858):1917–20. doi: 10.1126/science.1151526. - DOI - PubMed
    1. Walker FO. Huntington's disease. Lancet. 2007;369(9557):218–28. doi: 10.1016/S0140-6736(07)60111-1. - DOI - PubMed
    1. Carvajal-Vergara X, Sevilla A, D’Souza SL, Ang Y-S, Schaniel C, Lee D-F, et al. Patient-specific induced pluripotent stem-cell-derived models of LEOPARD syndrome. Nature. 2010;465(7299):808–12. doi: 10.1038/nature09005. - DOI - PMC - PubMed

Publication types

MeSH terms

LinkOut - more resources