

Associations among dietary non-fiber carbohydrate, ruminal microbiota and epithelium G-protein-coupled receptor, and histone deacetylase regulations in goats
- PMID: 28927467
- PMCID: PMC5606034
- DOI: 10.1186/s40168-017-0341-z
Associations among dietary non-fiber carbohydrate, ruminal microbiota and epithelium G-protein-coupled receptor, and histone deacetylase regulations in goats
Abstract
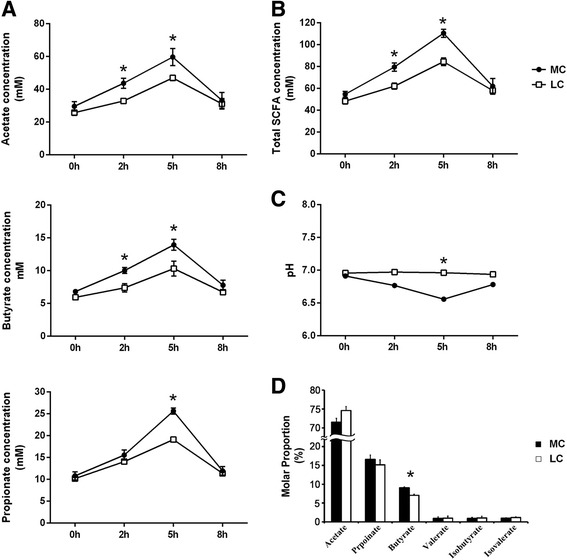
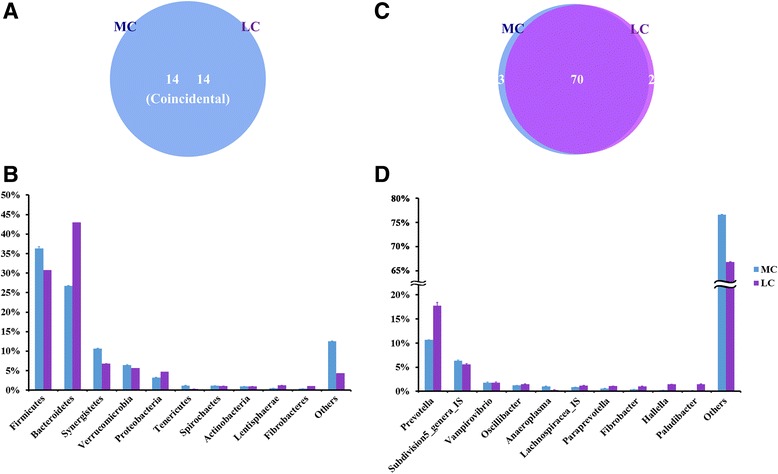
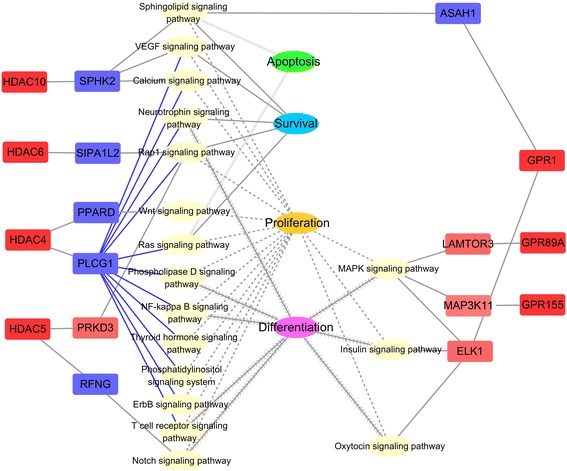
Background: Diet-derived short-chain fatty acids (SCFAs) in the rumen have broad effects on the health and growth of ruminants. The microbe-G-protein-coupled receptor (GPR) and microbe-histone deacetylase (HDAC) axes might be the major pathway mediating these effects. Here, an integrated approach of transcriptome sequencing and 16S rRNA gene sequencing was applied to investigate the synergetic responses of rumen epithelium and rumen microbiota to the increased intake of dietary non-fiber carbohydrate (NFC) from 15 to 30% in the goat model. In addition to the analysis of the microbial composition and identification of the genes and signaling pathways related to the differentially expressed GPRs and HDACs, the combined data including the expression of HDACs and GPRs, the relative abundance of the bacteria, and the molar proportions of the individual SCFAs were used to identify the significant co-variation of the SCFAs, clades, and transcripts.
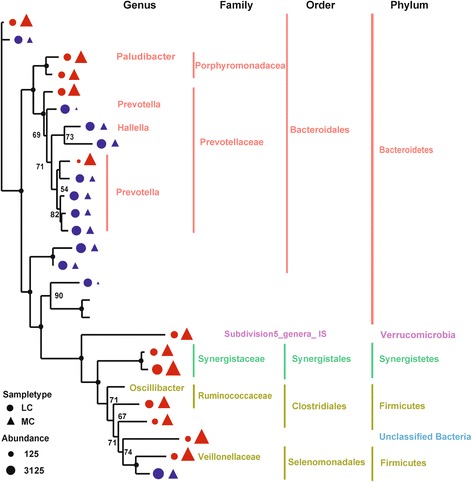
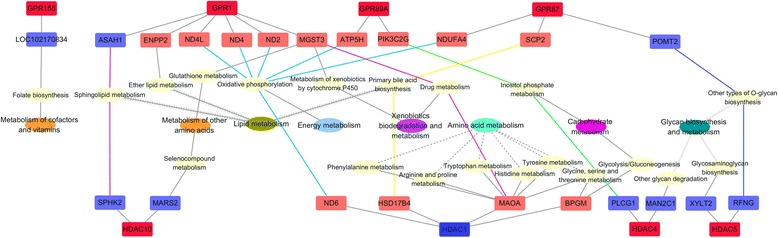
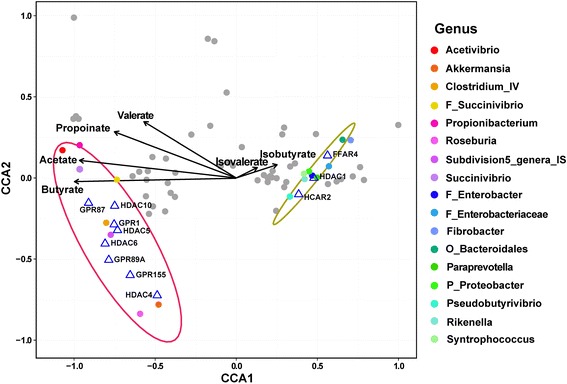
Results: The major bacterial clades promoted by the 30% NFC diet were related to lactate metabolism and cellulose degradation in the rumen. The predominant functions of the GPR and HDAC regulation network, under the 30% NFC diet, were related to the maintenance of epithelium integrity and the promotion of animal growth. In addition, the molar proportion of butyrate was inversely correlated with the expression of HDAC1, and the relative abundance of the bacteria belonging to Clostridum_IV was positively correlated with the expression of GPR1.
Conclusions: This study revealed that the effects of rumen microbiota-derived SCFA on epithelium growth and metabolism were mediated by the GPR and HDAC regulation network. An understanding of these mechanisms and their relationships to dietary components provides better insights into the modulation of ruminal fermentation and metabolism in the promotion of livestock production.
Keywords: Dietary modulation; Epithelium physiology; G-protein-coupled receptors; Histone deacetylases; Microbe–host interactions; Rumen microbiota.
Conflict of interest statement
Ethics approval
This study was approved by the Animal Care and Use Committee of Nanjing Agricultural University, in compliance with the Regulations for the Administration of Affairs Concerning Experimental Animals (approved by the State Council of China on October 31, 1988, and promulgated by Decree No. 2 of the State Science and Technology Commission on November 14, 1988.) [13].
Consent for publication
Not applicable.
Competing interests
The authors declare that they have no competing interests.
Publisher’s Note
Springer Nature remains neutral with regard to jurisdictional claims in published maps and institutional affiliations.
Figures
Similar articles
-
Ruminal Microbiota Determines the High-Fiber Utilization of Ruminants: Evidence from the Ruminal Microbiota Transplant.Microbiol Spectr. 2022 Aug 31;10(4):e0044622. doi: 10.1128/spectrum.00446-22. Epub 2022 Aug 4. Microbiol Spectr. 2022. PMID: 35924933 Free PMC article.
-
Ruminal microbiome-host crosstalk stimulates the development of the ruminal epithelium in a lamb model.Microbiome. 2019 Jun 3;7(1):83. doi: 10.1186/s40168-019-0701-y. Microbiome. 2019. PMID: 31159860 Free PMC article.
-
Rumen microbial abundance and fermentation profile during severe subacute ruminal acidosis and its modulation by plant derived alkaloids in vitro.Anaerobe. 2016 Jun;39:4-13. doi: 10.1016/j.anaerobe.2016.02.002. Epub 2016 Feb 8. Anaerobe. 2016. PMID: 26868619
-
Dietary gut microbial metabolites, short-chain fatty acids, and host metabolic regulation.Nutrients. 2015 Apr 14;7(4):2839-49. doi: 10.3390/nu7042839. Nutrients. 2015. PMID: 25875123 Free PMC article. Review.
-
Invited review: Plant polyphenols and rumen microbiota responsible for fatty acid biohydrogenation, fiber digestion, and methane emission: Experimental evidence and methodological approaches.J Dairy Sci. 2019 May;102(5):3781-3804. doi: 10.3168/jds.2018-14985. Epub 2019 Mar 21. J Dairy Sci. 2019. PMID: 30904293 Review.
Cited by
-
The early life immune dynamics and cellular drivers at single-cell resolution in lamb forestomachs and abomasum.J Anim Sci Biotechnol. 2023 Oct 12;14(1):130. doi: 10.1186/s40104-023-00933-1. J Anim Sci Biotechnol. 2023. PMID: 37821933 Free PMC article.
-
Synchrony Degree of Dietary Energy and Nitrogen Release Influences Microbial Community, Fermentation, and Protein Synthesis in a Rumen Simulation System.Microorganisms. 2020 Feb 9;8(2):231. doi: 10.3390/microorganisms8020231. Microorganisms. 2020. PMID: 32050406 Free PMC article.
-
Effects of Concentrate Supplementation on Growth Performance, Rumen Fermentation, and Bacterial Community Composition in Grazing Yaks during the Warm Season.Animals (Basel). 2022 May 29;12(11):1398. doi: 10.3390/ani12111398. Animals (Basel). 2022. PMID: 35681862 Free PMC article.
-
Chemical Composition of Milk and Rumen Microbiome Diversity of Yak, Impacting by Herbage Grown at Different Phenological Periods on the Qinghai-Tibet Plateau.Animals (Basel). 2020 Jun 13;10(6):1030. doi: 10.3390/ani10061030. Animals (Basel). 2020. PMID: 32545764 Free PMC article.
-
Perilla frutescens Leaf Alters the Rumen Microbial Community of Lactating Dairy Cows.Microorganisms. 2019 Nov 13;7(11):562. doi: 10.3390/microorganisms7110562. Microorganisms. 2019. PMID: 31766265 Free PMC article.
References
-
- Bergman EN. Energy contributions of volatile fatty acids from the gastrointestinal tract in various species. Physiol Rev. 1990;70:567–590. - PubMed
-
- Lu Z, Gui H, Yao L, Yan L, Martens H, Aschenbach JR, Shen Z. Short-chain fatty acids and acidic pH upregulate UT-B, GPR41, and GPR4 in rumen epithelial cells of goats. Am J Phys Regul Integr Comp Phys. 2015;308:R283–R293. - PubMed
Publication types
MeSH terms
Substances
LinkOut - more resources
Full Text Sources
Other Literature Sources
Medical
Miscellaneous
