. 2017 Dec;28(12):3563-3578.
doi: 10.1681/ASN.2016090960. Epub 2017 Sep 19.

Endothelial Epas1 Deficiency Is Sufficient To Promote Parietal Epithelial Cell Activation and FSGS in Experimental Hypertension

Affiliations

Endothelial Epas1 Deficiency Is Sufficient To Promote Parietal Epithelial Cell Activation and FSGS in Experimental Hypertension

Yosu Luque et al. J Am Soc Nephrol. 2017 Dec.

Abstract

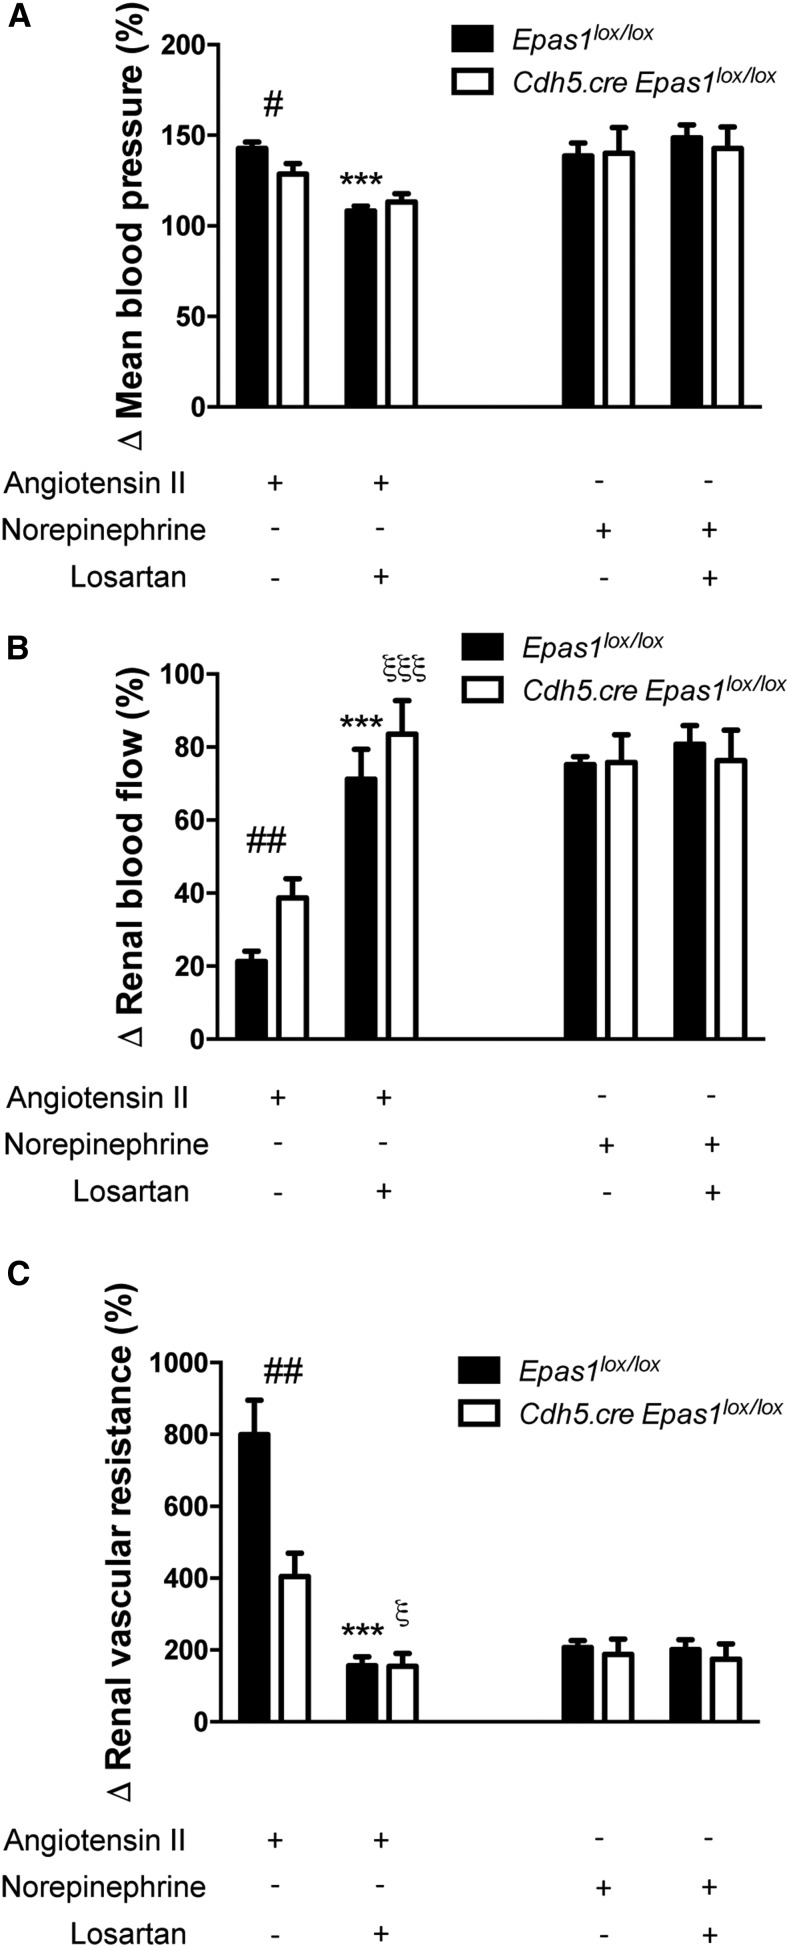
FSGS, the most common primary glomerular disorder causing ESRD, is a complex disease that is only partially understood. Progressive sclerosis is a hallmark of FSGS, and genetic tracing studies have shown that parietal epithelial cells participate in the formation of sclerotic lesions. The loss of podocytes triggers a focal activation of parietal epithelial cells, which subsequently form cellular adhesions with the capillary tuft. However, in the absence of intrinsic podocyte alterations, the origin of the pathogenic signal that triggers parietal epithelial cell recruitment remains elusive. In this study, investigation of the role of the endothelial PAS domain-containing protein 1 (EPAS1), a regulatory α subunit of the hypoxia-inducible factor complex, during angiotensin II-induced hypertensive nephropathy provided novel insights into FSGS pathogenesis in the absence of a primary podocyte abnormality. We infused angiotensin II into endothelial-selective Epas1 knockout mice and their littermate controls. Although the groups presented with identical high BP, endothelial-specific Epas1 gene deletion accentuated albuminuria with severe podocyte lesions and recruitment of pathogenic parietal glomerular epithelial cells. These lesions and dysfunction of the glomerular filtration barrier were associated with FSGS in endothelial Epas1-deficient mice only. These results indicate that endothelial EPAS1 has a global protective role during glomerular hypertensive injuries without influencing the hypertensive effect of angiotensin II. Furthermore, these findings provide proof of principle that endothelial-derived signaling can trigger FSGS and illustrate the potential importance of the EPAS1 endothelial transcription factor in secondary FSGS.

Keywords: Pathophysiology of Renal Disease and Progression; endothelial cells; focal segmental glomerulosclerosis; glomerular endothelial cells; glomerular epithelial cells; hypertension.


Figures

Figure 1.
Figure 1.
Generation of mice with a selective endothelial EPAS1 deficiency. (A) Schematic representation of the generation of mice with EPAS1-deficient endothelial cells obtained by mating mice expressing the CRE recombinase under the VE-cadherin promoter (Cdh5.Cre mice) with mice expressing Epas1 alleles with loxP sites flanking exon (Epas1lox/lox mice). (B) qPCR analysis of Epas1 mRNA expression in glomeruli extracts from 12-week-old Epas1lox/lox and Cdh5.Cre-Epas1lox/lox mice. Data represent means±SEM of six mice. #P<0.05. (C) qPCR analysis of Epas1 mRNA expression in lung extracts from 12-week-old Epas1lox/lox and Cdh5.Cre-Epas1lox/lox mice. Data represent means±SEM from six mice. #P<0.05. (D) Western blot analysis of EPAS1 expression in glomeruli isolated from 20-week-old Epas1lox/lox and Cdh5.Cre-Epas1lox/lox mice treated or not with AngII for 42 days. GAPDH is used as loading control. (E) Quantification of Western blot bands for EPAS1 normalized to GAPDH band intensity (means±SEM of three to six mice per group). #P<0.05; #different genotype, same treatment.
Figure 2.
Figure 2.
Endothelial EPAS1 deficiency is associated with a blunted renal vascular response to AngII with a similar hypertensive effect. (A) Mean arterial pressure, (C) RBF, and (E) RVR at basal state in pentobarbital-anesthetized 10- to 12-week-old Epas1lox/lox and Cdh5.Cre-Epas1lox/lox mice. Maximum changes in (B) mean arterial pressure, (D) RBF, and (F) RVR produced by 2, 4, or 10 ng norepinephrine; 0.5, 1, or 2 ng AngII; 1, 5, or 25 ng acetylcholine, or 100 or 200 ng sodium nitroprusside in 10- to 12-week-old Epas1lox/lox and Cdh5.Cre-Epas1lox/lox mice. Data represent mean±SEM of n=10–15 mice. *Epas1lox/lox genotype compared with basal state; ξCdh5.Cre-Epas1lox/lox genotype compared with basal state; #different genotype, same treatment. *ξ#P<0.05; **ξξ##P<0.01; ***ξξξP<0.001.
Figure 3.
Figure 3.
Effect of losartan on vascular resistance shows that EPAS1-induced vasoconstriction is specific to AngII. Maximum changes in (A) mean arterial pressure, (B) RBF, and (C) RVR produced by 2 ng AngII or 40 ng norepinephrine in 10- to 12-week-old Epas1lox/lox and Cdh5.Cre-Epas1lox/lox mice. Mice were pretreated with 20 μg losartan 5 minutes before AngII or norepinephrine treatment. n=5 mice per group. Data represent mean±SEM. *Epas1lox/lox genotype AngII+losartan compared with AngII; ξCdh5.Cre-Epas1lox/lox genotype AngII+losartan compared with AngII; #different genotype, same treatment. *ξP<0.05; ##P<0.01; ***ξξξP<0.001.
Figure 4.
Figure 4.
Endothelial EPAS1 deficiency aggravates AngII-induced albuminuria in a BP-independent manner. (A) Systolic BP, (B) diastolic BP, and (C) heart rate were recorded by radiotelemetry over 35 days in Epas1lox/lox (n=9) and Cdh5.Cre-Epas1lox/lox (n=7) mice at baseline and under AngII subcutaneous infusion (1 µg/kg per minute). For all panels, data correspond to the 12-hour night period. Data represent mean±SEM. #P<0.05. (D) BUN concentration, (E) urinary albumin excretion rate, and (F) kidney-to-body weight ratio in 20-week-old Epas1lox/lox and Cdh5.Cre-Epas1lox/lox mice after AngII infusion for 6 weeks and from untreated Epas1lox/lox and Cdh5.Cre-Epas1lox/lox mice. (G) Cardiac output measured by noninvasive ultrasound method in Epas1lox/lox and Cdh5.Cre-Epas1lox/lox mice at baseline and after 5 weeks of AngII subcutaneous infusion. (H) Heart-to-body weight ratio and (I) glomerular mean surface variation (percentage) in kidney cortexes from 20-week-old Epas1lox/lox and Cdh5.Cre-Epas1lox/lox mice after 6 weeks of AngII infusion compared with untreated Epas1lox/lox and Cdh5.Cre-Epas1lox/lox mice. Data represent mean±SEM of n=10–15 mice for (D–H), and of n=7 mice for (I). *Same genotype, different treatment; #different genotype, same treatment. #*P<0.05; ##P<0.001; ***P<0.001.
Figure 5.
Figure 5.
Deletion of EPAS1 specifically in endothelial cells favors hypertension-induced glomerulosclerosis. Representative images of (A) hematoxylin and eosin–stained sections, (B) Masson trichrome–stained sections, and (C) Sirius Red staining of renal cortex from 20-week-old Epas1lox/lox and Cdh5.Cre-Epas1lox/lox mice after 6 weeks of AngII infusion, and from untreated Epas1lox/lox and Cdh5.Cre-Epas1lox/lox mice. Images are representative of at least six mice per group. Scale bar, 50 µm. (D) Quantification of the percentage of sclerotic glomeruli, (E) the percentage of cortical Sirius Red staining, and (F) the tubular casts per section in renal cortex from 20-week-old Epas1lox/lox and Cdh5.Cre-Epas1lox/lox mice after 6 weeks of AngII infusion and from untreated Epas1lox/lox and Cdh5.Cre-Epas1lox/lox mice. Data represent means±SEM of at least six mice. *Same genotype, different treatment; #different genotype, same treatment. *P<0.05; **P<0.01; ###***P<0.001.
Figure 6.
Figure 6.
Endothelial EPAS1 deficiency promotes hypertension-induced endothelial damage. (A) Representative images of the expression of PECAM1 by immunofluorescence (red) in glomeruli and (B) renal cortexes (white) in 20-week-old Epas1lox/lox and Cdh5.Cre-Epas1lox/lox mice after 6 weeks of AngII infusion and from untreated Epas1lox/lox and Cdh5.Cre-Epas1lox/lox mice. Nuclei in (A) were counterstained with DAPI stain (blue). Scale bar, 50 µm. (C) Quantification of PECAM1 staining in renal cortex from 20-week-old Epas1lox/lox and Cdh5.Cre-Epas1lox/lox mice after 6 weeks of AngII infusion and from untreated Epas1lox/lox and Cdh5.Cre-Epas1lox/lox mice. Data represent means±SEM of at least five mice per group. *Same genotype, different treatment; #different genotype, same treatment. #P<0.05; *P<0.01. (D) Representative photomicrographs of transmission electron microscopy sections of glomeruli from 20-week-old Epas1lox/lox and Cdh5.Cre-Epas1lox/lox mice after 6 weeks of AngII infusion and from untreated Epas1lox/lox and Cdh5.Cre-Epas1lox/lox mice showing disappearance of endothelial fenestration, subendothelial inclusions (*), aggravated endothelial swelling, and cytoplasmic vacuolization (arrows) in endothelial cells from Cdh5.Cre-Epas1lox/lox mice after AngII infusion. Scale bar, 0.5 µm. Images are representative of at least six mice.
Figure 7.
Figure 7.
Endothelial EPAS1 deletion accelerates podocyte dedifferentiation, glomerular PEC activation, and extracellular matrix deposition mimicking FSGS lesions during AngII-induced hypertension. (A) Representative images of the expression of NPHS2/podocin (white, upper panel), PODXL/podocalyxin (white, middle panel), and NPHS1/nephrin (white, lower panel) by immunofluorescence in glomeruli from 20-week-old Epas1lox/lox and Cdh5.Cre-Epas1lox/lox mice after 6 weeks of AngII infusion and from untreated Epas1lox/lox and Cdh5.Cre-Epas1lox/lox mice. (B) Representative photomicrographs of transmission electron microscopy sections of glomeruli showing cellular bridges between Bowman’s capsule and glomerular tuft (*) in Cdh5.Cre-Epas1lox/lox mice after 6 weeks of AngII infusion. Scale bar, 2 µm. (C) Representative photomicrographs of transmission electron microscopy sections of glomeruli showing foot process effacement (arrows) in Cdh5.Cre-Epas1lox/lox mice after 6 weeks of AngII infusion. Scale bar, 0.5 µm. (D) Representative photomicrographs of transmission electron microscopy sections of glomeruli showing cellular communication between PECs and podocytes (P) (*) in Cdh5.Cre-Epas1lox/lox mice after 6 weeks of AngII infusion. Scale bar, 0.5 µm. Images are representative of at least six mice.
Figure 8.
Figure 8.
Endothelial EPAS1 deficiency promotes hypertension-induced podocyte and glomerular PEC ultrastructural alterations. (A) Representative images of CD44 (brown, upper panel), and fibronectin (brown, lower panel) expression in glomeruli from 20-week-old Epas1lox/lox and Cdh5.Cre-Epas1lox/lox mice after 6 weeks of AngII infusion and from untreated Epas1lox/lox and Cdh5.Cre-Epas1lox/lox mice showing increased PEC activation and glomerular peripheral fibronectin deposition in Cdh5.Cre-Epas1lox/lox AngII mice. Scale bar, 50 µm. (B) Quantification of the percentage of fibronectin staining per glomerular area, (C) the percentage of glomeruli with peripheral fibronectin staining, and (D) the percentage of CD44-positive glomeruli in renal cortex from 20-week-old Epas1lox/lox and Cdh5.Cre-Epas1lox/lox mice after 6 weeks of AngII infusion and from untreated Epas1lox/lox and Cdh5.Cre-Epas1lox/lox mice. Data represent means±SEM of at least six mice. *Same genotype, different treatment; #different genotype, same treatment. #*P<0.05; **P<0.01.

Comment in

References

    1. Huby AC, Rastaldi MP, Caron K, Smithies O, Dussaule JC, Chatziantoniou C: Restoration of podocyte structure and improvement of chronic renal disease in transgenic mice overexpressing renin. PLoS One 4: e6721, 2009 - PMC - PubMed
    1. Strupler M, Hernest M, Fligny C, Martin JL, Tharaux PL, Schanne-Klein MC: Second harmonic microscopy to quantify renal interstitial fibrosis and arterial remodeling. J Biomed Opt 13: 054041, 2008 - PubMed
    1. Crowley SD, Song YS, Sprung G, Griffiths R, Sparks M, Yan M, Burchette JL, Howell DN, Lin EE, Okeiyi B, Stegbauer J, Yang Y, Tharaux PL, Ruiz P: A role for angiotensin II type 1 receptors on bone marrow-derived cells in the pathogenesis of angiotensin II-dependent hypertension. Hypertension 55: 99–108, 2010 - PMC - PubMed
    1. Crowley SD, Frey CW, Gould SK, Griffiths R, Ruiz P, Burchette JL, Howell DN, Makhanova N, Yan M, Kim HS, Tharaux PL, Coffman TM: Stimulation of lymphocyte responses by angiotensin II promotes kidney injury in hypertension. Am J Physiol Renal Physiol 295: F515–F524, 2008 - PMC - PubMed
    1. Nijenhuis T, Sloan AJ, Hoenderop JG, Flesche J, van Goor H, Kistler AD, Bakker M, Bindels RJ, de Boer RA, Möller CC, Hamming I, Navis G, Wetzels JF, Berden JH, Reiser J, Faul C, van der Vlag J: Angiotensin II contributes to podocyte injury by increasing TRPC6 expression via an NFAT-mediated positive feedback signaling pathway. Am J Pathol 179: 1719–1732, 2011 - PMC - PubMed

MeSH terms

Substances