. 2018 Jan;32(1):440-452.
doi: 10.1096/fj.201700485RR. Epub 2017 Sep 19.

Carbonic anhydrase III protects osteocytes from oxidative stress

Affiliations

Carbonic anhydrase III protects osteocytes from oxidative stress

Chao Shi et al. FASEB J. 2018 Jan.

Abstract

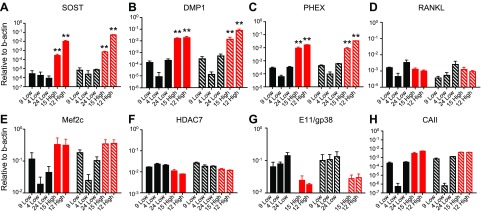
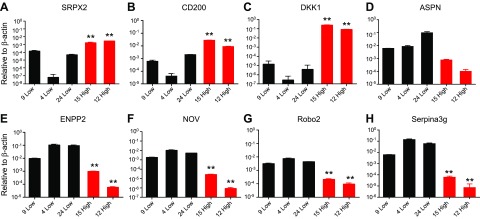
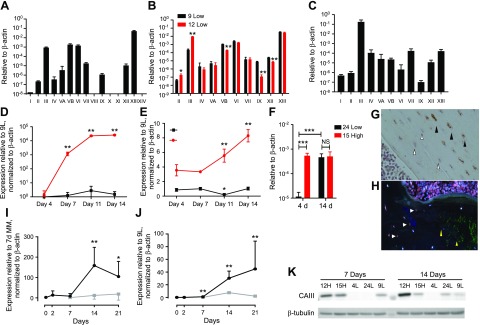
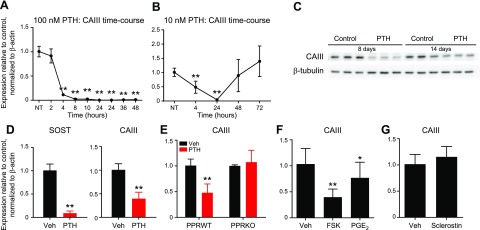
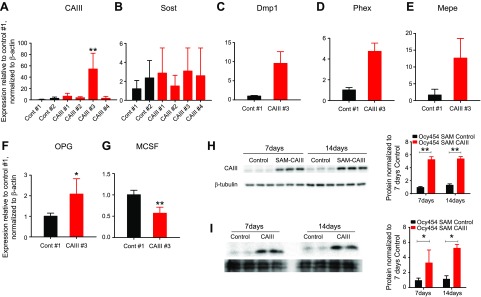
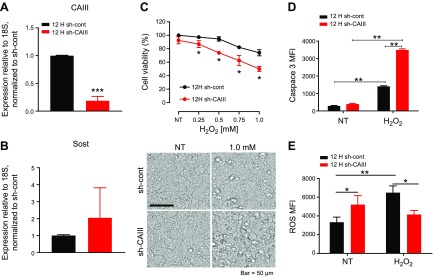
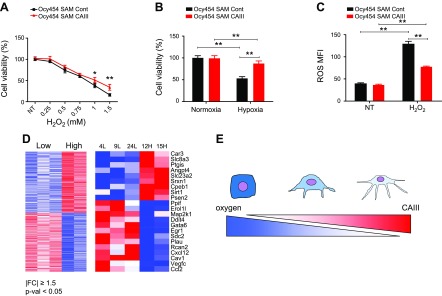
Osteocytes are master orchestrators of bone remodeling; they control osteoblast and osteoclast activities both directly via cell-to-cell communication and indirectly via secreted factors, and they are the main postnatal source of sclerostin and RANKL (receptor activator of NF-kB ligand), two regulators of osteoblast and osteoclast function. Despite progress in understanding osteocyte biology and function, much remains to be elucidated. Recently developed osteocytic cell lines-together with new genome editing tools-has allowed a closer look at the biology and molecular makeup of these cells. By using single-cell cloning, we identified genes that are associated with high Sost/sclerostin expression and analyzed their regulation and function. Unbiased transcriptome analysis of high- vs. low-Sost/sclerostin-expressing cells identified known and novel genes. Dmp1 (dentin matrix protein 1), Dkk1 (Dickkopf WNT signaling pathway inhibitor 1), and Phex were among the most up-regulated known genes, whereas Srpx2, Cd200, and carbonic anhydrase III (CAIII) were identified as novel markers of differentiated osteocytes. Aspn, Enpp2, Robo2, Nov, and Serpina3g were among the transcripts that were most significantly suppressed in high-Sost cells. Considering that CAII was recently identified as being regulated by Sost/sclerostin and capable of controlling mineral homeostasis, we focused our attention on CAIII. Here, we report that CAIII is highly expressed in osteocytes, is regulated by parathyroid hormone both in vitro and in vivo, and protects osteocytes from oxidative stress.-Shi, C., Uda, Y., Dedic, C., Azab, E., Sun, N., Hussein, A. I., Petty, C. A., Fulzele, K., Mitterberger-Vogt, M. C., Zwerschke, W., Pereira, R., Wang, K., Divieti Pajevic, P. Carbonic anhydrase III protects osteocytes from oxidative stress.

Keywords: PTH; bone homeostasis; sclerostin.


Conflict of interest statement

This work was partially supported by U.S. National Institutes of Health (NIH) National Institute of Arthritis and Musculoskeletal and Skin Diseases Grants AR060221, AR059655, and NIH National Institute of Diabetes and Digestive and Kidney Diseases Grant DK079161 (to P.D.P.). The Center for Skeletal Research Core (NIH National Institute of Arthritis and Musculoskeletal and Skin Diseases Grant P30-AR066261) provided primary calvaria osteoblasts and hypoxic chambers and conducted radioimmunoassays for cAMP. This work was also supported by the Boston University Flow Cytometry Core Facility and the Boston University Microarray Core Facility (Clinical & Translational Science Institute Grant U54-TR001012). The authors declare no conflicts of interest.

Figures

Figure 1.
Figure 1.
Ocy454 subclone characterization. Ocy454 clones: 3 low- (9-Low, 4-Low, and 24-Low) and 2 high-sclerostin–expressing clones (15-High and 12-High) were used for additional characterization. AC, E, H) Semiquantitative PCR Sost (A), Dmp1 (B), Phex (C), Mef2c (E), and CAIII (H) are significantly increased in 2 high (15-High and 12-High; red bars) clones compared with 3 low (9-Low, 4-Low and 24-Low; black bars) clones after 7 (solid bars) and 14 (hatched bars) d in culture (regular medium, 37°C). D, F, G) Hdac7 (F) and E11/gp38 (G) expression is significantly lower in 15- and 12-High compared with 9-, 4-, and 24-Low, whereas RANKL (D) is unchanged across subclones. Gene expression is normalized to β-actin. Data are expressed as means ± sd of triplicates. Each experiment was repeated at 3–4 times. Two-way ANOVA with Tukey’s multiple comparison test was performed. *P < 0.05, **P < 0.01.
Figure 2.
Figure 2.
Transcripts that are differentially regulated in high- and low-expressing clones. AC) Semiquantitative PCR for Srpx2 (A), CD200 (B), and DKK1 (C). These transcripts are significantly increased in and 2 high (15-High and 12-High; red bars) clones compared with 3 low (9-Low, 4-Low and 24-Low; black bars) clones after 7 d of differentiation at a nonpermissive temperature (37°C). DH) Aspn (D), Enpp2 (E), Nov (F), Robo2 (G), and Serpina3g (H) are significantly lower in 15- and 12-High compared with 9-, 4-, and 24-Low. Gene expression is normalized to β-actin. Data are expressed as means ± sd of triplicates. Each experiment was repeated at 3–4 times. One-way ANOVA with Tukey’s multiple comparison test was performed. **P < 0.01.
Figure 3.
Figure 3.
CA expression and regulation. Cells were plated at 10 × 105 cells/ml and cultured at a permissive temperature (33°C) for 3–4 d before being moved to a nonpermissive temperature (37°C). A) Semiquantitative PCR for all CA isoforms. CAIII, CAVB, CAVI, and CAXIII were highly expressed in Ocy454 cells. Data are normalized to β-actin. B) CA isoform expression in 12H (high) and 9L (low) Sost cells. CAII and CAIII were significantly increased in 12H, whereas CAVB, CAIX, CAXII, and CAXIII were significantly reduced. C) CA expression in mouse femurs (n = 5). Among the isoforms, CAIII is the most abundant in bone. D, E) Time course expression of Sost (D) and CAIII (E) in Ocy454-12H (red line) and Ocy454-9L (black line). F) CAIII expression in 24L (black bars) and 15H (red bars) after 7 and 14 d in culture. G) Immunohistochemistry analysis of mouse femur. CAIII-positive osteocytes (black arrowheads) are more abundant in the center of the cortex, whereas CAIII-negative cells (open arrowheads) are closer to the endosteal surface. Original magnification, ×40. H) Immunofluorescence for CAIII (red, white arrow) and sclerostin (green, yellow arrows) in human iliac bone. I, J) Expression of Sost (I) and CAIII (J) in primary osteoblasts that were isolated from mouse calvaria were cultured up to 3 wk in the absence (gray line) or presence of 50 μg/ml ascorbic acid and 10 mM β-glycerophospate (mineralization medium, black line). Data are expressed as means ± sd. One-way ANOVA with Tukey’s multiple comparison test was performed. K) Western blot analysis of whole-cell lysate after 7 and 14 d. CAIII is highly expressed in 12H and 15H clones already at 7 d. NS, not significant. *P < 0.05, **P < 0.01 (vs. d 0 mineralization medium); ***P < 0.001, ΨP < 0.01 (vs. d 7 growth medium only). All experiments were performed in triplicate.
Figure 4.
Figure 4.
CAIII regulation by PTH and sclerostin. Cells were plated at 10 × 105 cells/ml and cultured at a permissive temperature (33°C) for 3–4 d before being moved to a nonpermissive temperature (37°C). A, B) Time course of CAIII expression after treatment with 100 nM (A) or 10 nM (B) PTH(1–34). CAIII transcripts were significantly suppressed by the hormone up to 48 h. When lower doses were used (B), the effect was reversed by 48–72 h. C) PTH (100 nM for 24 h) significantly suppressed CAIII protein levels. D) PTH significantly suppressed CAIII and Sost expression in OEBEs. Femurs and tibiae from C57BL/6N mice were deprived of epiphysis and bone marrow and cultured for a few days before PTH treatment (n = 3). E) Ocy454 cells that lacked PTH1R expression [PPR-knockout (KO)] were treated with PTH for 4 h before RNA extraction. In the absence of PPR expression, there was no regulation of CAIII upon PTH treatment (red bars). F) Treatment of Ocy454 with forskolin (FSK; 10 μM) and prostaglandin E2 (PGE2; 100 mM) for 4 h significantly suppressed CAIII expression. G) Treatment with sclerostin (50 ng/ml) for 5 d did not regulate CAIII gene expression in Ocy454 cells. Data in panels A, B and DG are relative to β-actin and normalized to NT or vehicle. NT, no treatment; Veh, vehicle; WT, wild-type. All experiments were performed in triplicate and repeated several times. Data are expressed as means ± sd. One-way ANOVA Tukey’s multiple comparison test was performed. *P < 0.05, **P < 0.01 (vs. NT or vehicle).
Figure 5.
Figure 5.
CAIII overexpression in Ocy454 cells. CAIII was overexpressed in Ocy454 cells by using the CRISPR/Cas9 SAM technique. A) Two controls (Cont #1 and 2) and 4 SAM-CAIII guided-RNAs (CAIII #1–4) were used to stably transfect Ocy454 cells. Real-time quantitative PCR analysis demonstrated that one gRNA (CAIII #3) significantly increased CAIII expression compared with control. BG) SAM-CAIII #3 significantly increased Sost (B), Dmp1 (C), Phex (D), Mepe (E), osteoprotegerin (OPG; F), and M-CSF (G) expression compared with control. SAM-CAIII #3 was used in panels DG. Data are expressed as means ± sd. H) Western blot analysis of whole-cell lysates of SAM-CAIII #3 cells cultured for 7 and 14 d. CAIII protein is significantly increased in SAM cells (red bars) compared with control (black bar). Quantification is shown on the right. I) Western blot of conditioned medium from controls and SAM-CAIII cells. Quantification is shown on the right and was normalized by β-tubulin. Each experiment was repeated 3 times. *P < 0.05, **P < 0.01.
Figure 6.
Figure 6.
CAIII protects osteocytes from oxidative stress. Ocy454-12H cells were infected with lentiviral shCAIII to knock down CAIII expression. A, B) Quantitative real-time PCR analysis of CAIII (A) and Sost (B) expression in 12H shCAIII cells. C) 12H shCAIII cell viability under H2O2 treatment (6 h after 7 d in culture under 37°C). In the absence of CAIII, Ocy454 cells were more sensitive to H2O2 treatment compared with control, as demonstrated by the significantly reduced viability upon treatment with H2O2. Morphologic analysis of cells that were treated with H2O2 displayed signs of cell death (birifrangent nuclei), and these signs are more evident in shCAIII cells. D) Caspase-3 cleavage in shCAIII cells (red bars) that were exposed to 1 mM H2O2 for 4 h is increased compared with control cells (black bars). E) Basal increase in ROS was observed in shCAIII cells (red bars) compared with control cells (black bars). Upon H2O2 exposure, there was a significant increase in ROS in control cells but not in shCAIII cells. Each experiment was run in triplicates and performed at least 3 times. Data are expressed as means ± sd. Two-way ANOVA with Tukey’s multiple comparison test was performed. *P < 0.05, **P < 0.01 (vs. control or H2O2 treatment), ***P < 0.001.
Figure 7.
Figure 7.
CAIII overexpression protects osteocytes from cell death and ROS. A) CAIII-overexpressing Ocy454 cells (SAM-CAIII) displayed an increase in cell viability and reduced sensitivity to H2O2 exposure at various doses. B) SAM-CAIII cells were exposed to hypoxia (1% O2) for 24 h. C) H2O2-induced ROS activity is reduced in SAM-CAIII cells compared with SAM control. D) Unbiased global transcriptome analysis with microarray (Affymetrix) identified 518 genes (left) that were significantly up- or down-regulated in high-Sost–expressing clones (|FC| ≥1.5; P < 0.05; Supplemental Table 1). Expression values are shown as a colored representation (heatmap) in which each row corresponds to an Entrez Gene ID and each column corresponds to a clone (from left to right: 4L, 9L, 24L, 12H, and 15H). Red and blue indicate expression values ≥2 sd above and below, respectively, the row-wise mean (white) computed across all clones. Among those 518 genes, Functional Annotation Tools (DAVID) indicated that 22 genes (right), including CAIII, were involved in the response to hypoxic and/or oxidative stress (Supplemental Table 2). E) Schematic diagram of the relationship between CAIII expression and oxygen levels in osteocytic cell differentiation. As osteoblasts differentiate into osteocytes after being entrapped in the mineralized bone matrix in vivo, the oxygen level available for differentiating osteoblasts is decreased, whereas the expression of CAIII, which protects osteocytes from cell death and ROS, is increased.

References

    1. Balemans W., Ebeling M., Patel N., Van Hul E., Olson P., Dioszegi M., Lacza C., Wuyts W., Van Den Ende J., Willems P., Paes-Alves A. F., Hill S., Bueno M., Ramos F. J., Tacconi P., Dikkers F. G., Stratakis C., Lindpaintner K., Vickery B., Foernzler D., Van Hul W. (2001) Increased bone density in sclerosteosis is due to the deficiency of a novel secreted protein (SOST). Hum. Mol. Genet. 10, 537–543 - PubMed
    1. Balemans W., Patel N., Ebeling M., Van Hul E., Wuyts W., Lacza C., Dioszegi M., Dikkers F. G., Hildering P., Willems P. J., Verheij J. B., Lindpaintner K., Vickery B., Foernzler D., Van Hul W. (2002) Identification of a 52 kb deletion downstream of the SOST gene in patients with van Buchem disease. J. Med. Genet. 39, 91–97 - PMC - PubMed
    1. Brunkow M. E., Gardner J. C., Van Ness J., Paeper B. W., Kovacevich B. R., Proll S., Skonier J. E., Zhao L., Sabo P. J., Fu Y., Alisch R. S., Gillett L., Colbert T., Tacconi P., Galas D., Hamersma H., Beighton P., Mulligan J. (2001) Bone dysplasia sclerosteosis results from loss of the SOST gene product, a novel cystine knot-containing protein. Am. J. Hum. Genet. 68, 577–589 - PMC - PubMed
    1. Kim C. A., Honjo R., Bertola D., Albano L., Oliveira L., Jales S., Siqueira J., Castilho A., Balemans W., Piters E., Jennes K., Van Hul W. (2008) A known SOST gene mutation causes sclerosteosis in a familial and an isolated case from Brazilian origin. Genet. Test. 12, 475–479 - PubMed
    1. van Bezooijen R. L., ten Dijke P., Papapoulos S. E., Löwik C. W. (2005) SOST/sclerostin, an osteocyte-derived negative regulator of bone formation. Cytokine Growth Factor Rev. 16, 319–327 - PubMed

Publication types