Clinical Trial
. 2017 Sep 19;8(1):607.
doi: 10.1038/s41467-017-00452-4.

Tumor-associated B-cells induce tumor heterogeneity and therapy resistance

Affiliations
Clinical Trial

Tumor-associated B-cells induce tumor heterogeneity and therapy resistance

Rajasekharan Somasundaram et al. Nat Commun. .

Abstract

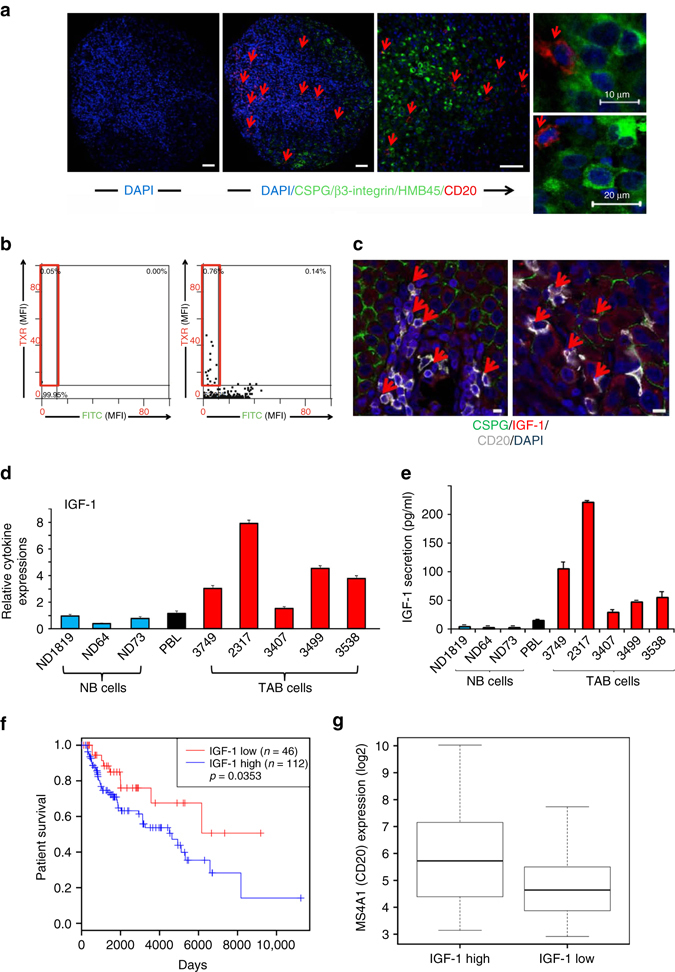
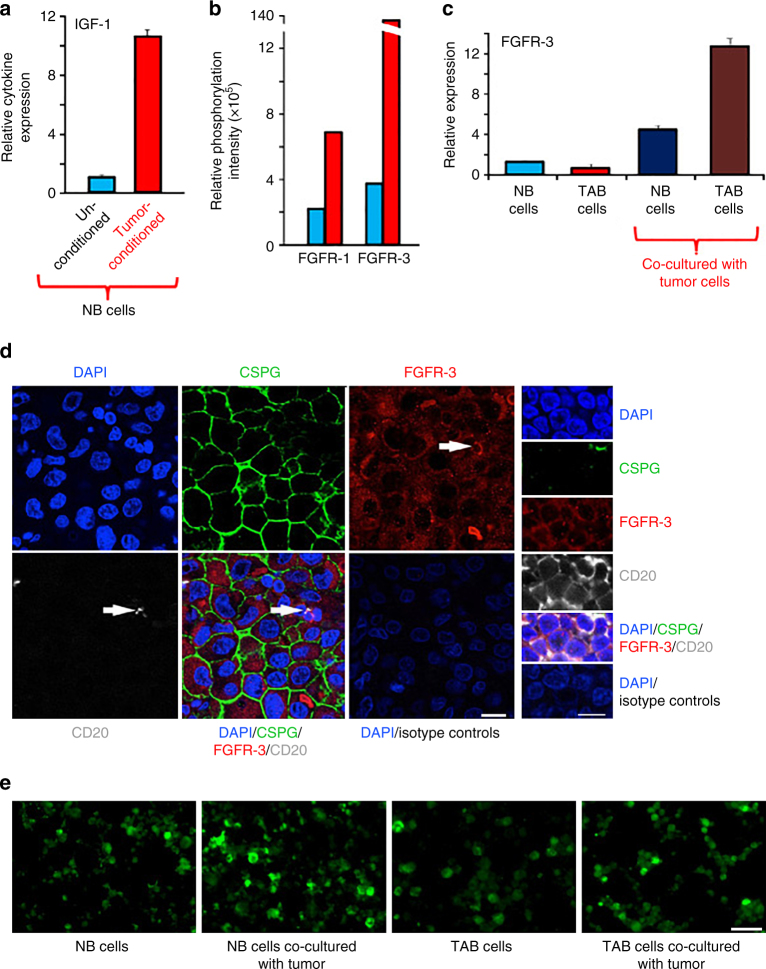
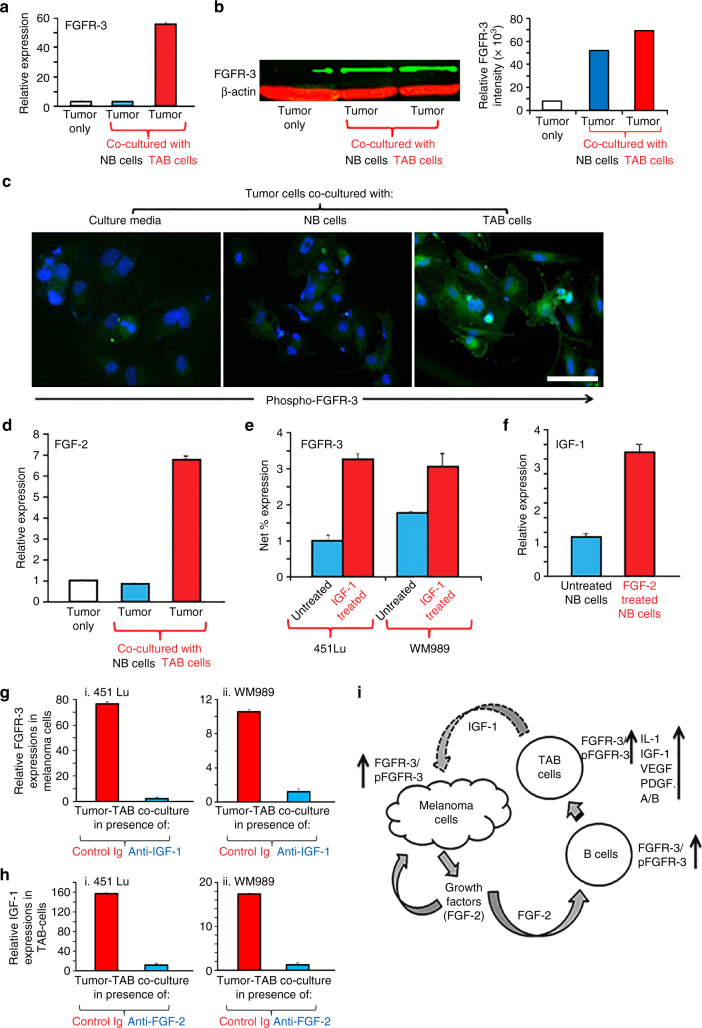
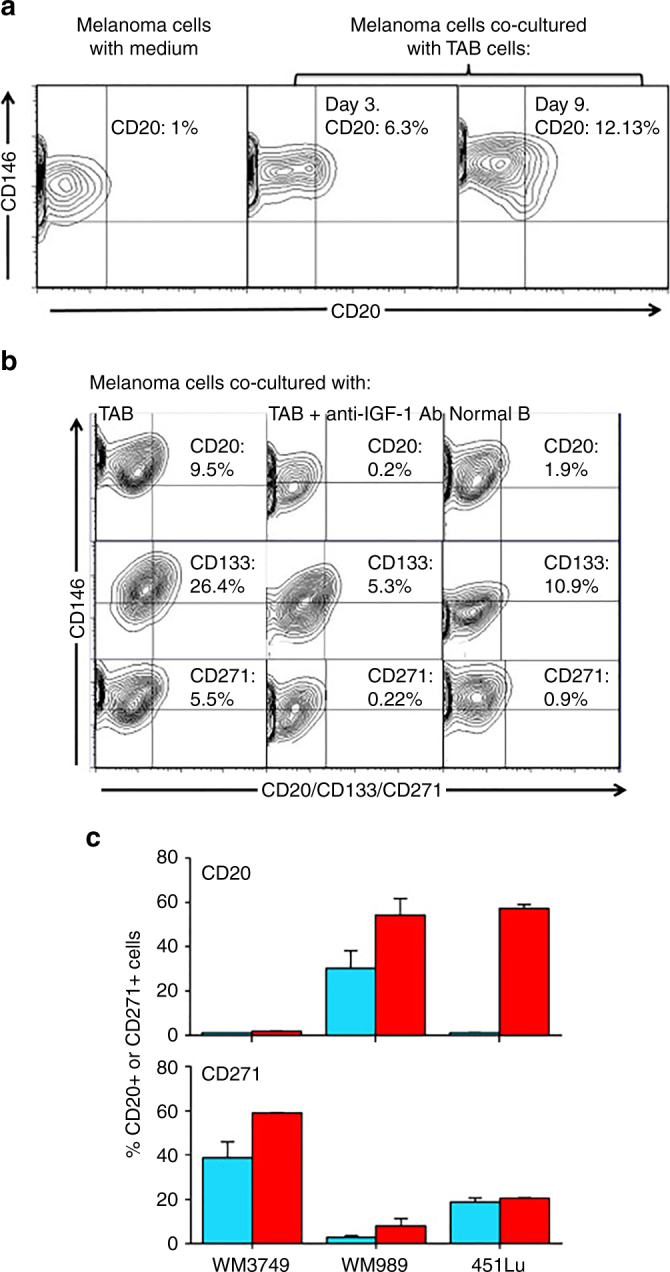
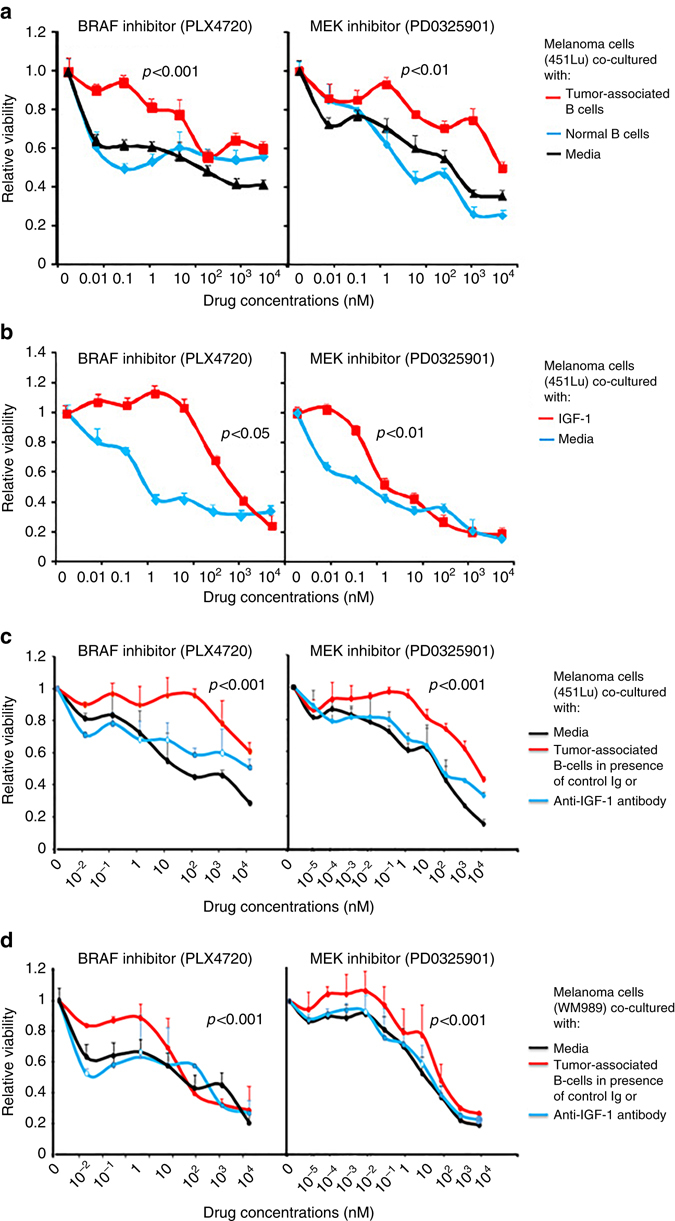
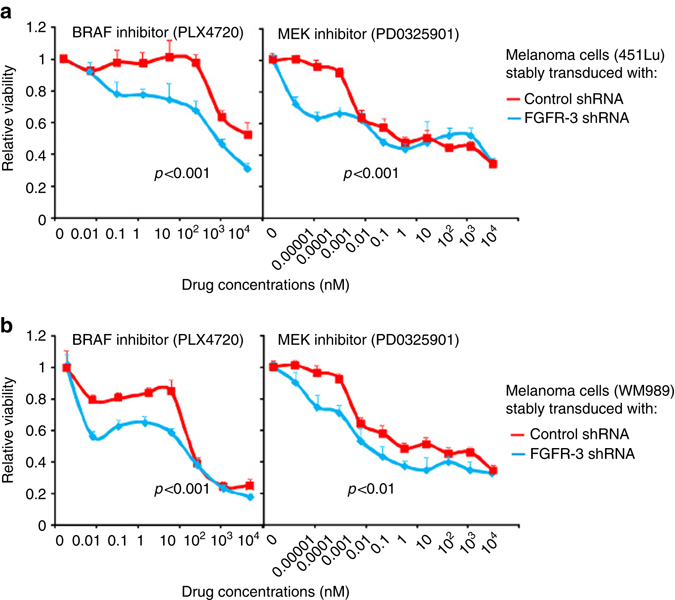
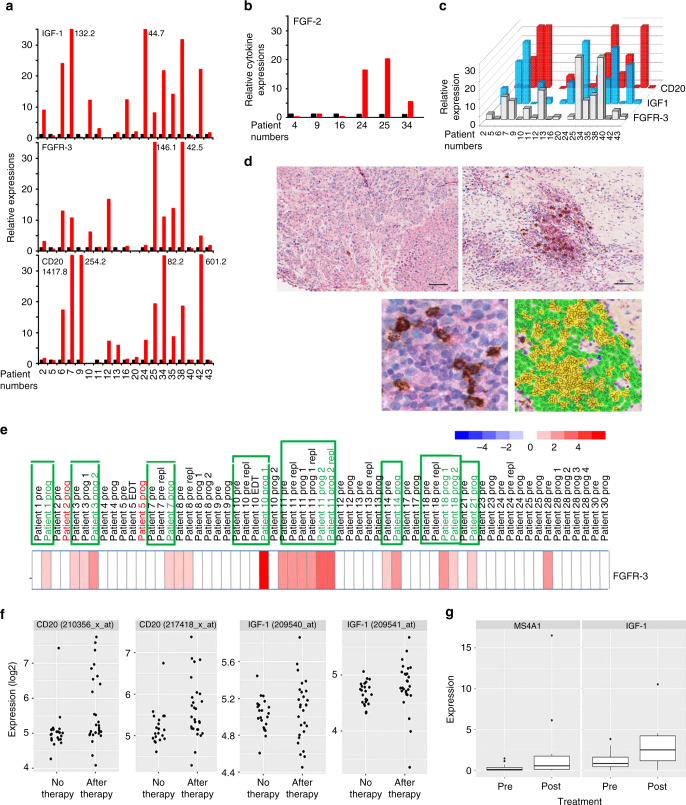
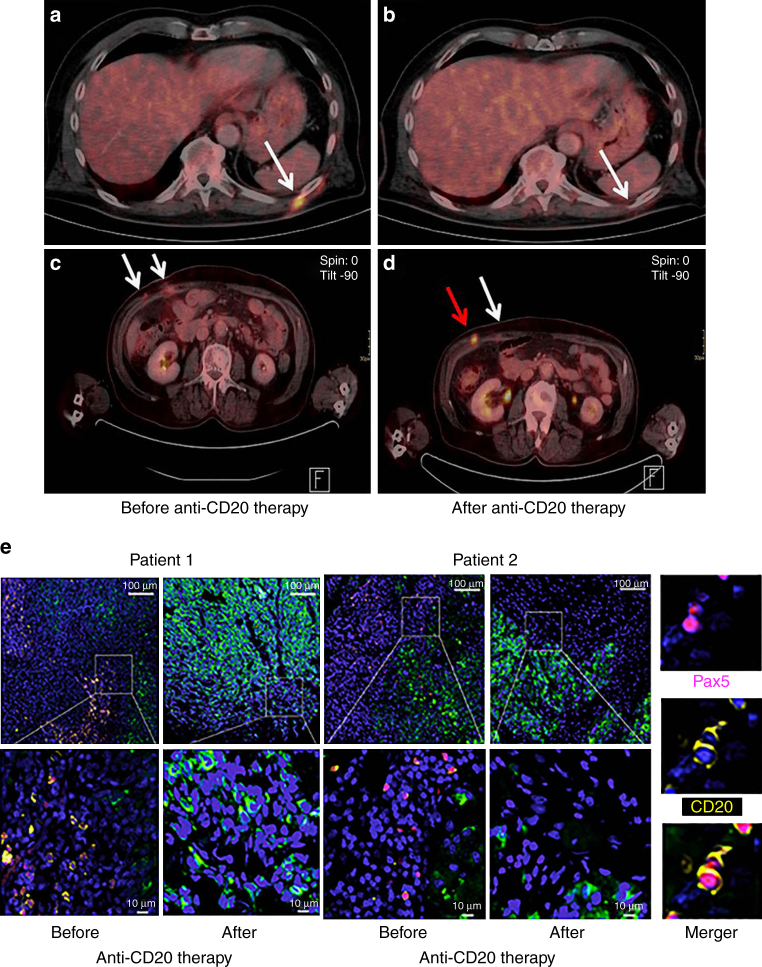
In melanoma, therapies with inhibitors to oncogenic BRAFV600E are highly effective but responses are often short-lived due to the emergence of drug-resistant tumor subpopulations. We describe here a mechanism of acquired drug resistance through the tumor microenvironment, which is mediated by human tumor-associated B cells. Human melanoma cells constitutively produce the growth factor FGF-2, which activates tumor-infiltrating B cells to produce the growth factor IGF-1. B-cell-derived IGF-1 is critical for resistance of melanomas to BRAF and MEK inhibitors due to emergence of heterogeneous subpopulations and activation of FGFR-3. Consistently, resistance of melanomas to BRAF and/or MEK inhibitors is associated with increased CD20 and IGF-1 transcript levels in tumors and IGF-1 expression in tumor-associated B cells. Furthermore, first clinical data from a pilot trial in therapy-resistant metastatic melanoma patients show anti-tumor activity through B-cell depletion by anti-CD20 antibody. Our findings establish a mechanism of acquired therapy resistance through tumor-associated B cells with important clinical implications.Resistance to BRAFV600E inhibitors often occurs in melanoma patients. Here, the authors describe a potential mechanism of acquired drug resistance mediated by tumor-associated B cells-derived IGF-1.


Conflict of interest statement

G.L. has consulting or advisory role for GSK, BMS, Novartis, Genentech, Amgen, Merck, Pierre Fabre, Array, and Roche. K.F. has consulting or advisory role for Novartis, Roche, and Array. J.W. is an advisory board member for GSK, Roche/Genentech, Novartis, and BMS. M.A.D. is an advisory board member for GSK, Roche/Genentech, Novartis, Sanofi, and Vaccinex. R.Sc. received an honorarium from Roche. The remaining authors declare no competing financial interests.

Figures

Fig. 1
Fig. 1
ag Prevalence of CD20+ B cells in metastatic melanoma tissues and increased IGF-1 expression in TAB cells. a, b Presence of CD20+B cells. Representative immunostaining (TMA, 79 cores from 48 patients) for CD20 (red) and a three melanoma marker combination (CSPG/β3 integrin/HMB45 (green)) plus DAPI nuclear stain (blue). a Left and middle panels: sample with predominant distribution of CD20+, triple melanoma marker-ve B cells in the tumor stroma (red; left panel: isotype control). Right panel: close-up with infiltration of single CD20+ B cells (red) among melanoma cells (green). Scale bars: 50 μm. Far right 2 panels: CD20+ B cells are DAPI+ and triple melanoma marker-ve. Scale bars: 10–20 μm. b Tissue FAXS analysis, the MFI was displayed in scattergrams for FITC-labeled CSPG/β3 integrin/HMB45+ and Texas red (TXR)-labeled CD20+ cells. Cutoff values were set based on isotype control staining (left panel). CD20+ B cells gated as CD20+, triple melanoma marker-vecells (right panel, red frame). c Representative immunostainings from additional metastases (six patients’ biopsies) stained for IGF-1 (red) in CD20+ (grayish white) CSPG-ve (green) B cells. Scale bars: 10 μm. d, e Immortalized B cells (48 h, B-cells-only cultures) from melanoma tissues (n = 5; TAB cells; red bars) show increased mRNA/protein expression of IGF-1 when compared with immortalized B cells from peripheral blood (n = 3; NB cells; blue bars) and pooled total PBL of healthy volunteers (black bars). d mRNA transcripts were determined by qPCR with levels indicated as RQ values normalized to GAPDH and relative to control normal B cells from healthy volunteers. Bars represent mean + SE of duplicate samples. Results are representative of three independent experiments for each sample. e B-cell supernatants (48 h, B-cells-only cultures) were used for protein expression of IGF-1 (ELISA). Bars represent mean + SE of duplicate samples. f, g TCGA-SKCM patients’ data set analyses (n = 473). f Kaplan–Meier survival curves of 158 melanoma patients with tumors containing a high lymphocyte infiltrate (above median, see Methods) who were divided into high and low IGF-1 expression (by median). Log-rank test shows poor OS in patients with high IGF-1 expression. g Box plots showing significantly (p < 0.0001, t-test) increased B-cell (MS4A1, CD20) expression levels in melanomas with high tumor IGF-1 expression
Fig. 2
Fig. 2
Melanomas convert normal B cells to a tumor-associated phenotype with high growth factor production for tumor stroma-tumor cell cross-talk. a NB cells from healthy volunteer (NB cells) co-cultured with melanoma tumor lineWM3749 (tumor-conditioned; red bars) show increased expression of growth factors and inflammatory cytokines, including IGF-1 (see Supplementary Fig. 4 for fresh NB cells), IL-1α/β and PDGF-A/-B (Supplementary Fig. 3b) when compared with unconditioned NB cells from the same healthy volunteer (blue bars). The B cells were harvested after 14 days (viability > 90%) and were analyzed by qPCR as in Fig. 1d. Results are representative of 2 independent experiments. be Upregulated protein or mRNA expression and phospho-signaling of FGFR-3 in B cells and melanoma cells as determined by qPCR or immunostaining. b NB cells co-cultured with melanoma cells for 48 h (red bars) show increased phosphorylation of FGFR-1 and FGFR-3 when compared with unconditioned B cells (blue bars) as determined by phospho-RTK array analysis. c NB- (dark blue bar) and TAB cells (dark brown bar) co-cultured with melanoma cells (WM3749) for 48 h show increased FGFR-3 expression compared with unconditioned normal (blue bar) or TAB cells (red bar); qPCR as in Fig. 1d. Results are representative of two independent experiments. d Detection of FGFR-3 expression in TAB cells in additional 10 metastatic melanoma patients’ biopsies by laser scanning microscopy. The 6 larger images on the left show FGFR3 expression in a CD20+ (grayish white) CSPG-ve (green) B-cell (white arrow) as well as in melanoma cells (CSPG+; green). The right panel is a close up into a CD20+ (grayish white) lymphocyte cluster of the tumor stroma in direct apposition to melanoma cells (part of a melanoma cell can be seen in the upper right corner by staining for CSPG; green). Nuclei were counterstained with DAPI (blue). Isotype-matched antibodies were used as a control. Representative images are shown. Scale bars: left 25 μm, right 10 μm. e Detection of FGFR-3 expression in NB or TAB cells after co-culture (48 h) with melanoma cells (WM3749) detected by immunostaining. Cytospin preparation of normal B or TAB cells after co-culture with melanoma cells show upregulation of FGFR-3 as determined by staining of B cells with rabbit anti-FGR-3 antibody followed by Alexa-Fluor 488 conjugated anti-rabbit antibody. Scale bars: 40 μm. Images were captured using Nikon fluorescent microscope
Fig. 3
Fig. 3
TAB cells modulate melanoma cells to express FGFR-3 and its ligand FGF-2 for tumor stroma-tumor cell cross-talk. a WM3749 co-cultured (72 h) with TAB cells (red bar) show increased FGFR-3 mRNA expression when compared with tumors only (open bar) or co-cultured with NB cells (blue bar). b Lysates obtained from pools of melanomas co-cultured (72–120 h) with NB- or TAB cells were probed in western blot with anti-FGFR-3 antibody (left panel), results expressed as relative intensity after β-actin normalization (right panel). c Melanoma cells co-cultured with TAB cells (72 h) show increased phospho-FGFR-3 expression (right panel; immunofluorescence assays) when compared with melanoma cells alone (left panel) or melanoma cells co-cultured with NB cells (middle panel), scale bars: 40 μm, images captured by Nikon inverted microscope. d Melanoma cells co-cultured with TAB cells (red bar) show increased FGF-2 mRNA expression when compared with melanoma cells alone (open bar) or melanoma cells co-cultured with NB cells (blue bar). e 451Lu and WM989treated with IGF-1 (25 ng/ml/daily for 5 days; red bar) show increased FGFR-3 expression when compared with untreated controls (blue bar), flow cytometry results expressed as net % expression of control antibody. IGF-1 treated melanoma cells (red bars) show higher expression of FGFR-3 compared with untreated cells (blue bars). Bar represents mean + SD of replicate samples. f NB cells treated with FGF-2 (10 ng/ml/daily for 4 days; red bar) show high IGF-1 mRNA expression relative to untreated NB cells (blue bar). g 451Lu and WM989 co-cultured (72 h) with TAB cells in the presence of an anti-IGF-1 neutralizing antibody (10 μg/ml) show decreased FGFR-3 mRNA expression in tumor cells (blue bar) when compared with controls (red bar). h TAB cells co-cultured (72 h) with 451Lu and WM989 in the presence of an anti-FGF-2 neutralizing antibody (1 μg/ml) show decreased IGF-1 mRNA expression in B cells (blue bar) when compared with controls (red bar).Experiments in a, d and fh were performed using qPCR. In Figures a, dh, bars represent mean + SE of duplicate samples and are representative of at least two independent experiments. i Summary of cross-talk between melanoma and B cells: FGF-2 is constitutively expressed by tumor cells, released into the microenvironment to bind FGFR-3 on the B cells, activated B cells express increased levels of pro-inflammatory cytokines. IGF-1 released by TAB cells modulates tumor cells to increase their growth, heterogeneity and therapy resistance
Fig. 4
Fig. 4
IGF-1-dependent induction of cancer stem cell markers CD20, CD133, and CD271 (NGFR) on melanoma cells. a Melanoma cells (WM3749) co-cultured with TAB cells (days 3 and 9) show high expression of CD20 (middle and right panels) compared with the control culture (left panel) as determined by FACS analysis. Melanoma cells were co-stained with anti-CD146 (MCAM, PE-conjugated) and anti-CD20 (FITC-conjugated) antibodies to distinguish them from B cells, which are CD146-negative;percentages indicate co-expression of both markers on the malignant cells. b Melanoma cells (WM3749) co-cultured with TAB cells (day 6) show high expression of CD20, CD133 and CD271 (left panel) compared with minimal or low expression of those markers when tumor cells are co-cultured with NB cells (right panel). Co-culture of melanoma cells with TAB cells did not modulate the expression of CD144 (vascular-endothelial cadherin marker) that are normally expressed by aggressive melanomas (data not shown). Induction of CD20, CD133, and CD271 was blocked when anti-IGF-1 neutralizing antibody (10 μg/ml) was used in the co-culture (middle panel). Anti-IL-1, anti-PDGF or anti-VEGF antibodies had no effect on CD marker expression (data not shown). Percentages indicate co-expression of CD20, CD133, or CD271on CD146+ melanoma cells. Results are representative of two independent experiments. c Melanoma cells(WM3749, WM989 and 451Lu) cultured in the presence of recombinant IGF-1 (25 ng/ml) for 5 days showed high expression of CD20 or CD271 (red bars) compared with untreated cells (blue bars) as determined by FACS assay. Bar represents mean + SE of triplicate samples
Fig. 5
Fig. 5
Melanoma cells co-cultured with TAB cells or recombinant IGF-1 are resistant to signaling inhibitors. a Melanoma cells (451Lu) co-cultured with TAB cells for 4–5 days are resistant to subsequent BRAFi (PLX4720) and MEKi (PD0325901) treatment (red lines) as compared with tumor cells cultured in the presence of NB cells (blue lines) or media control only (black lines). Co-cultured tumor cells were treated with drugs in triplicates for 72 h and viability was determined using the AlamarBlue assay. Results are expressed as relative viability of melanoma cells and drug responses are compared with appropriate controls. Data represents mean + SE of triplicate samples and p values (t-test) as indicated are for drug doses 0.1 to 10 nM of BRAFi and 0.01 nM to 1 nM of MEKi. b Melanoma cells treated with recombinant IGF-1 show resistance to BRAFiand MEKi. Melanoma cells (451Lu) were treated every day for a total of 5 days with recombinant IGF-1 (25 ng/ml; red lines), then harvested and their dose responses to BRAFiand MEKi determined as above. Results are compared with untreated melanoma cells as controls (blue lines). c, d Melanoma cells (451Lu (c) and WM989 (d)) co-cultured with TAB cells for 4 days in presence of anti-IGF-1 neutralizing antibody (blue lines) or media control (black lines) are sensitive to subsequent BRAFi and MEKi treatment as compared with cultures incubated with control antibody (red lines)
Fig. 6
Fig. 6
Knock-down of FGFR-3 in melanoma cells restores sensitivity to signaling inhibitors. a, b Knock-down of FGFR-3 rescues the sensitivity to BRAFi and MEKi. Dose responses to BRAFi and MEKi of melanoma cell lines (451Lu (a) and WM989 (b) stably transduced with FGFR-3 shRNA (blue lines) were determined as in Fig. 5 and compared with control shRNA-transduction (red lines). For validation of the FGFR-3 shRNA clone see Supplementary Fig. 10
Fig. 7
Fig. 7
Increased expression of IGF-1, FGFR-3, its ligand FGF-2 and CD20 in tumor tissue obtained on treatment with BRAF and MEK inhibitors. a, b Tumor tissue from melanoma patients (n = 20) after kinase inhibitor therapies (red bars) show increased transcript levels of IGF-1, FGFR-3, CD20, and FGF-2 b when compared with same patients’ pre-treatment tumor tissues (black bars). mRNA transcripts were determined by real time qPCR (as described in Fig. 1 legend) with levels indicated as RQ values normalized to an endogenous control (GAPDH) and relative to pre-treatment cDNA samples. c Transcript levels of IGF-1, FGFR-3, and CD20 of melanoma patients’ cDNA samples on treatment showed a correlation with each other (IGF-1 and FGFR-3 (Spearman’s r = 0.6936; p = 0.0376); IGF-1 and CD20 (Spearman’s r = 0.5074; p = 0.0020)). d Increased presence of CD20+ B cells co-stained with IGF-1 in tumor sections obtained from patients undergoing treatment with kinase inhibitors. Representative immunostaining of a patient’s tumor section pre- (left top panel) and on-therapy (bottom left panel) with BRAFi/MEKi showing co-staining of IGF-1 (red) and CD20 (dark brown). Magnified view of the co-staining is shown on top right panel and multi-spectral analysis confirming the co-localization of IGF-1 and CD20+ B cells is shown in bottom right panel (yellow). Scale bars: 100 μm. e Increased RNA expression of FGFR-3 in 8/21 progression biopsies (green frame) obtained post BRAF inhibitor (dabrafenib) therapy when compared with pretreatment biopsies. Gene expression analysis was performed using GEO data set (GSE50509). f Gene expression analysis of GEO data set (GSE8401, n = 52 metastatic melanoma samples): scatter plots showing significantly higher CD20 RNA expression (two probes; left two panels; p = 0.0185 and p = 0.0125; t-test) (see also Supplementary Fig. 11) and a trend towards higher IGF-1 expression (two probes; right two panels) in therapy resistant samples. g RNA-seq data were downloaded from EGA under accession number EGAS00001000992 (n = 38 melanoma samples, 27 patients) and the data from multiple probe sets are summarized into scatter plots. Significantly higher CD20 (MS4A1; left panel; p = 0.0206) and IGF-1 RNA expression (right panel; p = 0.0403; t-test) are seen in BRAFi-resistant melanomas
Fig. 8
Fig. 8
Clinical activity of CD20 immunotargeting in metastatic melanoma patients. PET-CT scans from two different patients obtained pre- vs. post-anti-CD20 antibody therapy. a, b Note complete disappearance of a metabolically active metastatic site (white arrow); c, d mixed response with almost complete disappearance of one metabolically active metastatic site (white arrow in d) and simultaneous increase in size and metabolic activity of the other (red arrow in d). e Representative combined PAX5 (nuclear; purple)/CD20 (membrane; yellow) immunofluoresence staining of patient-matched melanoma samples before and after therapy with anti-CD20 antibody (overviews (top rows; scale bars: 100 μm) and corresponding close ups (bottom rows; scale bars: 10 μm)). Note depletion of TAB cells in post-therapy tumors. CSPG staining of melanoma cells (green) and nuclear DAPI staining (blue). Right panel: double positive PAX5 (nuclear)/CD20 (membrane) immunofluoresent TAB cells

References

    1. Schadendorf D, et al. Melanoma. Nat. Rev. Dis. Primers. 2015;1:1–20. - PubMed
    1. Somasundaram R, Herlyn M. Nivolumab in combination with ipilimumab for the treatment of melanoma. Expert Rev. Anticancer Ther. 2015;15:1135–1141. doi: 10.1586/14737140.2015.1093418. - DOI - PMC - PubMed
    1. Straussman R, et al. Tumour micro-environment elicits innate resistance to RAF inhibitors through HGF secretion. Nature. 2012;487:500–504. doi: 10.1038/nature11183. - DOI - PMC - PubMed
    1. Villanueva J, et al. Acquired resistance to BRAF inhibitors mediated by a RAF kinase switch in melanoma can be overcome by cotargeting MEK and IGF-1R/PI3K. Cancer Cell. 2010;18:683–695. doi: 10.1016/j.ccr.2010.11.023. - DOI - PMC - PubMed
    1. Rizos H, et al. BRAF inhibitor resistance mechanisms in metastatic melanoma: spectrum and clinical impact. Clin. Cancer Res. 2014;20:1965–1977. doi: 10.1158/1078-0432.CCR-13-3122. - DOI - PubMed

Publication types

MeSH terms