. 2017 Sep 19;8(1):592.
doi: 10.1038/s41467-017-00608-2.

Predictors of responses to immune checkpoint blockade in advanced melanoma

Affiliations

Predictors of responses to immune checkpoint blockade in advanced melanoma

N Jacquelot et al. Nat Commun. .

Abstract

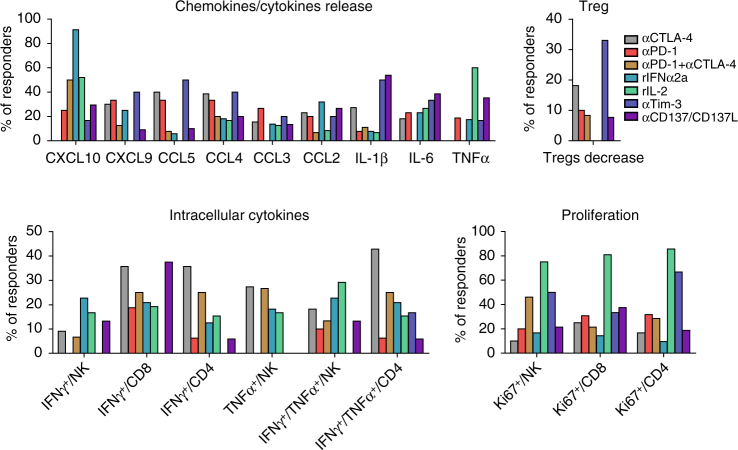
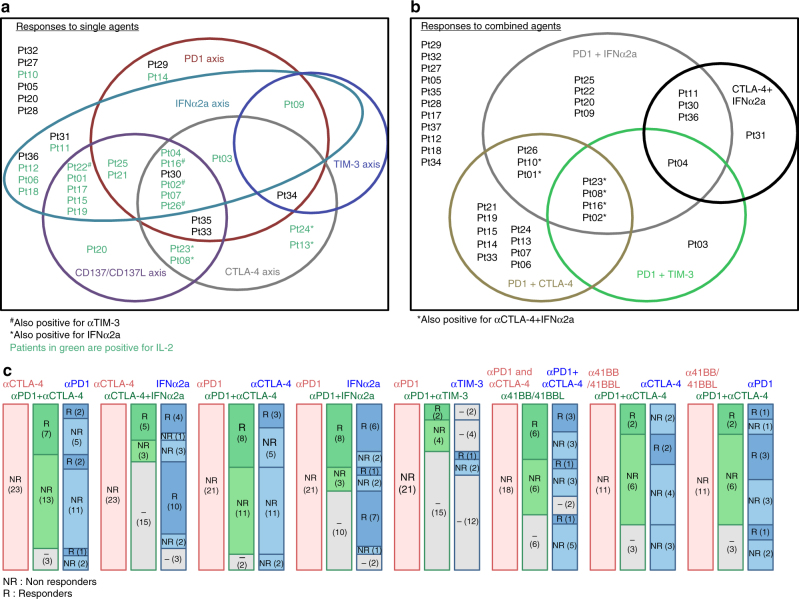
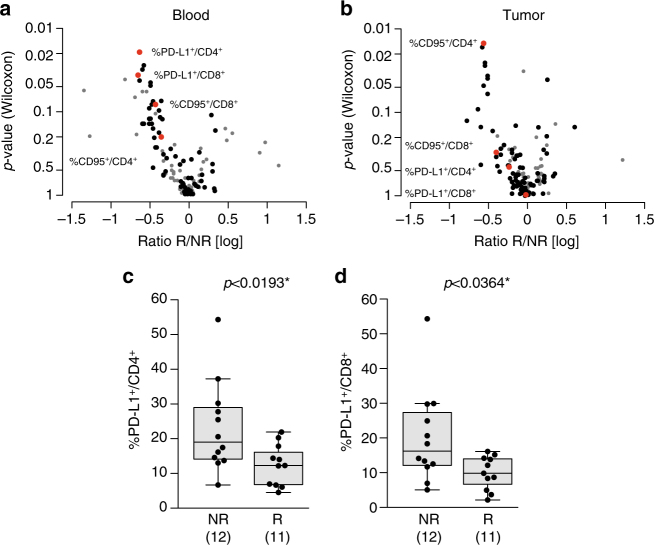
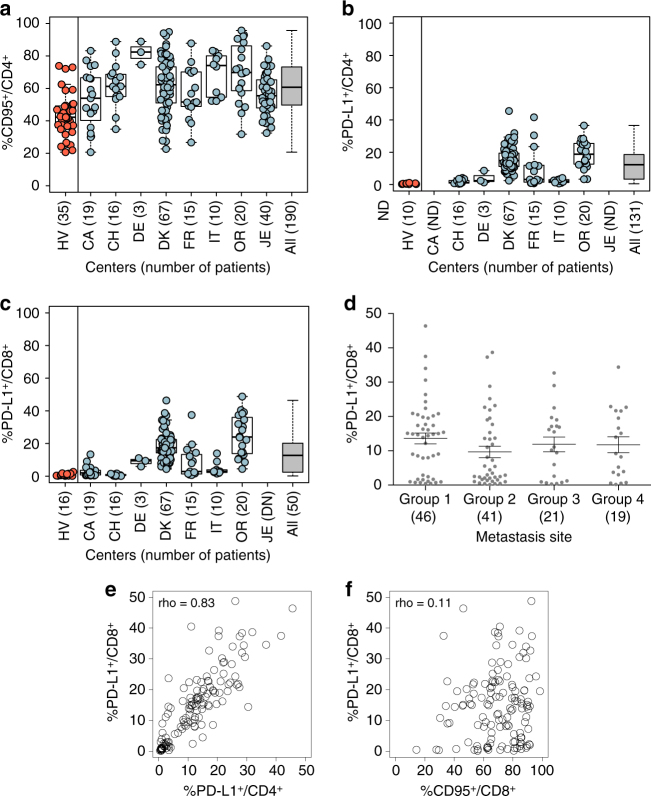
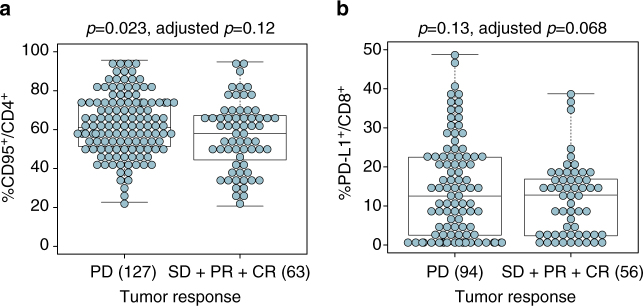
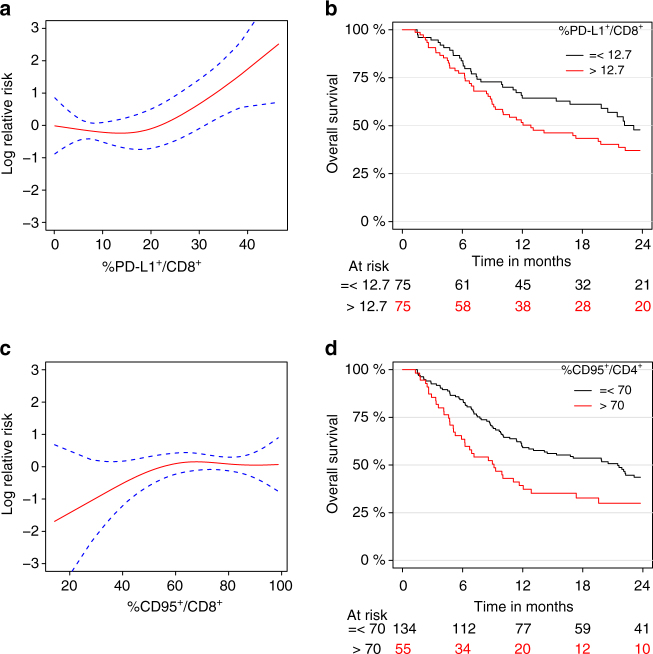
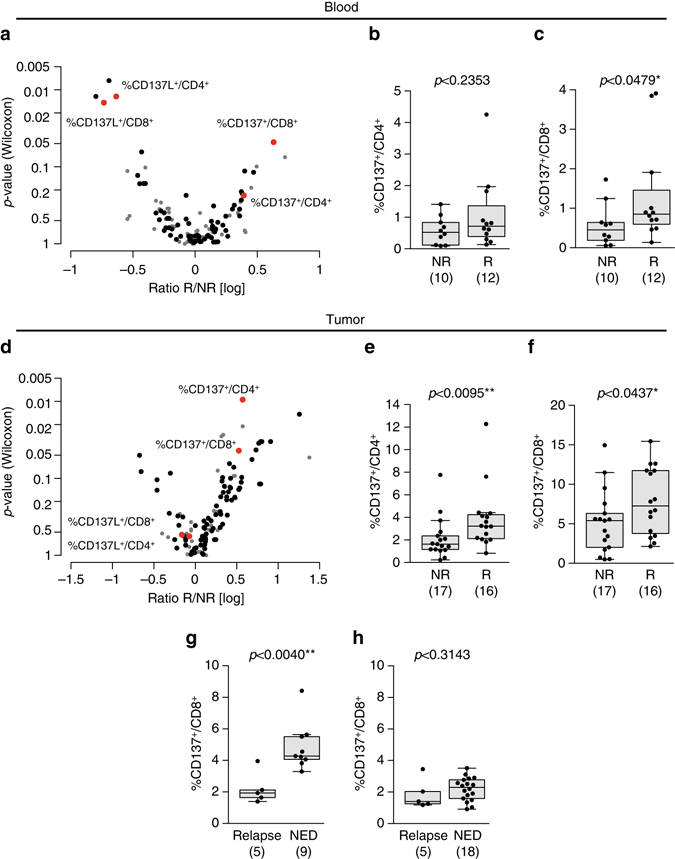
Immune checkpoint blockers (ICB) have become pivotal therapies in the clinical armamentarium against metastatic melanoma (MMel). Given the frequency of immune related adverse events and increasing use of ICB, predictors of response to CTLA-4 and/or PD-1 blockade represent unmet clinical needs. Using a systems biology-based approach to an assessment of 779 paired blood and tumor markers in 37 stage III MMel patients, we analyzed association between blood immune parameters and the functional immune reactivity of tumor-infiltrating cells after ex vivo exposure to ICB. Based on this assay, we retrospectively observed, in eight cohorts enrolling 190 MMel patients treated with ipilimumab, that PD-L1 expression on peripheral T cells was prognostic on overall and progression-free survival. Moreover, detectable CD137 on circulating CD8+ T cells was associated with the disease-free status of resected stage III MMel patients after adjuvant ipilimumab + nivolumab (but not nivolumab alone). These biomarkers should be validated in prospective trials in MMel.The clinical management of metastatic melanoma requires predictors of the response to checkpoint blockade. Here, the authors use immunological assays to identify potential prognostic/predictive biomarkers in circulating blood cells and in tumor-infiltrating lymphocytes from patients with resected stage III melanoma.


Conflict of interest statement

L.C. receives consulting fees from Medimmune and Pfizer and patent/licensing payments from Bristol-Myers Squibb (BMS); L.C. currently receives sponsored research funding from Boehringer Ingelheim, Pfizer and Nextcure. L.F. received research funding from BMS, Merck, Medimmune, Abbvie and Genentech. S.D. is principal investigator, received research grants and congress invitation by BMS. B.W. reports research grants, speaker honoraria, and travel support from MSD/Merck and BMS. I.M. has served as an advisor for Roche-Genentech, BMS, Boehringer Ingelheim, Novartis, Astra-Zeneca Medimmune and Incyte. AME participated on scientific advisory boards for Actelion, Agenus, Bayer, BMS, GlaxoSmithKline (GSK), HalioDx, Incyte, MSD, Nektar, Novartis, Pfizer, and Sanofi. L.Z. is on the Transgene administrative board and Lytix Pharma scientific advisory board and is the main founder of EverImmune. M.J.S. has research agreements with BMS and Corvus Pharmaceuticals and has received patent payments from BMS. A.M.D.G. has honoraria for certified continuing education, and travel supports from BMS, Astra-Zeneca, Roche and MSD. M. Maio has honoraria for certified continuing education, for consulting and advisory roles, research funding and travel supports from BMS, Roche and MSD. A.C.A. is a member of the SAB for Tizona Therapeutics, Potenza Therapeutics, and Idea Pharmaceuticals, which have interests in cancer immunology. A.K. received congress invitation from BMS. C.B. reports honoraria from Lilly, BMS and MSD, serves as advisory roles from Servier and Roche and receives research grants from Roche. B.D. reports BMS board participation, investigator for BMS clinical trials and congress invitation. Y.K. reports ownership interest in a patent regarding serum biomarkers for ipilimumab treatment (WO2016127052.A1). M.H. is a full time employee of Symphogen A/S Denmark. IMS reports honoraria for teaching, consultancy, and advisatory roles from BMS, Roche, Novartis, Genentech, and MSD, research agreement with BMS, Novartis, and Symphogen and co-founder of IO Biotech. R.D. receives research funding from Novartis, MSD, BMS, Roche, GSK and has a consultant or advisory board relationship with Novartis, MSD, BMS, Roche, GSK, Amgen, Takeda, Pierre Fabre. M.B., Y.M., and M.S.F. were supported by the NORFAR program, the Academic Research Office of the Chief Scientist, Ministry of Economy, Israel and collaborated with improdia.co.il. H.S. reports honoraria for teaching, consultancy and advisory boards from BMS, Roche, Merck and Novartis. J.S.W. receives travel grants from and participated to scientific advisory boards of BMS, Merck, Astra-Zeneca, Genentech and EMD Serono. A.M. received consulting honoraria from Roche/Genentech, BMS, Merck (MSD), Astra-Zeneca and participated to scientific advisory boards of Roche/Genentech, Pfizer/Merck serono, Novartis, GSK, eTherna, Kyowa Kirin, Symphogen, Genmab, Amgen, Lytix, Nektar, Seatlle Genetics, Transgene and Flexus Bio. The remaining authors declare no competing financial interests.

Figures

Fig. 1
Fig. 1
Typification of responses for each axis of stimulation. Summary of Supplementary Figs. 3−5 showing mLN responding to each axis (CTLA-4, PD-1, Tim-3, or combinations, together or with cytokines) by specific immunometrics shared by at least 20% of patients. M&M detail the experimental settings. Briefly, functional assays used flow cytometry determination of early (18–24 h post-stimulation) intracellular cytokine release in T and NK cells, late (day 4–5 post-stimulation) proliferation assays, chemokine and cytokine secretions in the supernatants at 18–24 h. A biological response to a given axis was scored “positive” when two independent readouts, reaching a >1.5-fold increase or decrease over two background levels (that of the medium and the isotype control Ab) were achieved
Fig. 2
Fig. 2
Global representation of the patterns of responses to individual or combined stimulations for 37 MMel. a, b Venn diagram representing each stimulating axis alone a or in combination b per circle, patients being identified by letters and numbers. c Frequencies of patient lesions that failed to respond to a given axis (first bar, in red) but could exhibit significant responses to alternative axis of stimulation. (second and third bar in green and blue). For instance (very left bars), in the non-responding lesions (NR) to anti-CTLA-4 Ab, we annotated the percentages that could respond (or not) to anti-CTLA-4 + anti-PD-1 Ab co-blockade (in green), among which some of them could respond (or not) to anti-PD-1 Ab alone (in blue). The detailed patterns of responses feature in Supplementary Table 1. In gray boxes: Not Done
Fig. 3
Fig. 3
PD-L1 expression on T cells predicts reactivity to ipilimumab in the “ex vivo mLN assay”. a, b Display of the Wilcoxon rank-sum test p-values vs. the log transformed ratio between responders (R) and non-responders (NR) to anti-CTLA-4 Ab in blood a or tumor b samples. Each dot represents one marker; selected biomarkers are shown in red while biomarkers with very low level of expression are shown in gray. c, d Expression levels of PD-L1 on blood CD4+ c and CD8+ d T cells in patient lesions responding (R) or not (NR) to the ex vivo mLN assay using a stimulation with anti-CTLA-4 mAb. Each dot represents one patient. The absolute numbers of patients are indicated in parentheses in both groups. Graphs were analyzed by Wilcoxon rank-sum test. Box and whiskers plots are represented from the corresponding distribution c, d
Fig. 4
Fig. 4
Melanoma patients express higher levels of PD-L1 on circulating T cells than healthy volunteers. ac Percentages of CD95 a and/or PD-L1+ b, c cells among blood CD4+ a, b or CD8+ c T cells, respectively, at baseline prior to ipilimumab. Flow cytometric assessments of the proportions of blood CD3+CD4+ or CD8+ cells expressing PD-L1 after thawing in eight cohorts of MMel (right columns) except CA and/or JE (not assessed), as well as 10–35 healthy volunteers (in red, left column). Each dot represents one healthy volunteer or patient. Mean and s.e.m. are represented along with the box plots for each cohort described in Supplementary Table 2. d Expression of PD-L1 on CD8+ T cells according to the metastatic sites: 1 (skin, lymph node and lung metastases only), 2 (visceral metastases, soft tissues +/− group 1), 3 (bone metastases and+/− groups 1 and/or 2) and 4 (brain metastases and others). e, f Spearman correlation between PD-L1+/CD8+ and PD-L1+/CD4+ or CD95+/CD8+ with rho index; each dot representing one patient. Box and whiskers plots are represented from the corresponding distribution ac. Mean + s.e.m. d
Fig. 5
Fig. 5
Predictive values of PD-L1+/CD8+ and CD95+/CD4+ for RR to ipilimumab. a, b Statistical analyses of the clinical relevance of CD95 expression on CD4+ T cells as well as PD-L1 on CD8+ T cells according to RR (separating PD from SD, PR, or CR) were performed in univariate and multivariate regression assays. Each dot represents one patient. The box plots indicating the mean and s.e.m. of values for the binary separation are depicted (cf Supplementary Table 4). The absolute numbers of patients are indicated in all groups in parentheses. Box and whiskers plots are represented from the corresponding distribution a, b
Fig. 6
Fig. 6
Relative risk of death according to PD-L1 or CD95 on T cells. Overall survival is fulfilled for n = 189 patients including 121 events. a Graphical visualization of the log relative risk according to the expression of PD-L1 on CD8+ T cells (p = 0.011 in the multivariate analysis, Supplementary Table 5). The dashed blue lines represent the 95% confidence intervals. b Kaplan−Meier OS curves segregating the whole cohort according to the median value (i.e., 12.7%) for the PD-L1 expression on blood CD8+ T cells at baseline. c Graphical visualization of the log relative risk according to the expression of CD95 on CD8+ T cells (p = 0.33 in the multivariate analysis, Supplementary Table 5). The dashed blue lines represent the 95% confidence intervals. d Kaplan−Meier OS curves segregating the whole cohort according to a cutoff value of 70% for the CD95 expression on blood CD4+ T cells at baseline
Fig. 7
Fig. 7
CD137 expression on blood CD8+ T cells predicts sensitivity to the combination of anti-CTLA-4+ anti-PD-1 Ab. a, d Display of the Wilcoxon rank-sum test p-values vs. the log transformed ratio between responders (R) and non-responders (NR) to anti-CTLA-4 + anti-PD-1 Abs in the blood a and tumor d in the ex vivo mLN assay. Each dot represents one marker; selected biomarkers are shown in red while biomarkers with low level of expression are shown in gray. bf Expression levels of CD137 in blood b, c and tumor bed e, f of CD4+ b, e and CD8+ T c, f cells, respectively, in patient lesions responding (R) or not (NR) in the ex vivo mLN assay anti-CTLA-4 + anti-PD-1 mAbs stimulatory condition. Each dot represents one patient. The absolute numbers of patients are indicated in both groups in parentheses. Graphs were analyzed by Wilcoxon rank-sum test. g, h Prospective analysis of CD137 expression on T cells prior to enrollment in a Phase II trial of high risk stage IIIc/IV MMel patients. Distributions of CD137 expression on blood CD8+ T cells at diagnosis prior to PD-1/CTLA-4 co-blockade g or PD-1 blockade h across patient groups stratified based on progression (relapse or no evidence of disease [NED]) with a median follow-up of 13 months post enrollment in adjuvant therapy for stage III/IV resected MMel. Each dot represents the flow cytometry analysis value of CD137 expression compared with an isotype control mAb prior to adjuvant therapy. Reported p-values are obtained from the Wilcoxon rank-sum test. Box and whisker plots are represented from the corresponding distribution b, c, eh

Comment in

References

    1. Tartour E, Zitvogel L. Lung cancer: potential targets for immunotherapy. Lancet Respir. Med. 2013;1:551–563. doi: 10.1016/S2213-2600(13)70159-0. - DOI - PubMed
    1. Sathyanarayanan V, Neelapu SS. Cancer immunotherapy: strategies for personalization and combinatorial approaches. Mol. Oncol. 2015;9:2043–2053. doi: 10.1016/j.molonc.2015.10.009. - DOI - PMC - PubMed
    1. Kantoff PW, et al. Sipuleucel-T immunotherapy for castration-resistant prostate cancer. N. Engl. J. Med. 2010;363:411–422. doi: 10.1056/NEJMoa1001294. - DOI - PubMed
    1. Rosenberg SA. Raising the bar: the curative potential of human cancer immunotherapy. Sci. Transl. Med. 2012;4:127ps8. doi: 10.1126/scitranslmed.3003634. - DOI - PMC - PubMed
    1. June CH, Riddell SR, Schumacher TN. Adoptive cellular therapy: a race to the finish line. Sci. Transl. Med. 2015;7:280ps7. doi: 10.1126/scitranslmed.aaa3643. - DOI - PubMed

Publication types