. 2017 Sep 19;8(1):583.
doi: 10.1038/s41467-017-00690-6.

RNA localization is a key determinant of neurite-enriched proteome

Affiliations

RNA localization is a key determinant of neurite-enriched proteome

Alessandra Zappulo et al. Nat Commun. .

Abstract

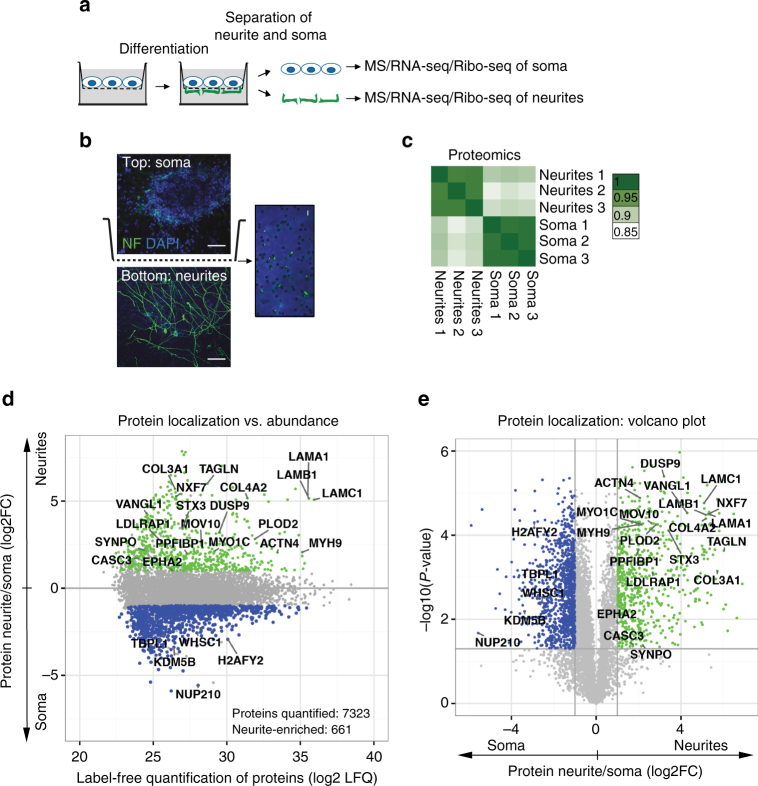
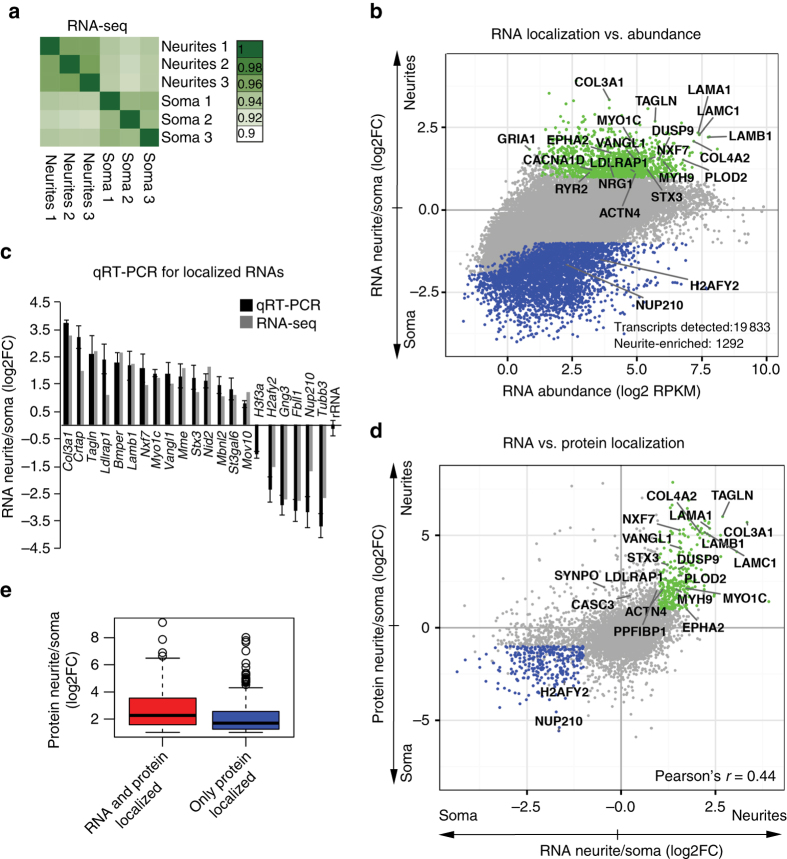
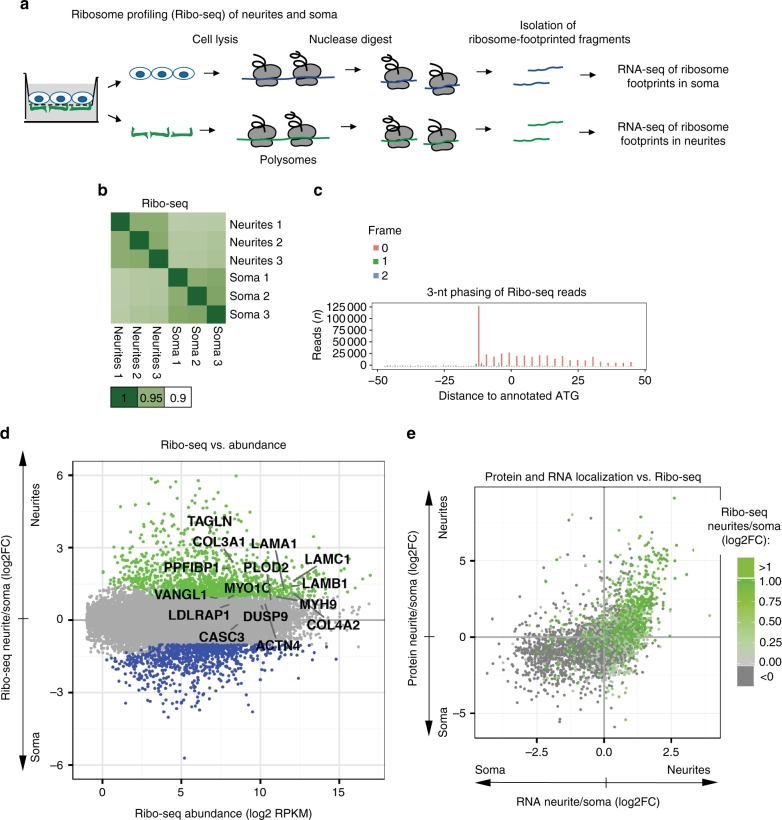
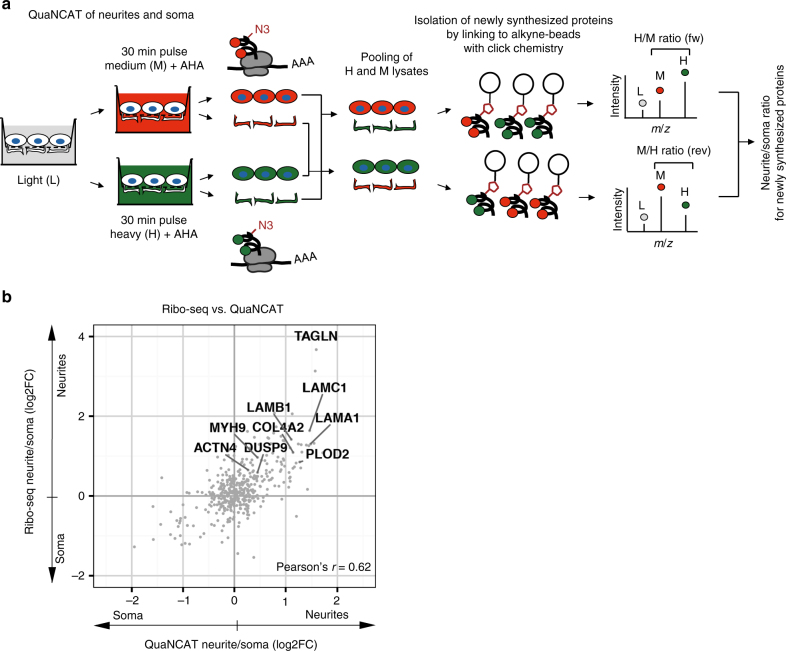
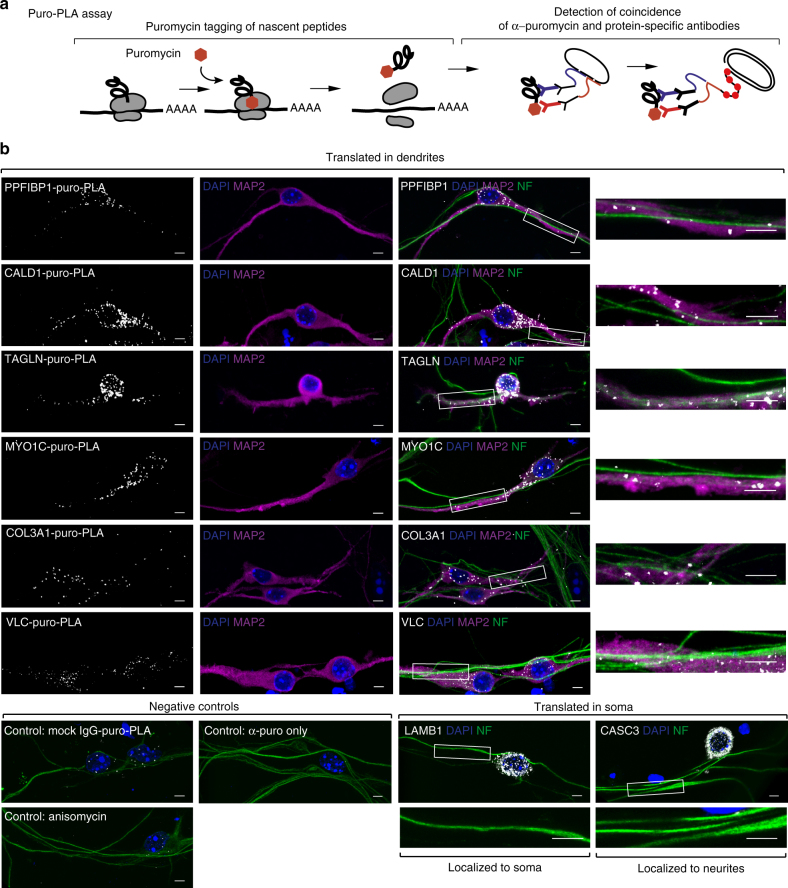
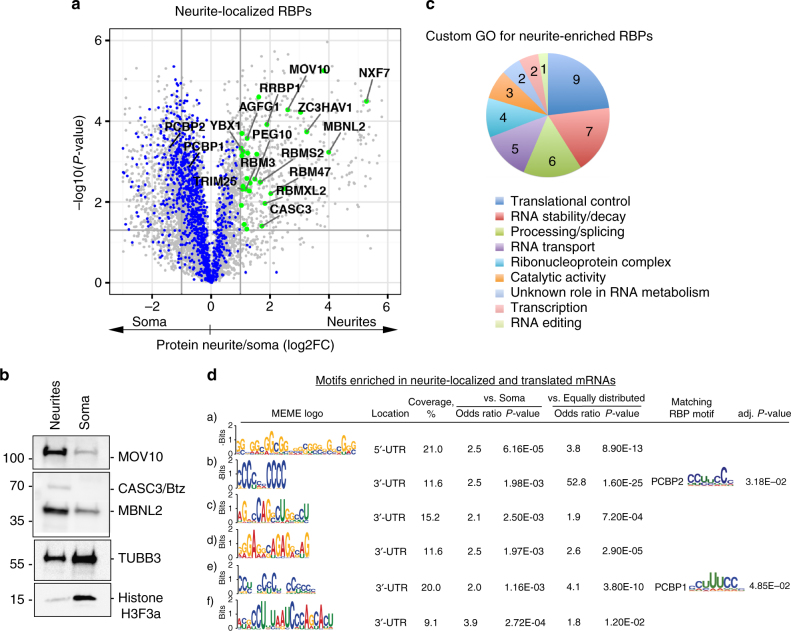
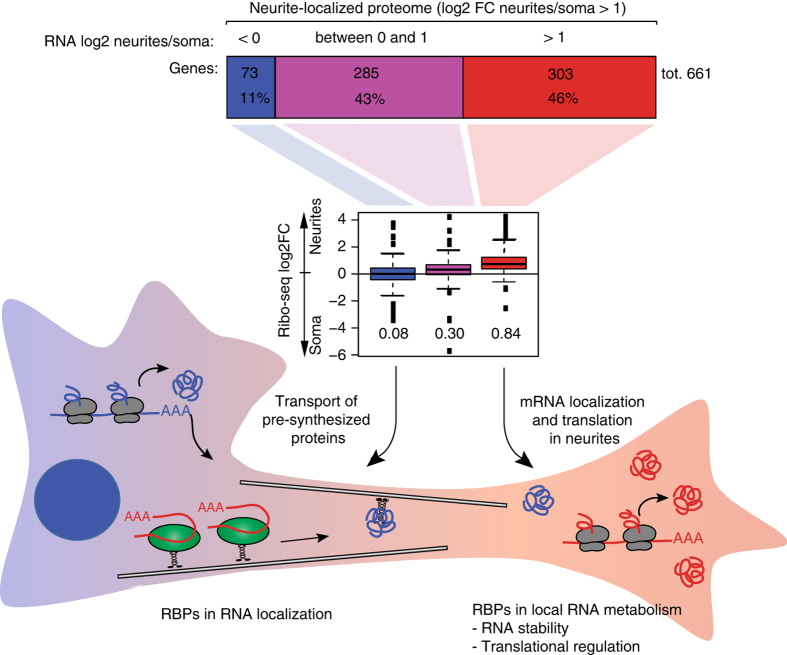
Protein subcellular localization is fundamental to the establishment of the body axis, cell migration, synaptic plasticity, and a vast range of other biological processes. Protein localization occurs through three mechanisms: protein transport, mRNA localization, and local translation. However, the relative contribution of each process to neuronal polarity remains unknown. Using neurons differentiated from mouse embryonic stem cells, we analyze protein and RNA expression and translation rates in isolated cell bodies and neurites genome-wide. We quantify 7323 proteins and the entire transcriptome, and identify hundreds of neurite-localized proteins and locally translated mRNAs. Our results demonstrate that mRNA localization is the primary mechanism for protein localization in neurites that may account for half of the neurite-localized proteome. Moreover, we identify multiple neurite-targeted non-coding RNAs and RNA-binding proteins with potential regulatory roles. These results provide further insight into the mechanisms underlying the establishment of neuronal polarity.Subcellular localization of RNAs and proteins is important for polarized cells such as neurons. Here the authors differentiate mouse embryonic stem cells into neurons, and analyze the local transcriptome, proteome, and translated transcriptome in their cell bodies and neurites, providing a unique resource for future studies on neuronal polarity.


Conflict of interest statement

The authors declare no competing financial interests.

Figures

Fig. 1
Fig. 1
Local proteome of iNeurons. a Separation scheme. iNeurons are grown on a microporous membrane so that cell outgrowths extend on the lower coated side of the membrane to enable separation of the two cellular compartments (soma and neurites). b Fluorescent micrographs of the iNeurons differentiated on a microporous membrane described in a. Images taken above (top) and below (bottom) the membrane. Neurofilament immunostained neurites (green) extend on the lower side of the membrane, whereas soma (DAPI, blue) remain on the top, scale bar = 50 μm. The insert shows the magnification of the membrane with neurites growing through the membrane pores (green), scale bar = 5 μm. c Correlation heatmap of mass spectrometry replicates prepared from neurites and soma of iNeurons (three biological replicates in each case). Mass spectrometry samples were quantified using a label-free quantification method (LFQ). The numbers represent Pearson correlation coefficients of LFQ values. d, e Local proteome from neurites and soma. The data are presented as protein enrichment in neurites versus soma plotted against average LFQ intensities (left) and as a volcano plot (right). Green: neurite-localized proteins (log2FC > 1, P-values < 0.05); blue: soma-localized proteins (log2FC < −1, P-values < 0.05)
Fig. 2
Fig. 2
RNA localization determines protein localization to neurites. a Correlation heatmap of individual RNA-seq libraries prepared from neurites and soma of iNeurons (three biological replicates). Numbers indicate Pearson’s correlation coefficients. b Local transcriptome from neurites and soma. RNA-seq data are presented as RPKM (reads per kilobase of transcript per million mapped reads) and shown as in Fig. 1d. c qRT-PCR for selected neurite-localized RNAs identified by RNA-seq. Histone RNAs and rRNA used as soma-localized and unlocalized controls. Error bars represent SD. d RNA and protein enrichement in neurites of iNeurons. Green: neurite-localized proteins and RNAs (log2FC > 1, P-values < 0.05); blue: soma-localized proteins and RNAs (log2FC < −1, P-values < 0.05). e Average protein enrichment in neurites plotted for the group of genes localized at both protein and RNA level (red) and genes that are localized only at the protein level (blue; log2FC > 1, P-values < 0.05)
Fig. 3
Fig. 3
Ribo-seq of neurites and soma demonstrates that neurite-enriched proteins are locally translated. a Schematic representation of local Ribo-seq. b Correlation heatmap of individual Ribo-seq libraries, prepared from neurites and soma of iNeurons (three biological replicates). c Ribo-seq reads show subcodon resolution supported by a strong bias toward the translated frame (frame 0) and 3 nt periodicity. Read length: 29 nt. d Local Ribo-seq from neurites and soma. Enrichment of Ribo-seq reads in neurite versus soma plotted against average abundance of Ribo-seq reads (RPKM mapped to CDS). Green: transcripts preferentially translated in neurites (neurites/soma log2FC > 1, P-values < 0.05). e RNA enrichment in neurites plotted against protein enrichment as in Fig. 2d, and color-coded for enrichment of Ribo-seq reads in neurites. Green: genes preferentially translated in neurites according the Ribo-seq data
Fig. 4
Fig. 4
QuaNCAT of neurites and soma indicates local translation. a Scheme illustrating QuaNCAT of neurites and soma. H / M (forward experiment) and M / H (reverse experiment) ratios for each protein are the measures of neurite/soma translation rates. b Local translation rates measured by Ribo-seq correlate with QuaNCAT measurements. Averaged neurite/soma QuaNCAT ratios plotted against enrichment of Ribo-seq reads in neurites
Fig. 5
Fig. 5
Validation of local translation by imaging. a Scheme illustrating the principle of puro-PLA assay to visualize specific newly synthesize proteins. b Puro-PLA images of selected newly synthesized proteins in iNeurons. LMNB1 was used as reference for somatically produced proteins. For negative control, cells were pretreated with the protein synthesis inhibitor anisomycin (anisomycin), protein-specific antibody was omitted (α-puro only) or mock rabbit IgG was used instead of specific antibody (mock IgG-puro-PLA). Immunostaining with MAP2 (magenta) and NF (green) enables detection of dendrites (MAP2-positive neurites) and axons (NF-positive, but MAP2-negative neurites). COL3A1, MYO1C, CALD1 (Caldesmon), VCL (Vinculin), TAGLN (Transgelin), and PPFIBP1 are examples of neurite-translated proteins (Ribo-seq log2 neurites/soma = 2.4, 0.9, 1.2, 1.4, 3.7, and 2.1 correspondingly). Btz/CASC3 is a protein that showed no preferential translation in neurites (Ribo-seq log2 neurites/soma = −0.2). Magnifications of neurite sections (inserts) shown next to the images. Scale bar = 5 μm. Puro-PLA signal (white), NF (green), MAP2 (magenta), DAPI (blue). See also Supplementary Fig. 7 for puro-PLA validation on hippocampal neurons and different length of puromycin treatment
Fig. 6
Fig. 6
A subset of RBPs localizes to neurites. a Neurite-localized RBPs. Proteomic data from Fig. 1e were overlaid with available databases of mRNA-bound proteins. Neurite-localized RBPs are highlighted in green (protein neurite/soma log2FC > 1, P-values < 0.05; see also Supplementary Data 2), the rest of RBPs are shown in blue. b Western blot validation for selected neurite-enriched RBPs. Histone H3 and TUBB3 were used as soma-enriched markers. c Manual annotation of neurite-enriched RBPs (protein neurite/soma log2FC > 1 and P-values < 0.05) for RNA-related functions. Number of proteins in a given category is indicated on the pie chart. Some RBPs were annotated to multiple GO categories. See also Supplementary Data 7. d Motifs found in mRNAs localized to neurites and locally translated. Motif discovery was done with MEME and enrichment calculations with MAST. Fisher’s exact test was used to assess statistical significance of the association and its enrichment (odds ratio). Alignment of known RBP target sites (not restricted to neurite-localized RBPs identified in Fig. 6a) was performed using Tomtom; only best hits are shown
Fig. 7
Fig. 7
RNA localization as the key determinant of protein localization and potential functional roles for RBPs. Scheme illustrating the contribution of mRNA localization to neurite-localized proteome. Neurite-localized proteins (proteomics log2 neurites/soma > 1, P-values < 0.05) were split into three groups based on encoding mRNA localization pattern (upper panel): proteins encoded by localized mRNAs (RNA-seq log2 neurites/soma > 1, P-values < 0.05), proteins encoded by moderately enriched mRNA (0 < RNA-seq log2 neurites/soma < 1), and proteins localized to neurites without a significant contribution of mRNA localization (RNA-seq log2 neurites/soma < 0). Boxplot (middle panel) shows mean Ribo-seq log2 neurites/soma values for these three gene categories. Neuron schematic representation (lower panel) illustrates the predominant mechanism of protein localization through local translation of neurite-localized mRNAs

References

    1. Holt CE, Schuman EM. The central dogma decentralized: new perspectives on RNA function and local translation in neurons. Neuron. 2013;80:648–657. doi: 10.1016/j.neuron.2013.10.036. - DOI - PMC - PubMed
    1. Mili S, Moissoglu K, Macara IG. Genome-wide screen reveals APC-associated RNAs enriched in cell protrusions. Nature. 2008;453:115–119. doi: 10.1038/nature06888. - DOI - PMC - PubMed
    1. Lecuyer E, et al. Global analysis of mRNA localization reveals a prominent role in organizing cellular architecture and function. Cell. 2007;131:174–187. doi: 10.1016/j.cell.2007.08.003. - DOI - PubMed
    1. Taylor AM, et al. Axonal mRNA in uninjured and regenerating cortical mammalian axons. J. Neurosci. 2009;29:4697–4707. doi: 10.1523/JNEUROSCI.6130-08.2009. - DOI - PMC - PubMed
    1. Cajigas IJ, et al. The local transcriptome in the synaptic neuropil revealed by deep sequencing and high-resolution imaging. Neuron. 2012;74:453–466. doi: 10.1016/j.neuron.2012.02.036. - DOI - PMC - PubMed

Publication types