. 2017 Sep 19;8(1):588.
doi: 10.1038/s41467-017-00721-2.

A comprehensive characterization of PncA polymorphisms that confer resistance to pyrazinamide

Affiliations

A comprehensive characterization of PncA polymorphisms that confer resistance to pyrazinamide

Adam N Yadon et al. Nat Commun. .

Abstract

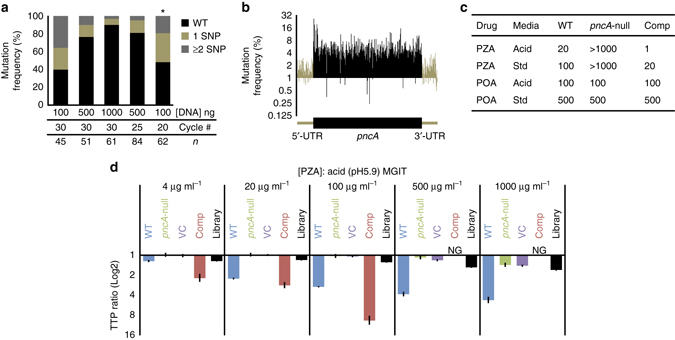
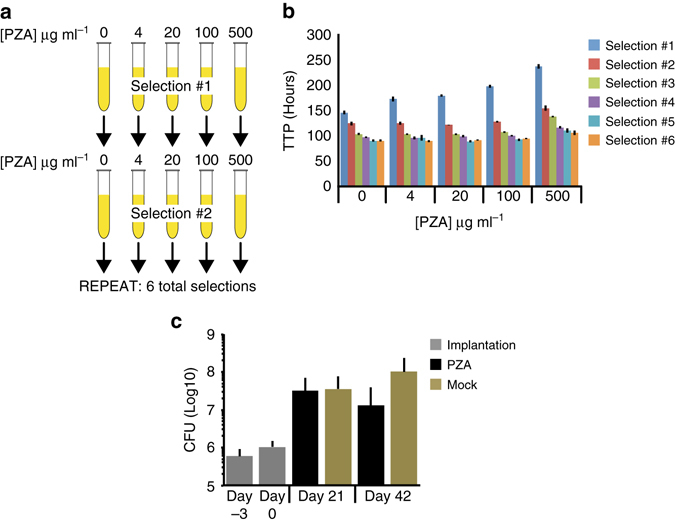
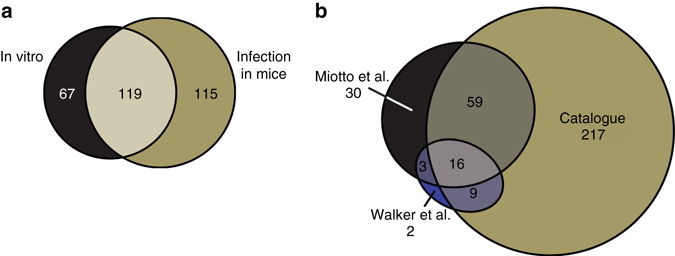
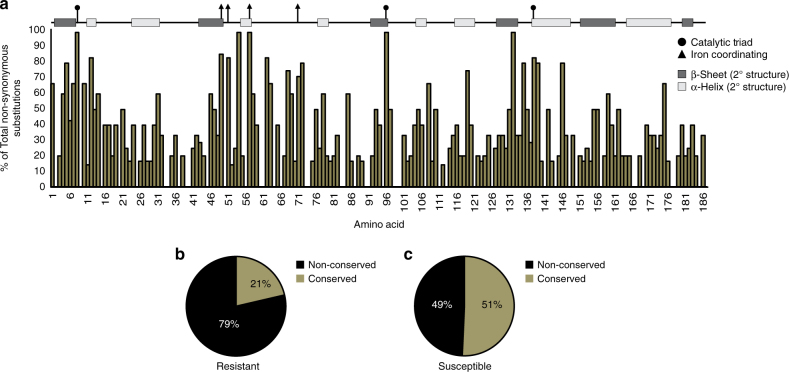
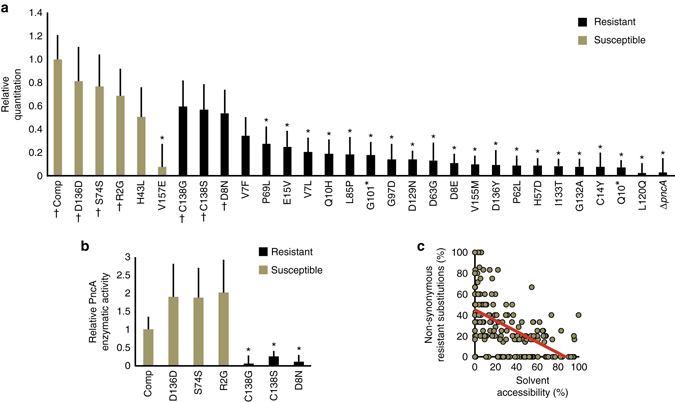
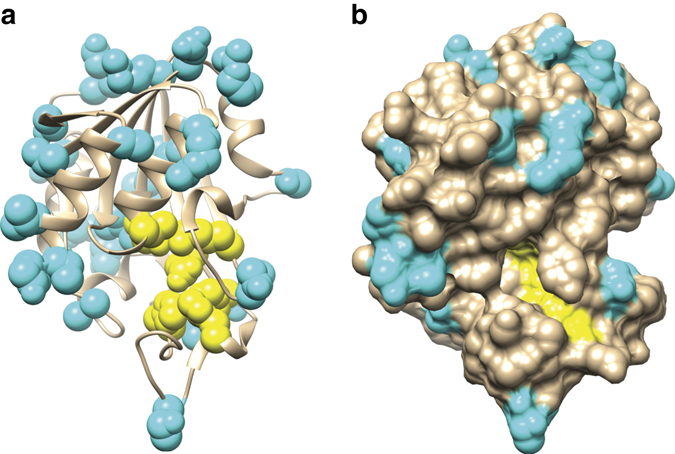
Tuberculosis chemotherapy is dependent on the use of the antibiotic pyrazinamide, which is being threatened by emerging drug resistance. Resistance is mediated through mutations in the bacterial gene pncA. Methods for testing pyrazinamide susceptibility are difficult and rarely performed, and this means that the full spectrum of pncA alleles that confer clinical resistance to pyrazinamide is unknown. Here, we performed in vitro saturating mutagenesis of pncA to generate a comprehensive library of PncA polymorphisms resultant from a single-nucleotide polymorphism. We then screened it for pyrazinamide resistance both in vitro and in an infected animal model. We identify over 300 resistance-conferring substitutions. Strikingly, these mutations map throughout the PncA structure and result in either loss of enzymatic activity and/or decrease in protein abundance. Our comprehensive mutational and screening approach should stand as a paradigm for determining resistance mutations and their mechanisms of action.The antibiotic pyrazinamide is central to tuberculosis treatment regimens, globally. Despite its efficacy, resistance to the drug is increasing. Here, Eric Rubin and colleagues characterise the genetic basis of pyrazinamide resistance.


Conflict of interest statement

The authors declare no competing financial interests.

Figures

Fig. 1
Fig. 1
Generation of a comprehensive pncA mutant library in M. tuberculosis. a Frequency (%) of pncA single-nucleotide polymorphisms in five pncA libraries generated by random PCR mutagenesis using different template concentrations (DNA ng) and cycle numbers (#). n corresponds to the number of single colonies sequenced from each library and * the library selected for screening. b The mean pncA SNP frequency (%) from three biological replicates at each nucleotide of our candidate library relative to the mean of three biological replicates of an unmutagenized wild-type control determined using Illumina sequencing. c Minimum inhibitory concentration (MIC, μg ml-1) of pyrazinamide (PZA) and pyrazinoic acid (POA) for three isogenic control strains, WT, pncA-null, and Comp, in pH 5.9 (Acid) and pH 6.8 (Std) media. d Growth inhibition of four isogenic control strains, WT, pncA-null, Comp and a vector control (VC), and the pncA library with increasing concentrations of pyrazinamide in pH 5.9 (acid) media. Time-to-positivity (TTP) ratio is the mean of the time-to-positivity of the test condition relative to the mean of the no-drug control. A minimum of three biological replicates per strain per test condition was performed. Error bars represent the standard deviations derived from the propagation of error using the quotient of the coefficient of variation from each condition. NG no growth
Fig. 2
Fig. 2
Pyrazinamide selection screens in vitro and during infection in mice. a Schematic diagram of the sequential in vitro pyrazinamide (PZA) selection screen. b Mean time-to-positivity (TTP; hours) of three biological replicates and standard deviations for each round of in vitro selection. c Mean and standard deviations of bacterial burdens (colony-forming units CFU) observed in the spleens of mice at day −3 (implantation; gray), day 0 (start of pyrazinamide treatment; gray) and after 21 and 42 days of pyrazinamide (PZA; black) or mock (brown) treatment. Five mice per time-point were analyzed
Fig. 3
Fig. 3
Catalog of resistant amino acid substitutions after pyrazinamide treatment in vitro and during infection in mice. a Comparison of enriched non-synonymous amino acid substitutions identified after pyrazinamide treatment in vitro and during infection in mice. b Comparison of pyrazinamide resistant non-synonymous amino acid substitutions from this study (Catalog) and from clinical isolates (Miotto et al. and Walker et al.)
Fig. 4
Fig. 4
Pyrazinamide resistant amino acid substitutions occur throughout PncA and are enriched for non-conserved amino acid substitutions. a The proportion (%) of non-synonymous amino acid substitutions represented in the pncA library that were pyrazinamide resistant at each PncA amino acid. Amino acids corresponding to the catalytic triad are marked with a circle. Amino acids responsible for iron coordination are marked with a triangle. b Percentage (%) of non-conserved (black) and conserved (brown) pyrazinamide resistant amino acid substitutions. c Percentage (%) of non-conserved (black) and conserved (brown) pyrazinamide susceptible amino acid substitutions
Fig. 5
Fig. 5
PncA protein abundance and catalytic activity result in pyrazinamide resistance. a Quantitation of PncA protein abundance relative to RpoB in cataloged pyrazinamide susceptible (brown) and resistant (black) isolates determined using mass spectrometry. Protein abundance in each mutant strain is relative to the Comp strain. *P ≤ 0.01 (t-test, two-sided). corresponds to isolates tested for enzymatic activity. The mean fold-change of three biological replicates for each mutant relative to the mean of 10 biological replicates for Comp is shown. Errors bars represent the standard deviations derived from the propagation of error using the quotient of the coefficient of variation. b Mean PncA catalytic activity relative to the Comp strain is shown. *P ≤ 0.05 (t-test, two-sided). Error bars represent the standard deviations derived from three biological replicates for each strain by the propagation of error using the quotient of the coefficient of variation. c Correlation between the solvent accessibility (%) and the proportion (%) of all possible non-synonymous amino acid substitutions that confer pyrazinamide resistance at each amino acid in PncA. Linear trend line is shown in red (r = −0.53)
Fig. 6
Fig. 6
Amino acid substitutions to which no substitution resulted in pyrazinamide resistance (n = 29) map to surface exposed regions of PncA. a Ribbon diagram of the PncA crystal structure. b Surface representation of the PncA crystal structure. Cyan represent amino acids to which no substitution resulted in pyrazinamide resistance. Yellow are active site and iron coordinating amino acids

References

    1. World Health Organization. Global Tuberculosis Report 2016. Report No. WHO/HTM/TB/2016.13 (World Health Organization, Geneva, 2016).
    1. World Health Organization. Treatment of Tuberculosis Guidlines. Report No. WHO/HTM/TB/2009.420 (World Health Organization, Geneva, 2010).
    1. Dawson R, et al. Efficiency and safety of the combination of moxifloxacin, pretomanid (PA-824), and pyrazinamide during the first 8 weeks of antituberculosis treatment: a phase 2b, open-label, partly randomised trial in patients with drug-susceptible or drug-resistant pulmonary tuberculosis. Lancet. 2015;385:1738–1747. doi: 10.1016/S0140-6736(14)62002-X. - DOI - PubMed
    1. Chang KC, et al. Pyrazinamide may improve fluoroquinolone-based treatment of multidrug-resistant tuberculosis. Antimicrob. Agents Chemother. 2012;56:5465–5475. doi: 10.1128/AAC.01300-12. - DOI - PMC - PubMed
    1. Zumla AI, et al. New antituberculosis drugs, regimens, and adjunct therapies: needs, advances, and future prospects. Lancet Infect. Dis. 2014;14:327–340. doi: 10.1016/S1473-3099(13)70328-1. - DOI - PubMed

Publication types

MeSH terms