

Metabolomics As a Tool for the Characterization of Drug-Resistant Epilepsy
- PMID: 28928712
- PMCID: PMC5591409
- DOI: 10.3389/fneur.2017.00459
Metabolomics As a Tool for the Characterization of Drug-Resistant Epilepsy
Abstract
Purpose: Drug resistance is a critical issue in the treatment of epilepsy, contributing to clinical emergencies and increasing both serious social and economic burdens on the health system. The wide variety of potential drug combinations followed by often failed consecutive attempts to match drugs to an individual patient may mean that this treatment stage may last for years with suboptimal benefit to the patient. Given these challenges, it is valuable to explore the availability of new methodologies able to shorten the period of determining a rationale pharmacologic treatment. Metabolomics could provide such a tool to investigate possible markers of drug resistance in subjects with epilepsy.
Methods: Blood samples were collected from (1) controls (C) (n = 35), (2) patients with epilepsy "responder" (R) (n = 18), and (3) patients with epilepsy "non-responder" (NR) (n = 17) to the drug therapy. The samples were analyzed using nuclear magnetic resonance spectroscopy, followed by multivariate statistical analysis.
Key findings: A different metabolic profile based on metabolomics analysis of the serum was observed between C and patients with epilepsy and also between R and NR patients. It was possible to identify the discriminant metabolites for the three classes under investigation. Serum from patients with epilepsy were characterized by increased levels of 3-OH-butyrate, 2-OH-valerate, 2-OH-butyrate, acetoacetate, acetone, acetate, choline, alanine, glutamate, scyllo-inositol (C < R < NR), and decreased concentration of glucose, lactate, and citrate compared to C (C > R > NR).
Significance: In conclusion, metabolomics may represent an important tool for discovery of differences between subjects affected by epilepsy responding or resistant to therapies and for the study of its pathophysiology, optimizing the therapeutic resources and the quality of life of patients.
Keywords: biomarkers; drug-resistant epilepsy; epilepsy; ketone bodies; metabolomics.
Figures
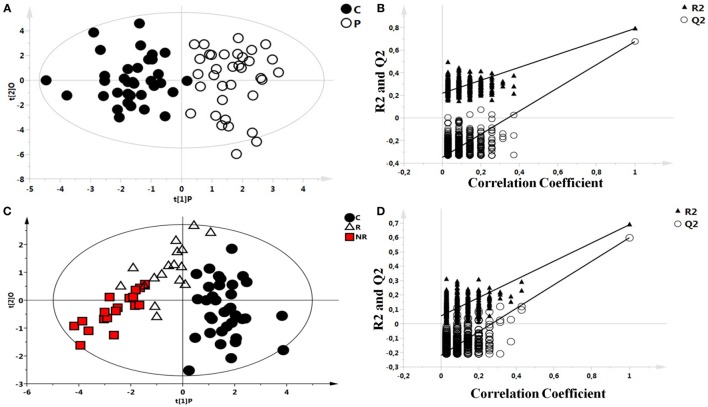
 ). (D) Statistical validation of the corresponding model by permutation test.
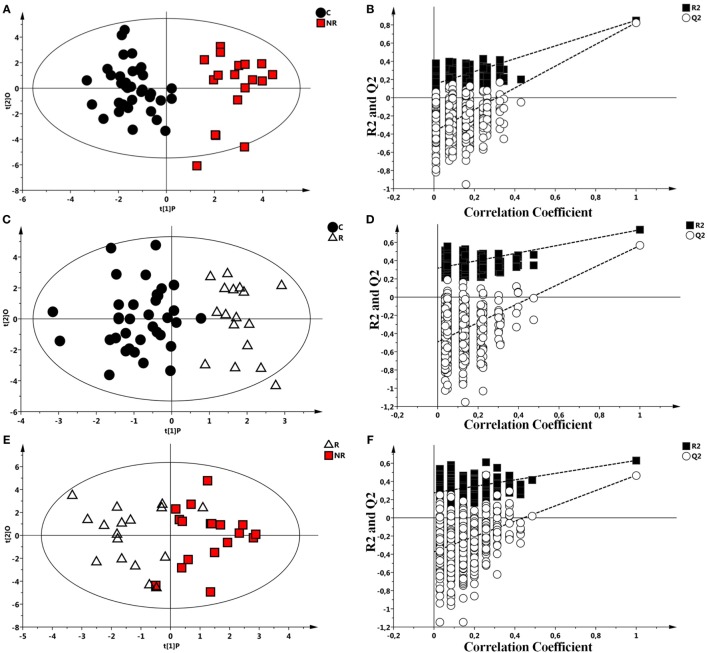 ). (B) Statistical validation of the corresponding model by permutation test (n = 500). (C) OPLS-DA between controls (●) and R patient (Δ) and (D) statistical validation of the corresponding model by permutation test (n = 500). (E) OPLS-DA model between R (Δ) and NR patients (). (F) Statistical validation of the corresponding model by permutation test (n = 500).
Similar articles
-
Translational Metabolomics of Head Injury: Exploring Dysfunctional Cerebral Metabolism with Ex Vivo NMR Spectroscopy-Based Metabolite Quantification.In: Kobeissy FH, editor. Brain Neurotrauma: Molecular, Neuropsychological, and Rehabilitation Aspects. Boca Raton (FL): CRC Press/Taylor & Francis; 2015. Chapter 25. In: Kobeissy FH, editor. Brain Neurotrauma: Molecular, Neuropsychological, and Rehabilitation Aspects. Boca Raton (FL): CRC Press/Taylor & Francis; 2015. Chapter 25. PMID: 26269925 Free Books & Documents. Review.
-
Metabolomics profile in acute respiratory distress syndrome by nuclear magnetic resonance spectroscopy in patients with community-acquired pneumonia.Respir Res. 2022 Jun 27;23(1):172. doi: 10.1186/s12931-022-02075-w. Respir Res. 2022. PMID: 35761396 Free PMC article.
-
1H-NMR-based metabolomics study on coronary heart disease with blood-stasis syndrome and phlegm syndrome.Zhong Nan Da Xue Xue Bao Yi Xue Ban. 2021 Jun 28;46(6):591-600. doi: 10.11817/j.issn.1672-7347.2021.190172. Zhong Nan Da Xue Xue Bao Yi Xue Ban. 2021. PMID: 34275927 Free PMC article. Chinese, English.
-
NMR-based metabolomics in pediatric drug resistant epilepsy - preliminary results.Sci Rep. 2019 Oct 21;9(1):15035. doi: 10.1038/s41598-019-51337-z. Sci Rep. 2019. PMID: 31636291 Free PMC article.
-
Folic acid supplementation and malaria susceptibility and severity among people taking antifolate antimalarial drugs in endemic areas.Cochrane Database Syst Rev. 2022 Feb 1;2(2022):CD014217. doi: 10.1002/14651858.CD014217. Cochrane Database Syst Rev. 2022. PMID: 36321557 Free PMC article.
Cited by
-
Neurological autoantibodies in drug-resistant epilepsy of unknown cause.Ir J Med Sci. 2018 Nov;187(4):1057-1063. doi: 10.1007/s11845-018-1777-2. Epub 2018 Mar 9. Ir J Med Sci. 2018. PMID: 29524102
-
Metabolomics Fingerprint Induced by the Intranigral Inoculation of Exogenous Human Alpha-Synuclein Oligomers in a Rat Model of Parkinson's Disease.Int J Mol Sci. 2020 Sep 14;21(18):6745. doi: 10.3390/ijms21186745. Int J Mol Sci. 2020. PMID: 32937957 Free PMC article.
-
Circulating Metabolites as Potential Biomarkers for Neurological Disorders-Metabolites in Neurological Disorders.Metabolites. 2020 Sep 29;10(10):389. doi: 10.3390/metabo10100389. Metabolites. 2020. PMID: 33003305 Free PMC article.
-
Central Nervous System Metabolism in Autism, Epilepsy and Developmental Delays: A Cerebrospinal Fluid Analysis.Metabolites. 2022 Apr 20;12(5):371. doi: 10.3390/metabo12050371. Metabolites. 2022. PMID: 35629876 Free PMC article.
-
Markers in Status Epilepticus Prognosis.J Clin Neurophysiol. 2020 Sep;37(5):422-428. doi: 10.1097/WNP.0000000000000761. J Clin Neurophysiol. 2020. PMID: 32890064 Free PMC article. Review.
References
Grants and funding
LinkOut - more resources
Full Text Sources
Other Literature Sources
Research Materials